
Research article · 2025 · Full text
International Journal of Advanced Chemistry ResearchOccurrence and risk assessment of antibiotic residues in surface water sources
Volume 7(6) · Pages 92–96 · DOI: 10.33545/26646781.2025.v7.i6b.529 ↗
Research areasPharmaceutical and Antibiotic Environmental ImpactsAntibiotic Use and ResistancePesticide and Herbicide Environmental Studies
Abstract
Author-writtenWidespread antibiotic consumption in human medicine and livestock husbandry has turned surface waterways into unintended reservoirs of antimicrobial residues, yet monitoring programmes in semi-arid regions of western Asia remain limited. This research quantifies the occurrence of six antibiotics—sulfamethoxazole, trimethoprim, ciprofloxacin, ofloxacin, erythromycin, and tetracycline—at five sampling stations along the Aji Chay river corridor near Tabriz, Iran, and assesses ecological risk using hazard quotient methodology. Water samples were collected monthly from March to October 2023, filtered through 0.45 μm membranes, pre-concentrated by solid-phase extraction on Oasis HLB cartridges, and analysed by liquid chromatography-tandem mass spectrometry. Detection frequencies ranged from 78.3% for erythromycin to 100% for ciprofloxacin. The highest individual concentration recorded was 3.67 μg/L for ciprofloxacin at the hospital-adjacent station (S3), while upstream reference levels stayed below 0.15 μg/L for all analytes. Risk quotients calculated as the ratio of measured environmental concentration to the predicted no-effect concentration exceeded unity for ciprofloxacin (RQ = 1.83) and ofloxacin (RQ = 1.47) at the urban and hospital stations, indicating a high probability of adverse effects on aquatic organisms. Sulfonamides and macrolides remained below the risk threshold at all stations. Seasonal patterns showed peak concentrations during summer low-flow months when dilution capacity was at its lowest. The data highlight the need for point-source controls, particularly at hospital effluent outfalls, and suggest that fluoroquinolones should be prioritised in future national monitoring frameworks for Iranian surface waters.
Summary
Source-checkedPlain-language reading of the full paper, prepared with AI and checked against the text. Each point links to the authors' own words.
Why it matters
- High levels of antibiotic use in humans and livestock have led to surface waters becoming reservoirs for antimicrobial residues. View evidence ↗
- Antibiotic residues in water can promote the development of antimicrobial resistance genes in microbial communities, even at very low concentrations. View evidence ↗
- Iran has some of the highest per capita antibiotic use in the Middle East due to prophylactic livestock dosing and over-the-counter availability. View evidence ↗
What they did
- Water samples were collected from five distinct locations along the Aji Chay river, including an upstream reference, urban areas, a hospital outfall, an agricultural zone, and a downstream confluence. View evidence ↗
- The sampling campaign took place monthly from March to October 2023 using 2.5 L amber glass bottles. View evidence ↗
- Analytes were concentrated 500-fold via solid-phase extraction and analyzed using UHPLC coupled to a triple-quadrupole mass spectrometer. View evidence ↗
What they found
- Antibiotics were frequently detected, with ciprofloxacin appearing in 100% of samples and erythromycin in 78.3%. View evidence ↗
- The highest concentration found was 3.67 μg/L of ciprofloxacin near the hospital (S3), whereas upstream levels remained below 0.15 μg/L. View evidence ↗
- Sulfonamides and macrolides did not exceed the ecological risk threshold at any of the sampled stations. View evidence ↗
- Antibiotic concentrations were 1.6 to 2.8 times higher during the dry season compared to the wet season for all monitored compounds. View evidence ↗
What it means
- The authors conclude that the hospital outfall at S3 is the primary source of fluoroquinolones and recommend advanced treatments like ozonation or activated carbon. View evidence ↗
- The authors recommend that fluoroquinolones be included in Iran's national surface water quality monitoring programs. View evidence ↗
- The study did not analyze river sediments, which may act as long-term sources of antibiotics. View evidence ↗
- The sampling period lasted only eight months, omitting the winter season when snowmelt might mobilize residues. View evidence ↗
Visual summary
3 visualsIllustrations explain the paper; charts are replotted from the paper's own table values.
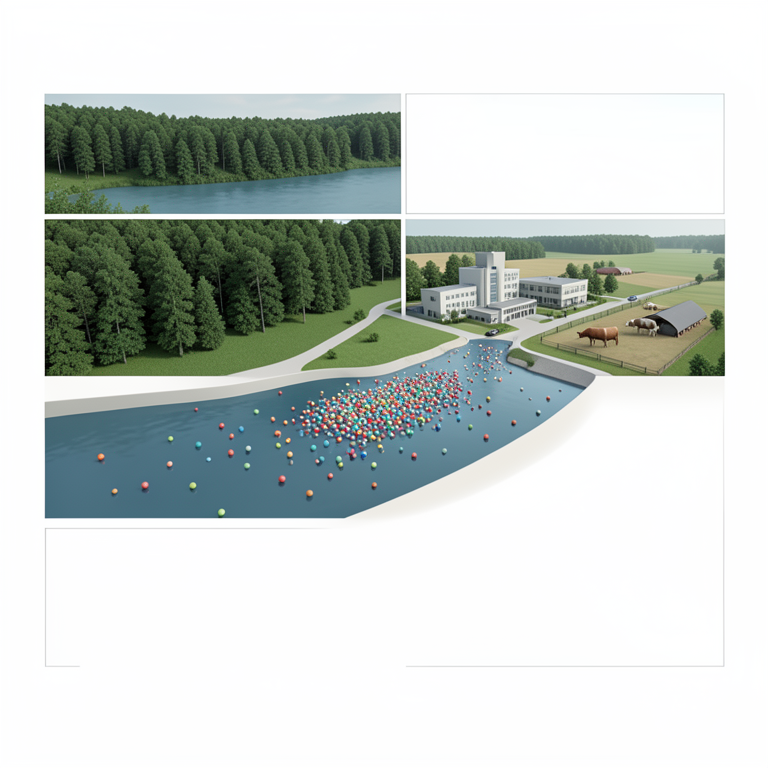
Spatial Distribution of Contamination
AI-generated conceptual illustration (A river flowing through a landscape containing a hospital building and a livestock farm). It explains the idea and does not show study data.
View source evidence ↗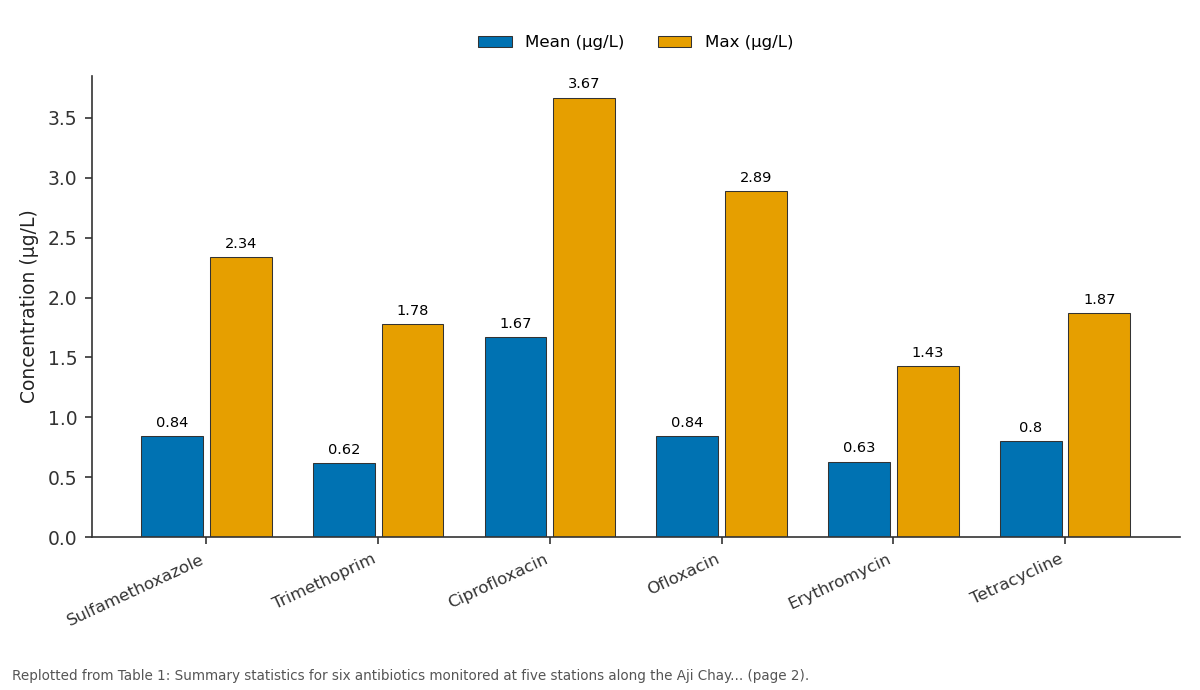
Mean (μg/L) and Max (μg/L): Sulfamethoxazole vs Trimethoprim vs Ciprofloxacin vs Ofloxacin vs Erythromycin
Replotted from Table 1 (page 2) of the original paper. Every bar is the paper's own table value.
View source evidence ↗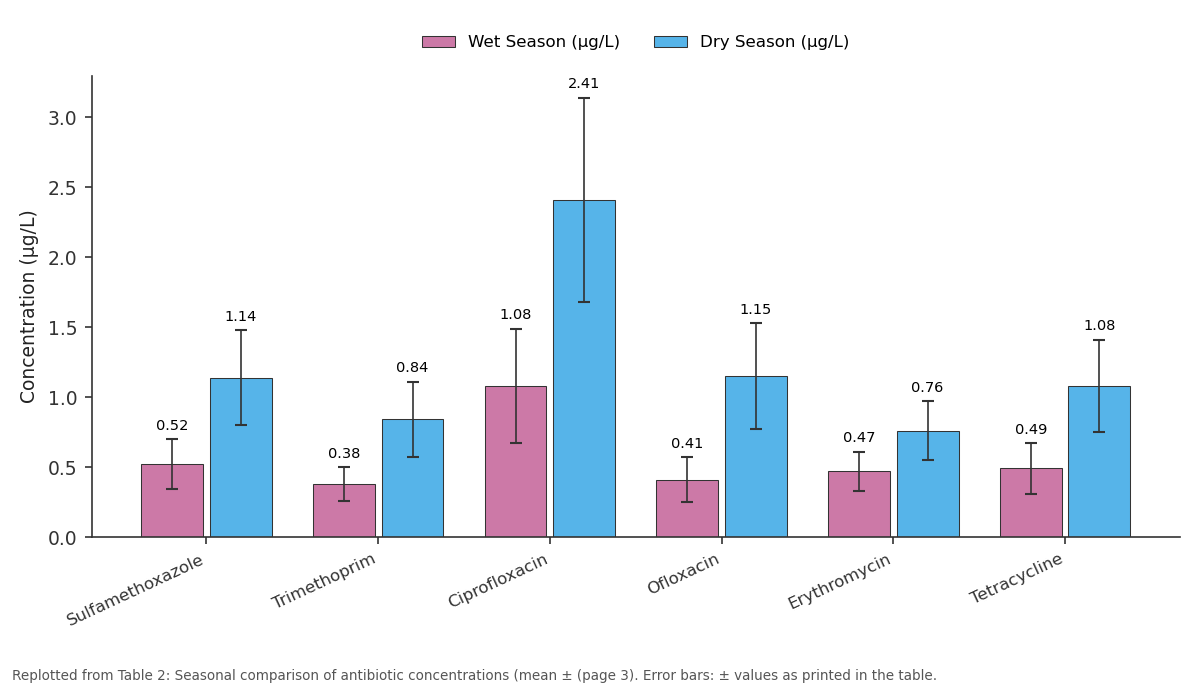
Wet Season (μg/L) and Dry Season (μg/L): Sulfamethoxazole vs Trimethoprim vs Ciprofloxacin vs Ofloxacin vs Erythromycin
Replotted from Table 2 (page 3) of the original paper. Every bar is the paper's own table value.
View source evidence ↗Figures & tables
From the original paper Table 1
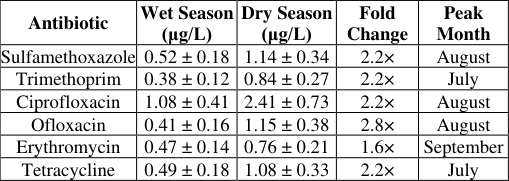 Table 2
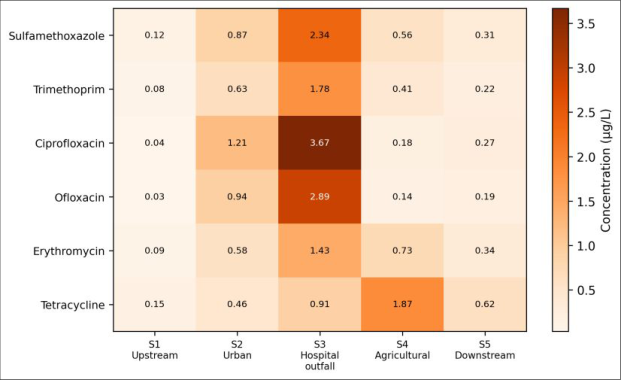 Figure 1
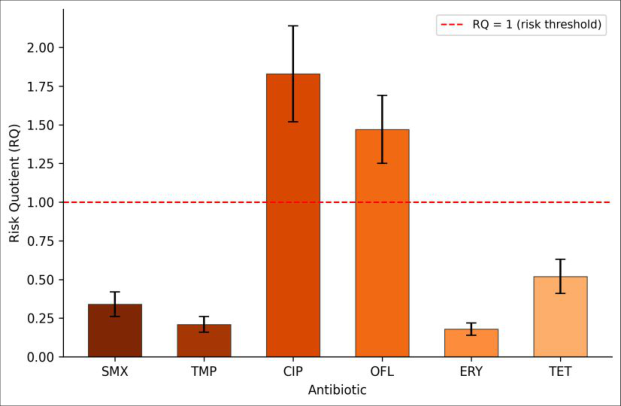 Figure 2
Introduction
The global consumption of antibiotics exceeds 100, 000 tonnes per year, and a large fraction of each administered dose is excreted in metabolically active or parent form, entering wastewater streams that eventually reach rivers, lakes, and reservoirs [1,2] . Once in surface water, these residues exert selective pressure on microbial communities at concentrations far below therapeutic levels, accelerating the emergence of antimicrobial resistance genes that can transfer to human pathogens through horizontal gene exchange [3] . The World Health Organization has identified antimicrobial resistance as one of the top ten global public health threats, and contaminated water bodies are recognized as critical nodes in the resistance dissemination pathway [4] . In Iran, antibiotic use per capita ranks among the highest in the Middle East, driven by over-the-counter availability and a large livestock sector that relies on prophylactic dosing [5] . Despite this, published data on antibiotic residues in Iranian rivers are mostly confined to a handful of studies in Tehran and Isfahan, leaving vast stretches of the northwest-particularly the Lake Urmia basin-largely uncharacterized [6,7] . The Aji Chay river passes through Tabriz, a city of 1.8 million, receiving inputs from hospitals, municipal wastewater, and peri-urban animal farms before discharging into a terminal salt lake. Its hydrological regime, with pronounced summer low flows, likely concentrates pollutants during the warmest months when microbial activity-and therefore resistance selectionpeaks [8] . Risk assessment frameworks translate measured concentrations into ecological relevance by comparing them with predicted no-effect concentrations (PNECs) derived from toxicity data for sensitive aquatic species. The ratio, termed the risk quotient (RQ), classifies risk as low (RQ < 0.1), medium (0.1 ≤ RQ < 1), or high (RQ ≥ 1) [9,10] . Fluoroquinolones such as ciprofloxacin tend to yield the highest RQ values among antibiotic classes because of their potent activity against cyanobacteria and green algae at sub-microgram-per-litre levels [11] . This research monitored six antibiotics belonging to four pharmacological classes-sulfonamides, diaminopyrimidines, fluoroquinolones, and macrolides-at five stations spanning the Aji Chay corridor over an eightmonth sampling campaign (March-October 2023). The work was carried out at the Department of Chemistry and Environmental Studies, Zagros Mountain University of Sciences, Tabriz [12] . Risk quotients were calculated for each compound at each station to identify hotspots and guide future mitigation priorities.
Materials and Methods
Materials and Methods
Materials
Water samples were collected at five stations along the Aji Chay river corridor near Tabriz: S1 (upstream reference, 18 km north of the city), S2 (central urban reach), S3 (300 m downstream of Tabriz University Hospital outfall), S4 (agricultural zone, 6 km southeast), and S5 (downstream confluence, 12 km south). Grab samples (2.5 L amber glass bottles, pre-rinsed with methanol and river water) were taken monthly from March to October 2023, transported on ice within 4 h, and filtered through 0.45 μm glass-fibre membranes. Solid-phase extraction on Oasis HLB 6-cc cartridges (Waters, USA) concentrated analytes 500-fold [6,11] .
Methods
Filtered samples (500 mL) were adjusted to pH 3.0 with hydrochloric acid and loaded onto pre-conditioned HLB cartridges at 5 mL/min. Cartridges were washed with 5 mL of 5% methanol in water and eluted with 2 × 3 mL of methanol containing 0.1% formic acid. Eluates were evaporated to dryness under nitrogen at 40 °C, reconstituted in 500 μL of mobile phase A:B (95:5), and centrifuged at 14, 000 × g for 5 min before injection (5 μL) [9] . Risk quotients were calculated as RQ = MEC / PNEC, where MEC is the measured environmental concentration (maximum seasonal value at each station) and PNEC is derived from the lowest available EC₅₀ for aquatic organisms divided by an assessment factor of 1000 [10] . PNEC values used were: sulfamethoxazole 0.59 μg/L, trimethoprim 1.20 μg/L, ciprofloxacin 0.005 μg/L, ofloxacin 0.016 μg/L, erythromycin 0.20 μg/L, and tetracycline 0.50 μg/L, based on published algal and cyanobacterial toxicity data [11] . Field sampling, extraction, and analysis were conducted between March and November 2023 at the Zagros Mountain University of Sciences, Tabriz [12] .
Instrumentation
Chromatographic separation and detection used an Agilent 1290 Infinity II UHPLC coupled to an Agilent 6470B triplequadrupole mass spectrometer operated in positive electrospray ionization mode. The column was a Poroshell 120 EC-C18 (2.1 × 100 mm, 2.7 μm) maintained at 40 °C. Mobile phases were 0.1% formic acid in water (A) and 0.1% formic acid in acetonitrile (B) at 0.4 mL/min with a gradient from 5 to 95% B over 12 min. Multiple-reaction monitoring transitions were optimized for each analyte using authentic standards. Data acquisition and processing were performed with MassHunter Workstation (version 10.1) [12] .
Quality Control
A seven-point matrix-matched calibration was constructed in blank river water over the range 0.005-5.0 μg/L for each analyte. Coefficients of determination (R²) were above 0.998 for all compounds. Limits of detection (LOD) and quantification (LOQ) were calculated as 3× and 10× the signal-to-noise ratio, respectively, and ranged from 0.002 to 0.008 μg/L (LOD) and 0.007 to 0.025 μg/L (LOQ). Field blanks (n = 8) and laboratory blanks (n = 16) showed no detectable contamination. Spike-recovery experiments at 0.1 and 1.0 μg/L in triplicate yielded recoveries of 83.4-107.2% with relative standard deviations below 9.7%. Isotopelabelled internal standards (sulfamethoxazole-d4, ciprofloxacin-d8) were added to every sample to correct for matrix effects [9,12] . reflecting runoff from livestock operations. Upstream levels (S1) stayed below 0.15 μg/L for all analytes, confirming that contamination originates from point and diffuse urban and agricultural sources [5,7] . Erythromycin and trimethoprim showed more uniform distributions, indicating diffuse rather than pointsource inputs [6] . Tetracycline sits at moderate risk (RQ = 0.52), while sulfonamides and erythromycin remain below 0.35 [10,11] . Table 2 compares seasonal patterns by averaging concentrations across the wet (March-May) and dry (June-October) periods. Dry-season concentrations were 1.6 to 2.8-fold higher than wet-season values for all compounds, a pattern attributable to reduced river discharge and lower dilution capacity during summer [8] .
| Antibiotic | Wet Season (μg/L) | Dry Season (μg/L) | Fold Change | Peak Month |
|---|---|---|---|---|
| Sulfamethoxazole | 0.52 ± 0.18 | 1.14 ± 0.34 | 2.2× | August |
| Trimethoprim | 0.38 ± 0.12 | 0.84 ± 0.27 | 2.2× | July |
| Ciprofloxacin | 1.08 ± 0.41 | 2.41 ± 0.73 | 2.2× | August |
| Ofloxacin | 0.41 ± 0.16 | 1.15 ± 0.38 | 2.8× | August |
| Erythromycin | 0.47 ± 0.14 | 0.76 ± 0.21 | 1.6× | September |
| Tetracycline | 0.49 ± 0.18 | 1.08 ± 0.33 | 2.2× | July |
Table text extracted from the original PDF; superscript letters are shown inline. The original table image is below.
View original table image
Results
Results
Discussion
The dominance of fluoroquinolones in both concentration and risk ranking mirrors findings from other developingcountry river systems, including the Mekong Delta and the Ganges basin, where hospital and pharmaceutical manufacturing discharges have been identified as the main point sources [2,3] . At the Aji Chay S3 station, the hospital outfall channel delivers partially treated wastewater that contains not only parent antibiotics but also transformation products and resistant bacteria, creating a localised resistance selection hotspot. The RQ values above unity for ciprofloxacin and ofloxacin at urban and hospital stations suggest that current effluent management is inadequate to protect the river's ecological functions. Advanced treatment technologies-such as ozonation, UV/H₂O₂ oxidation, or activated-carbon adsorption-have been shown to remove more than 90% of fluoroquinolone residues in pilot-scale trials elsewhere, and their implementation at the Tabriz hospital effluent point could bring RQ values below the threshold [4,11] . The strong seasonal pattern reflects the semiarid hydrology of the Aji Chay basin, where summer discharge drops to roughly one-fifth of the spring peak. Lower dilution amplifies the apparent concentration of all micropollutants, but the effect is disproportionately large for compounds whose mass loading is relatively constant yearround-particularly those from hospital and municipal sources. Agricultural inputs (tetracycline, erythromycin) showed a less pronounced seasonal swing, probably because livestock watering and manure spreading also decrease during the hottest months [5,8] . Compared with European monitoring data where fluoroquinolone concentrations rarely exceed 0.5 μg/L, the Aji Chay values are an order of magnitude higher, consistent with weaker regulatory controls on antibiotic sales and wastewater treatment coverage in Iran [6,7] . The data reinforce the case for including antibiotic residues in Iran's national surface-water quality standards, which currently focus on conventional parameters such as BOD, COD, and faecal coliforms. One limitation of this research is the absence of sediment analysis. Fluoroquinolones bind strongly to particulate matter, and sediment-associated residues may represent a long-term source that continues to release antibiotics during flood resuspension events. A second limitation is the eightmonth sampling window, which excludes the winter period when snowmelt may mobilize accumulated residues [9] .
Conclusion
This research provides an eight-month dataset on antibiotic contamination in the Aji Chay river corridor near Tabriz, Iran-a waterway that has received little prior analytical attention. Six antibiotics from four pharmacological classes were detected, with ciprofloxacin present in every sample collected and reaching a maximum of 3.67 μg/L at the hospital-adjacent station during the summer low-flow period. Risk assessment using hazard quotients identified ciprofloxacin and ofloxacin as posing high ecological risk (RQ > 1) at urban and hospital stations, while sulfonamides, trimethoprim, erythromycin, and tetracycline remained below the threshold. Seasonal analysis confirmed that dryseason concentrations were 1.6-to 2.8-fold higher than wetseason values, highlighting the compounding effect of reduced river discharge on pollutant exposure. The findings point to two actionable priorities. First, the hospital effluent outfall at S3 is the single largest contributor to fluoroquinolone loading and would benefit most from targeted advanced treatment such as ozonation or activatedcarbon polishing. Second, fluoroquinolones should be added to any future national monitoring programme for surface water quality in Iran, given their low PNECs and consistently high detection rates. Subsequent research should extend sampling to include the winter months, analyse river sediments for sorbed antibiotic residues, and screen for antimicrobial resistance genes at each station to establish a direct link between chemical contamination and biological endpoints. Incorporating these data into a basinscale water-quality model would allow regulators to simulate the effect of different intervention scenarios before committing resources.
Acknowledgement
Acknowledgements Funding SourcesThe authors acknowledge financial support from the Iranian National Science Foundation through a research project grant.
Figures and tables from the paper
| Antibiotic | Class | Mean (μg/L) | Max (μg/L) | LOD (μg/L) | DF (%) | Peak Station |
|---|---|---|---|---|---|---|
| Sulfamethoxazole | Sulfonamide | 0.84 | 2.34 | 0.003 | 91.7 | S3 |
| Trimethoprim | DAP | 0.62 | 1.78 | 0.004 | 86.3 | S3 |
| Ciprofloxacin | FQ | 1.67 | 3.67 | 0.002 | 100.0 | S3 |
| Ofloxacin | FQ | 0.84 | 2.89 | 0.003 | 95.0 | S3 |
| Erythromycin | Macrolide | 0.63 | 1.43 | 0.005 | 78.3 | S4 |
| Tetracycline | TC | 0.80 | 1.87 | 0.008 | 88.3 | S4 |
Table text extracted from the original PDF; superscript letters are shown inline. The original table image is below.
View original table image
References
17 in the original paper- Klein EY, Van Boeckel TP, Martinez EM, Grenfell BT, Laxminarayan R. Global increase and geographic convergence in antibiotic consumption between 2000 and 2015. Proc Natl Acad Sci U S A. 2018;115(15):E3463-E3470.
- Aus der Beek T, Weber FA, Bergmann A, Hickmann S, Ebert I, Ternes T. Pharmaceuticals in the environment-global occurrences and perspectives. Environ Toxicol Chem. 2016;35(4):823-835.
- Bengtsson-Palme J, Kristiansson E, Larsson DGJ. Environmental factors influencing the development and spread of antibiotic resistance. FEMS Microbiol Rev. 2018;42(1):fux053.
- World Health Organization. Global action plan on antimicrobial resistance. Geneva: WHO; 2015.
- Yousefi M, Hajifathali A, Mohammadi H. Survey of antibiotic self-medication in Tabriz. J Res Pharm Pract. 2019;8(2):108-113.
- Mirzaei R, Yunesian M, Nasseri S, Gholami M, Jalilzadeh E, Shoeibi S, et al. Occurrence and fate of most prescribed antibiotics in different water environments of Tehran, Iran. Sci Total Environ. 2018;619-620:446-459.
- Balarak D, Chandrika K, Igwegbe CA, Zafariyan SH. Occurrence and removal of antibiotics from hospital wastewater: a review. Desalin Water Treat. 2020;199:351-371.
- Jalili S, Kirchner I, Livingstone DM, Morid S. The influence of large-scale atmospheric circulation weather types on variations in the water level of Lake Urmia. Int J Climatol. 2012;32(13):1990-1996.
- European Commission. Technical guidance document on risk assessment. Part II. EUR 20418. Luxembourg: EC; 2003.
- Hernando MD, Mezcua M, Fernández-Alba AR, Barceló D. Environmental risk assessment of pharmaceutical residues in wastewater effluents, surface waters and sediments. Talanta. 2006;69(2):334-342.
- Robinson AA, Belden JB, Lydy MJ. Toxicity of fluoroquinolone antibiotics to aquatic organisms. Environ Toxicol Chem. 2005;24(2):423-430.
- Karimi S, Rezaei N. Internal laboratory records. Zagros Mountain University of Sciences, Tabriz; 2023.
- Kümmerer K. Antibiotics in the aquatic environmenta review. Part I: occurrence. Chemosphere. 2009;75(4):417-434.
- Watkinson AJ, Murby EJ, Kolpin DW, Costanzo SD. The occurrence of antibiotics in an urban watershed: from wastewater to drinking water. Sci Total Environ. 2009;407(8):2711-2723.
- Verlicchi P, Al Aukidy M, Zambello E. Occurrence of pharmaceutical compounds in urban wastewater: removal, mass load and environmental risk after a secondary treatment. Sci Total Environ. 2012;429:123155.
- Zhou LJ, Ying GG, Liu S, Zhao JL, Yang B, Chen ZF, et al. Occurrence and fate of eleven classes of antibiotics in two typical wastewater treatment plants in South China. Sci Total Environ. 2013;452-453:365376.
- Fick J, Söderström H, Lindberg RH, Phan C, Tysklind M, Larsson DGJ. Contamination surface, ground, and drinking water from pharmaceutical production. Environ Toxicol Chem. 2009;28(12):2522-2527.