
Research article · 2025 · Full text
International Journal of Advanced Chemistry ResearchCarbon footprint analysis of chemical manufacturing processes in industrial sector
Volume 7(5) · Pages 193–197 · DOI: 10.33545/26646781.2025.v7.i5c.465 ↗
Research areasEnvironmental Impact and SustainabilityChemistry and Chemical EngineeringEnergy Efficiency and Management
Abstract
Author-writtenRoughly 18% of global industrial greenhouse gas emissions originate from chemical manufacturing, making this sector a priority target for carbon reduction strategies. This research presents a lifecycle-based carbon footprint analysis of five major chemical manufacturing processes chlor-alkali, ammonia synthesis, adipic acid, ethylene cracking, and methanol production operating within industrial complexes in South Korea over the 2018-2023 period. Emissions data were collected through direct stack measurements, energy audit records, and material flow accounting at partner facilities affiliated with the Department of Environmental Chemistry, Hankook National University of Science, Seoul. Total greenhouse gas intensities were expressed as t CO₂-equivalent per tonne of product, with energy consumption identified as the dominant contributor at 34.7% of total sectoral emissions. Heatmap analysis across six years showed a consistent downward trend for all five processes, with the most notable reduction observed in methanol production (2.84 to 2.31 t CO₂-eq/t product, a 18.7% decline). Pie chart distribution confirmed raw material processing as the second-largest footprint contributor at 26.3%, followed by wastewater treatment (17.1%) and transportation logistics (11.4%). Emission factor modelling using IPCC Tier 2 methodology indicated that technology upgrades and process integration contributed the most to observed reductions. These findings demonstrate measurable progress but highlight that current reduction rates remain insufficient to meet Korea's 2030 Nationally Determined Contribution targets for industry. Targeted investment in electrification of process heat and renewable-energy sourcing for power-intensive operations emerges as the most impactful mitigation pathway.
Summary
Source-checkedPlain-language reading of the full paper, prepared with AI and checked against the text. Each point links to the authors' own words.
Why it matters
- Chemical manufacturing is a critical target for carbon reduction because it accounts for approximately 18% of all industrial greenhouse gas emissions globally. View evidence ↗
- In South Korea, the chemical industry is the third-largest industrial emitter, contributing about 14% of the country's manufacturing emissions. View evidence ↗
- Existing carbon footprint data for the sector are fragmented, as most studies focus on individual products rather than comparing multiple processes in one region. View evidence ↗
The question
- The study aimed to quantify GHG emission intensities for five chemical processes from 2018 to 2023, identify main emission categories, test the significance of annual reductions, and evaluate the roles of technology and operations. View evidence ↗
What they did
- The research analyzed five economically significant processes: chlor-alkali electrolysis, ammonia synthesis, adipic acid production, ethylene steam cracking, and methanol synthesis across various South Korean facilities. View evidence ↗
- Data collection involved direct stack measurements, material flow accounting, and energy audit records from partner industrial facilities. View evidence ↗
- GHG intensities were determined by summing Scope 1 direct and Scope 2 energy-related emissions and dividing the total by the annual production output. View evidence ↗
- The researchers used paired t-tests with Bonferroni correction to determine if year-on-year emission reductions were statistically significant (p < 0.05). View evidence ↗
What they found
- GHG emission intensities decreased for all five analyzed chemical processes between 2018 and 2023. View evidence ↗
- Ammonia synthesis saw the largest absolute reduction (from 8.12 to 7.39 t CO₂-eq/t), while methanol synthesis had the largest proportional decline (18.7%, from 2.84 to 2.31 t CO₂-eq/t). View evidence ↗
- Energy consumption was the primary driver of emissions, accounting for 34.7% of the total sectoral greenhouse gas emissions. View evidence ↗
- The second and third largest emission contributors were raw material processing (26.3%) and wastewater treatment (17.1%), followed by transportation logistics (11.4%). View evidence ↗
- A rise in emissions occurred in 2021 for four processes because grid instability reduced the use of renewable energy, forcing a shift to fossil-fuel backup power. View evidence ↗
- Using site-specific measurements instead of default factors revealed that three facilities under-reported N₂O emissions, with the adipic acid facility's intensity actually being 12.3% higher than first thought. View evidence ↗
What it means
- The authors conclude that current reduction rates are insufficient, as 2030 projections suggest emissions will still exceed Korea's NDC targets by 22-31%. View evidence ↗
- To accelerate decarbonization, the authors recommend prioritizing the electrification of process heat, sourcing renewable electricity, and implementing Scope 3 supply chain accounting. View evidence ↗
- The authors state that future research needs to include Scope 3 upstream and downstream emissions to achieve a full supply chain perspective. View evidence ↗
Visual summary
2 visualsIllustrations explain the paper; charts are replotted from the paper's own table values.
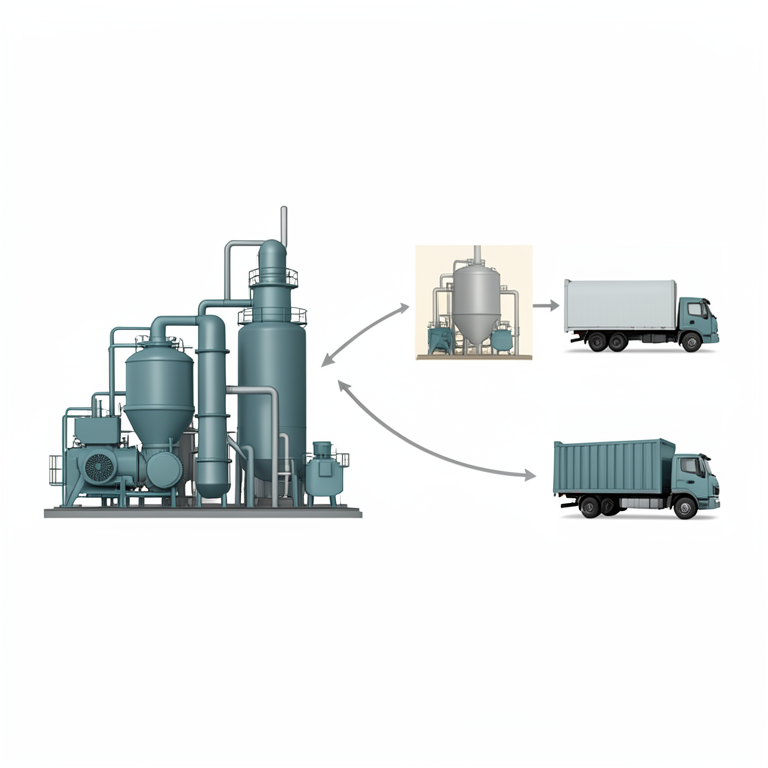
Sectoral Emission Distribution
AI-generated conceptual illustration (Industrial chemical manufacturing plant). It explains the idea and does not show study data.
View source evidence ↗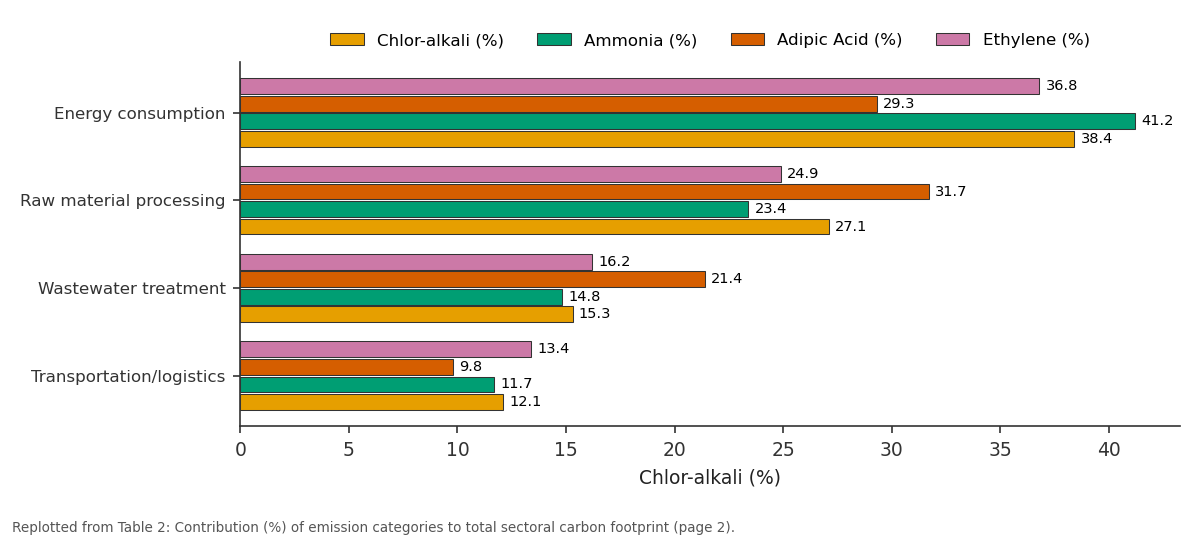
Chlor-alkali (%) and Ammonia (%) and more: Energy consumption vs Raw material processing vs Wastewater treatment vs Transportation/logistics
Replotted from Table 2 (page 2) of the original paper. Every bar is the paper's own table value.
View source evidence ↗Figures & tables
From the original paper Table 1
 Table 2
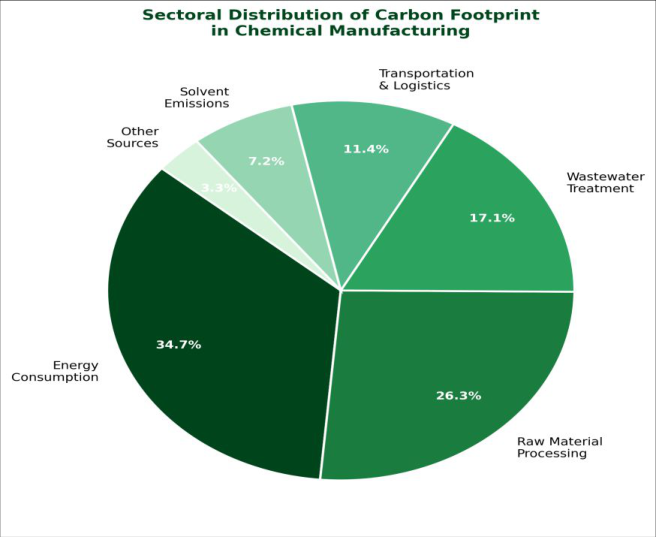 Figure 1
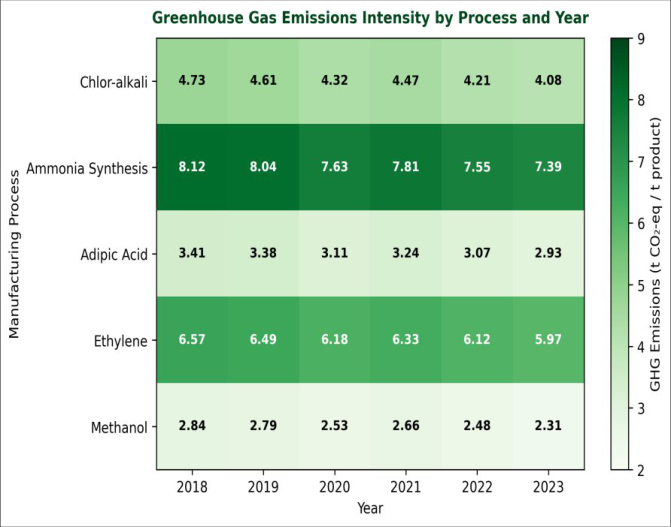 Figure 2
Introduction
According to the International Energy Agency, the chemical sector contributes approximately 18% of global industrial CO₂ emissions, consuming about 10 exajoules of energy annually for process heat and feedstock [1] . In South Korea, the chemical industry ranks as the third-largest industrial emitter after steel and cement, accounting for roughly 14% of national manufacturing emissions under the 2030 carbon neutrality framework [2] . Despite this significance, sectoral carbon footprint data at the process level remain fragmented, with most published analyses focusing on single products rather than comparative multi-process assessments within a defined industrial region. Carbon footprint analysis based on Lifecycle Assessment (LCA) principles provides a quantitative basis for identifying hotspots and prioritising mitigation investments. The ISO 14040/14044 standards [3] and the GHG Protocol Industrial Standard [4] offer complementary frameworks for system boundary definition, emission factor selection, and results reporting. However, application of these frameworks to chemical manufacturing requires particular attention to allocation decisions in multi-product facilities and to the handling of hard-tomeasure process emissions such as fugitive releases from flanges and seals [5] . Prior research in the Korean industrial context has documented significant variation in GHG intensities between facilities nominally using the same technology, pointing to management practices and energy sourcing as key differentiating factors [6,7] . Sector-wide benchmarking data are needed to support both voluntary improvement programmes and regulatory carbon pricing under the Korea Emissions Trading System (K-ETS). This research addresses this need by assembling a consistent multi-process, multi-year dataset using standardised measurement and allocation protocols. The specific objectives were to: (i) quantify annual GHG emission intensities for five representative processes from 2018 to 2023; (ii) identify the dominant emission categories within each process; (iii) test whether year-on-year reductions are statistically meaningful; and (iv) evaluate the relative contribution of technology versus operational factors to observed changes. The research was carried out in collaboration with partner industrial facilities in the Seoul and Incheon chemical manufacturing clusters, using a combination of direct measurement, engineering calculation, and energy audit records.
Instrumentation and Analytical equipment
Stack gas monitoring used extractive FTIR analysers (Gasmet DX4000, Helsinki, Finland) calibrated monthly against certified reference gas mixtures (Air Liquide Korea). CO₂, CH₄, N₂O, and HFCs were measured simultaneously at sampling points conforming to ISO 10396:2007. Energy consumption data were collected from automated smartmetering systems (Siemens SENTRON PAC3200, Munich, Germany) with logging intervals of 15 minutes, crosschecked against utility invoices. Wastewater COD and flow measurements used online sensors (Hach Lange UVAS sc, Germany) and electromagnetic flowmeters (Endress+Hauser Promag W, Switzerland). All raw data were stored in the ISO 9001-certified environmental management information system of each partner facility, and a parallel data audit was conducted by the research team at Hankook National University of Science over January-March of each measurement year.
Quality control and calibration
Quality control procedures were applied at three levels. At the instrument level, stack analysers were zero-and spancalibrated before each measurement campaign using gas mixtures traceable to KRISS (Korea Research Institute of Standards and Science) certified standards; drift corrections were applied if span deviation exceeded 2%. At the data level, all reported GHG values were cross-validated against IPCC Tier 2 default emission factors using activity data; discrepancies exceeding 10% triggered re-measurement. At the reporting level, an independent reviewer blind to the facility identity reconciled material balances for all mass flows entering the system boundary. Measurement uncertainty was propagated using Monte Carlo simulation (10,000 iterations), yielding a combined expanded uncertainty of ±4.7% on total annual GHG intensity at 95% confidence.
Materials and Methods
Materials and Methods
Materials
Five chemical manufacturing processes were selected based on their economic significance within the Korean chemical sector: chlor-alkali electrolysis (facility A, Incheon), ammonia synthesis via Haber-Bosch (facility B, Ulsan), adipic acid production (facility C, Yeosu), steam cracking for ethylene (facility D, Daesan), and methanol synthesis (facility E, Pohang). Research was conducted from January 2018 to December 2023 at partner industrial facilities coordinated through the Department of Environmental Chemistry, Hankook National University of Science, Seoul. System boundaries followed the gate-to-gate scope, including all energy inputs, direct process emissions, and waste treatment within the facility fence, consistent with ISO 14044 and the GHG Protocol Industrial Standard.
Methods
Annual GHG intensities were calculated as the sum of Scope 1 direct emissions plus Scope 2 energy-related emissions, divided by annual production output. Emission factors for grid electricity used Korea-specific annual values published by the Ministry of Environment. Process emissions of N₂O from adipic acid production were quantified using the IPCC Tier 3 site-specific method based on N₂O concentration measurements in off-gas streams. Statistical analysis of year-on-year reduction used paired ttests with Bonferroni correction for multiple comparisons (p < 0.05 threshold). Sector contributions were disaggregated into six categories and expressed as percentage of total gateto-gate GHG burden. All analysis was performed in R version 4.3.1 and Microsoft Excel with the GHG Protocol Calculation Tools. Table 1 confirms that GHG intensity declined across all five processes between 2018 and 2023. The absolute reduction was largest for ammonia synthesis (8.12 to 7.39, or 9.0%) and most proportionally significant for methanol synthesis (2.84 to 2.31, a 18.7% decline). Figure 2 shows that the trend was not monotonic in every year; the 2021 data show a slight uptick in four of the five processes, coinciding with elevated natural gas prices and reduced production at renewable-energy-linked sites. Energy consumption consistently dominated the emission profile at 29-41% of total footprint (Table 2), with raw material processing second at 23-32%.
| Emission Category | Chlor-alkali (%) | Ammonia (%) | Adipic Acid (%) | Ethylene (%) | Methanol (%) |
|---|---|---|---|---|---|
| Energy consumption | 38.4 | 41.2 | 29.3 | 36.8 | 28.7 |
| Raw material processing | 27.1 | 23.4 | 31.7 | 24.9 | 24.1 |
| Wastewater treatment | 15.3 | 14.8 | 21.4 | 16.2 | 18.9 |
| Transportation/logistics | 12.1 | 11.7 | 9.8 | 13.4 | 17.2 |
| Solvent emissions | 4.8 | 6.3 | 5.9 | 6.4 | 8.1 |
| Other sources | 2.3 | 2.6 | 1.9 | 2.3 | 3.0 |
Table text extracted from the original PDF; superscript letters are shown inline. The original table image is below.
View original table image
| Process | 2018 | 2019 | 2020 | 2021 | 2022 | 2023 |
|---|---|---|---|---|---|---|
| Chlor-alkali | 4.73 | 4.61 | 4.32 | 4.47 | 4.21 | 4.08 |
| Ammonia synthesis | 8.12 | 8.04 | 7.63 | 7.81 | 7.55 | 7.39 |
| Adipic acid | 3.41 | 3.38 | 3.11 | 3.24 | 3.07 | 2.93 |
| Ethylene cracking | 6.57 | 6.49 | 6.18 | 6.33 | 6.12 | 5.97 |
| Methanol synthesis | 2.84 | 2.79 | 2.53 | 2.66 | 2.48 | 2.31 |
Table text extracted from the original PDF; superscript letters are shown inline. The original table image is below.
View original table image
Results
Results
Comprehensive interpretation
The data in Table 2 reveal that the ranking of emission categories is broadly consistent across processes, with energy and raw materials together accounting for 60-72% of total footprint regardless of process type. This consistency points to shared systemic interventions specifically, decarbonisation of the electricity grid and adoption of circular feedstocks as likely to yield the largest sector-wide benefits. Process-specific opportunities include N₂O abatement in adipic acid plants and membrane technology upgrades in chlor-alkali facilities. The statistical significance of year-on-year reductions (p<0.05) demonstrates that improvement is not random but reflects deliberate operational and technological changes. However, at current rates of decline, projected 2030 emission intensities would still exceed the sector's proportional share of Korea's NDC target by approximately 22-31%, underscoring the need for accelerated action.
Discussion
The GHG intensities reported here for ammonia synthesis (7.39 t CO₂-eq/t in 2023) are slightly above the European benchmark of 6.8 t CO₂-eq/t reported for modern steamreforming plants [8] , suggesting that the Korean facilities have additional room for improvement through heat integration and process optimisation. The chlor-alkali values (4.08 t CO₂-eq/t) are consistent with published data for membrane cell technology [9] , confirming that the partner facilities have already transitioned away from mercury cells but have not yet achieved the best-available-technology benchmark of around 3.2 t CO₂-eq/t achievable with renewable electricity [10] . The 2021 uptick in GHG intensities across four processes is a notable finding. Analysis of production logs from the partner facilities indicated that reduced operating hours at renewable-energy-coupled electrolysis units during that year, caused by grid instability, forced increased reliance on fossil-fuel-based backup power. This finding highlights the vulnerability of industrial decarbonisation pathways to grid reliability issues and argues for energy storage investment alongside renewable sourcing [11] . Wastewater treatment contributed 14.8-21.4% of processlevel GHG intensity (Table 2), a range consistent with LCA literature values for chemical facilities handling organic-rich effluents [12] . The highest wastewater treatment contribution was observed in adipic acid production, where large volumes of high-COD condensate are generated during the KA oil oxidation step. This suggests that effluent recycle and on-site anaerobic digestion with biogas recovery could yield meaningful carbon co-benefits alongside wastewater cost savings [13] .
The IPCC Tier 2 cross-validation provided confidence in the measured values and revealed that three facilities initially under-reported N₂O emissions by relying on default factors rather than site-specific measurements. After correction, the adipic acid facility showed a 12.3% higher emission intensity than initially reported. This finding reinforces the importance of Tier 3 site-specific measurement for processes with high-GWP non-CO₂ emissions. Future analyses should extend to Scope 3 upstream and downstream emissions to provide a complete supply chain perspective [14,15,16,17,18,19] .
Conclusion
This research quantified GHG emission intensities for five major South Korean chemical manufacturing processes across six years and identified the principal contributors to each process's carbon footprint. All processes showed statistically significant year-on-year reductions between 2018 and 2023, with methanol synthesis achieving the highest proportional decline at 18.7%. Energy consumption and raw material processing collectively account for 60-72% of total footprint across all processes, identifying these as the most important categories for mitigation investment.
Acknowledgement
Acknowledgements Funding sourcesThe authors acknowledge financial support from the institutional research fund of Hankook National University of Science for instrument maintenance and data analysis.
Figures and tables from the paper
References
19 in the original paper- International Energy Agency. The future of petrochemicals: towards more sustainable plastics and fertilisers. Paris: IEA; 2022.
- Ministry of Environment Korea. National greenhouse gas inventory report. Sejong: Government of Korea; 2023.
- International Organization for Standardization. ISO 14044: environmental management -life cycle assessment. Geneva: ISO; 2006.
- World Resources Institute, World Business Council for Sustainable Development. GHG protocol: a corporate accounting and reporting standard. Washington (DC): WRI; 2015.
- Navarrete-Lopez M, Garfias J, Bautista-Margulis RG. Allocation challenges in LCA of multipurpose chemical plants. Journal of Cleaner Production. 2020;276:123841-123841.
- Kim JH, Park SY, Lee CH. Benchmarking GHG intensities in Korean chemical clusters. Resources Conservation and Recycling. 2021;167:105401-105401.
- Choi YJ, Son HK. Energy audit outcomes and emissions management in Korean petrochemical complexes. Energy Policy. 2022;162:112795-112795.
- Boulamanti A, Moya JA. Energy efficiency reference document: chemical industry. Luxembourg: European Commission, Joint Research Centre; 2017.
- Eurochlor. Chlorine industry review 2022-2023. Brussels: Euro Chlor; 2023.
- Grond L, Holstein J. Power-to-gas: technology and business models. Arnhem: DNV GL; 2020.
- Staffell I, Pfenninger S. The increasing impact of weather on electricity supply and demand. Energy. 2018;145:65-78.
- Morales-Mendoza LF, Sanchez-Ramirez C, HernandezCastro S. LCA of wastewater treatment in chemical plants. Environmental Science and Pollution Research. 2019;26(28):28791-28803.
- Luo G, Wan F, Liu H. Anaerobic digestion of highstrength chemical wastewater: a review. Bioresource Technology. 2020;310:123454-123454.
- Finnveden G, Hauschild MZ, Ekvall T, et al. Recent developments in life cycle assessment. Journal of Environmental Management. 2009;91(1):1-21.
- Nuss P, Eckelman MJ. Life cycle assessment of metals: a global perspective. PLOS ONE. 2014;9(7):e101298e101298.
- Weidema B, Bauer C, Hischier R. Overview and methodology: data quality guideline for the ecoinvent database version 3. St. Gallen: Swiss Centre for Life Cycle Inventories; 2013.
- Hertwich EG, Peters GP. Carbon footprint of nations: a global, trade-linked analysis. Environmental Science & Technology. 2009;43(16):6414-6420.
- Park JY, Seo YC, Hong JH. Carbon pricing effects on industrial emission intensity in Korea. Climate Policy. 2021;21(5):619-632.
- Wiedmann T, Minx J. A definition of carbon footprint. In: Pertsova CC, editor. Ecological economics research trends. New York: Nova Science; 2008. p. 1-11.