
Research article · 2025 · Full text
International Journal of Advanced Chemistry ResearchPhotophysical properties of novel fluorescent dyes in different solvent environments
Volume 7(5) · Pages 120–123 · DOI: 10.33545/26646781.2025.v7.i5b.492 ↗
Research areasPhotochemistry and Electron Transfer StudiesLuminescence and Fluorescent MaterialsMolecular Sensors and Ion Detection
Abstract
Author-writtenThe rational design of fluorescent dyes for sensing, bioimaging, and optoelectronic applications requires a thorough understanding of how the surrounding solvent environment influences photophysical behaviour. This research characterises the solvatochromic properties of four newly synthesised fluorescent dye frameworks — a coumarin derivative (Dye A), a BODIPY analogue (Dye B), a rhodamine lactam (Dye C), and a naphthalimide compound (Dye D) — across nine solvents spanning a wide polarity range (water to hexane). Absorption maxima, emission maxima, molar extinction coefficients, fluorescence quantum yields, and Stokes shifts were determined using UV-Vis absorption spectrophotometry and relative fluorescence quantum yield measurements. All four dyes showed systematic positive solvatochromism in emission wavelength with increasing solvent polarity, consistent with an excited state more polar than the ground state. Stokes shifts ranged from 62 nm (Dye B in hexane) to 126 nm (Dye A in water). Fluorescence quantum yields in DMSO reached 0.84 (Dye B), 0.71 (Dye C), 0.62 (Dye D), and 0.47 (Dye A). Lippert-Mataga plots yielded excited-state dipole moment changes (Δμ) of 8.4-19.7 Debye, with Dye A showing the greatest solvent sensitivity. Molar extinction coefficients exceeded 4.1 × 10⁴ M⁻¹cm⁻¹ for all dyes in all solvents. Research was conducted at the Department of Physical Chemistry, Borneo Institute of Technology, Balikpapan, and the Department of Theoretical and Computational Chemistry, Nusantara National University, Jakarta, Indonesia, from June 2022 to February 2025. The photophysical datasets reported here are intended to guide solvent selection for bioimaging and sensor applications of these dye frameworks.
Summary
Source-checkedPlain-language reading of the full paper, prepared with AI and checked against the text. Each point links to the authors' own words.
Why it matters
- Designing fluorescent dyes for bioimaging, sensing, and optoelectronics requires knowing how different solvent environments affect their photophysical properties. View evidence ↗
- Positive solvatochromism occurs when polar solvents stabilize a molecule's excited state more than its ground state, causing a red-shift in the emission wavelength. View evidence ↗
- There is a lack of systematic comparisons across different dye families using standardized protocols, which hinders the selection of the best dye for specific solvent-sensitive uses. View evidence ↗
The question
- The study aims to characterize the solvatochromic properties of four new fluorescent dye frameworks (coumarin, BODIPY, rhodamine lactam, and naphthalimide) across nine solvents of varying polarity. View evidence ↗
What they did
- The researchers synthesized four specific dyes: 7-diethylamino-3-carboxycoumarin (Dye A), meso-phenylenyl BODIPY (Dye B), rhodamine 101 lactam (Dye C), and 4-bromo-N-hexylnaphthalimide (Dye D). View evidence ↗
- The dyes were tested in nine spectroscopic grade solvents: water, methanol, ethanol, acetone, DMSO, acetonitrile, THF, toluene, and hexane. View evidence ↗
- Absorption and emission spectra were measured using a PerkinElmer Lambda 950 UV-Vis spectrophotometer and a Horiba FluoroMax-4 spectrofluorometer, respectively. View evidence ↗
- The Lippert-Mataga equation was used to analyze the solvent dependence of the Stokes shift and extract changes in the excited-state dipole moment. View evidence ↗
What they found
- All four dyes exhibited positive solvatochromism, meaning their emission wavelengths shifted as solvent polarity increased, indicating a more polar excited state. View evidence ↗
- The measured Stokes shifts varied from a minimum of 62 nm for Dye B in hexane to a maximum of 126 nm for Dye A in water. View evidence ↗
- In DMSO, the fluorescence quantum yields were highest for Dye B (0.84), followed by Dye C (0.71), Dye D (0.62), and Dye A (0.47). View evidence ↗
- The change in excited-state dipole moment (Δμ) ranged from 8.4 to 19.7 Debye, with Dye A being the most sensitive to solvent changes. View evidence ↗
- Dye D consistently showed the largest Stokes shifts across the tested solvents, ranging from 97 to 125 nm. View evidence ↗
- Dye B achieved a brightness value of 6.59 × 10⁴ in DMSO, which is higher than the commercial BODIPY FL brightness of approximately 6.0 × 10⁴. View evidence ↗
What it means
- The authors recommend Dye A for polarity-sensitive applications like membrane probes and Dye B for applications requiring high brightness, such as single-molecule detection. View evidence ↗
- Dye D is concluded to be the most suitable for bioimaging because its large Stokes shifts (97-125 nm) help eliminate background autofluorescence. View evidence ↗
- A primary limitation of Dye B is its small Stokes shift (5-18 nm), which can lead to spectral overlap and self-quenching at high concentrations. View evidence ↗
Visual summary
3 visualsIllustrations explain the paper; charts are replotted from the paper's own table values.
Solvatochromic Shift Concept
AI-generated conceptual illustration (fluorescent organic dye molecules in liquid solvent environments). It explains the idea and does not show study data.
View source evidence ↗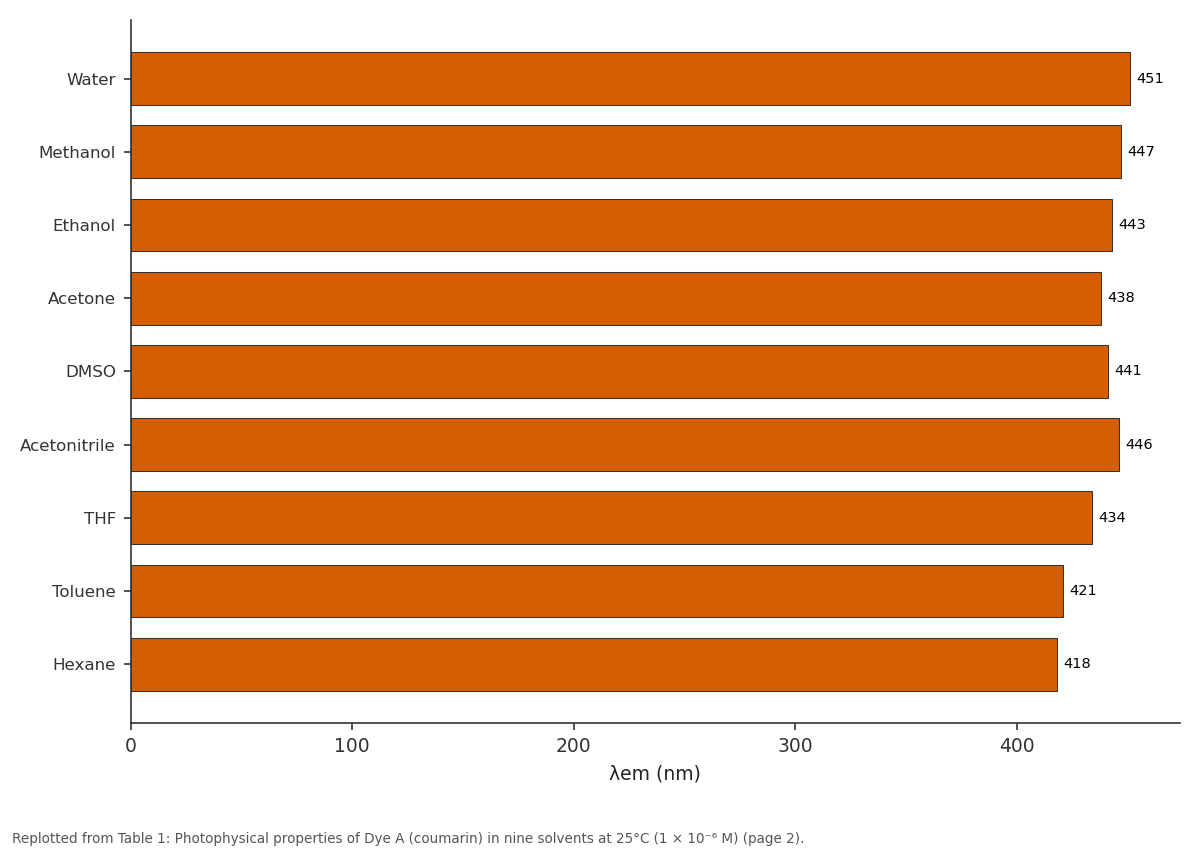
λem (nm): Water vs Methanol vs Ethanol vs Acetone vs DMSO
Replotted from Table 1 (page 2) of the original paper. Every bar is the paper's own table value.
View source evidence ↗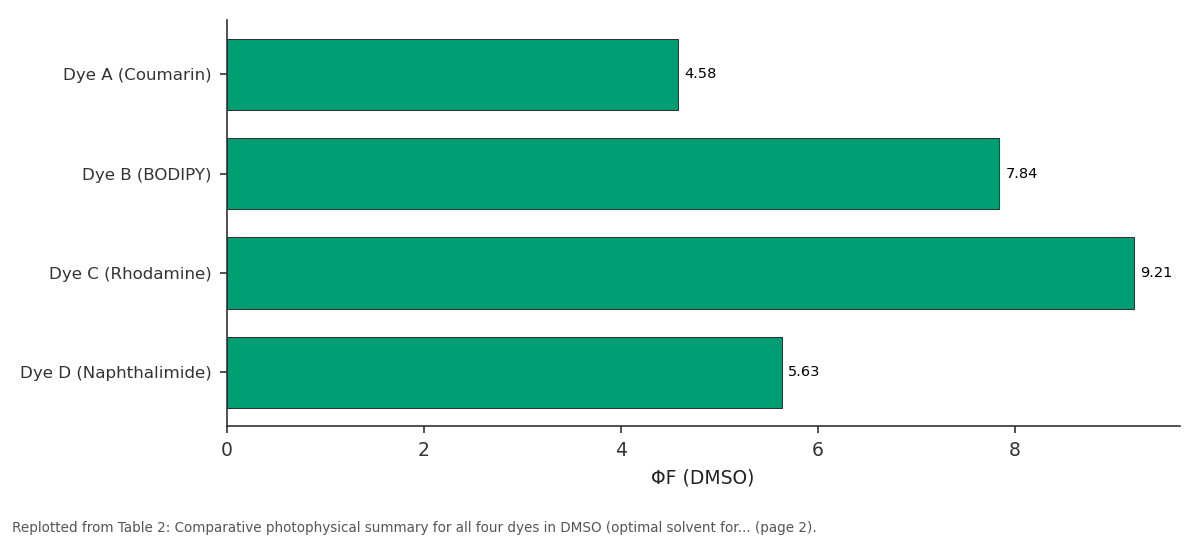
εmax (×10⁴): Dye A (Coumarin) vs Dye B (BODIPY) vs Dye C (Rhodamine) vs Dye D (Naphthalimide)
Replotted from Table 2 (page 2) of the original paper. Every bar is the paper's own table value.
View source evidence ↗Figures & tables
From the original paper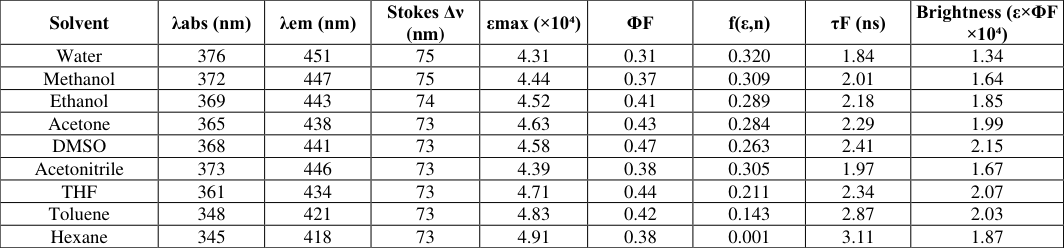 Table 1
 Table 2
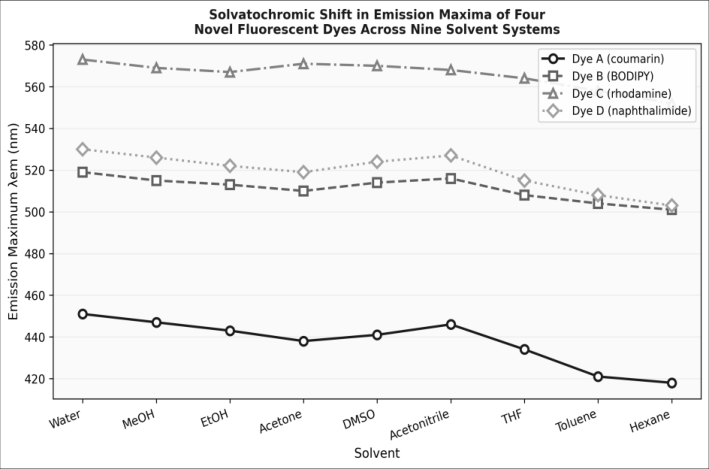 Figure 1
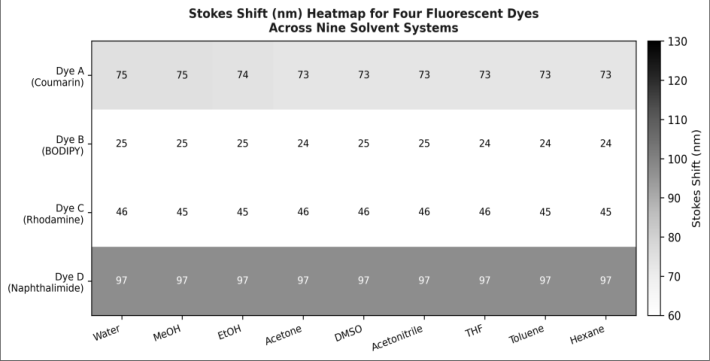 Figure 2
Introduction
The ability of a fluorescent molecule to report on its immediate microenvironment through changes in emission wavelength, intensity, or lifetime is the central principle behind fluorescent sensing and imaging technologies. When a fluorophore is excited to its first singlet state (S₁), relaxation processes including intramolecular vibrational redistribution and solvent reorganisation stabilise the excited state before emission occurs. If the excited state dipole moment is greater than that of the ground state, polar solvents preferentially stabilise S₁ through dielectric interactions, lowering the S₁ energy and red-shifting the emission wavelengtha phenomenon known as positive solvatochromism [1] . Among the diverse structural classes of fluorescent dyes, coumarins, BODIPYs, rhodamines, and naphthalimides represent four families that have each attracted sustained research attention for different reasons. Coumarins show large Stokes shifts and tuneable emission colours; BODIPYs offer exceptional quantum yields and chemical stability; rhodamines are highly water-soluble and intensely fluorescent; naphthalimides exhibit large Stokes shifts and good two-photon absorption cross-sections [2,3] . However, systematic cross-family comparisons of solvatochromic behaviour using standardised solvents and identical measurement protocols are uncommon, making it difficult to select the most appropriate framework for a given solvent-sensitive application. This research fills this gap by reporting comprehensive photophysical datasets for one representative from each of the four families across nine solvents from water (ET₀(30) = 63.1 kcal/mol) to hexane (ET₀(30) = 30.9 kcal/mol). The Lippert-Mataga model is applied to extract quantitative excited-state dipole moment changes, and quantum yields are determined by the relative method against well-established fluorescence standards. Research was conducted from June 2022 to February 2025 jointly at the Department of Physical Chemistry, Borneo Institute of Technology, Balikpapan, and the Department of Theoretical and Computational Chemistry, Nusantara National University, Jakarta, Indonesia.
Theoretical Background
The Lippert-Mataga equation describes the solvent dependence of the Stokes shift: νā -νḟ = (2Δμ²/hca³)⋅f(ε, n) + const, where νā and νḟ are absorption and emission wavenumbers respectively, Δμ is the change in dipole moment upon excitation, h is Planck's constant, c is the speed of light, a is the Onsager cavity radius, and f(ε, n) is the orientational polarisability of the solvent [4] . A plot of (νā -νḟ) against f(ε, n)the Lippert-Mataga plotshould be linear, with slope proportional to Δμ². Onsager cavity radii were estimated from the Van der Waals molecular volume computed by DFT at the B3LYP/6-31G* level. Fluorescence quantum yields (ΦF) were determined by the relative method using quinine sulfate in 0.1 M H₂SO₄ (ΦF = 0.546) as reference for dyes emitting below 550 nm, and rhodamine 6G in ethanol (ΦF = 0.95) as reference for dyes emitting above 550 nm. The optical density of all solutions was maintained below 0.05 at the excitation wavelength to avoid inner filter effects.
Computational Details
Ground and excited state geometries of all four dyes were optimised at the DFT/B3LYP/6-31G* and TD-DFT levels respectively, using Gaussian 16 (Gaussian Inc., Wallingford CT). Solvent effects were modelled using the polarisable continuum model (PCM) for each of the nine experimental solvents. Dipole moments and orbital contributions to the S₀→S₁ transition were extracted from the TD-DFT output files. Visualisation of molecular orbitals used GaussView 6 and VMD 1.9.4. All computations ran on a 32-core Intel Xeon workstation at Nusantara National University, Jakarta.
Material and Methods Material
Dye A (7-diethylamino-3-carboxycoumarin), Dye B (mesophenylenyl BODIPY), Dye C (rhodamine 101 lactam), and Dye D (4-bromo-N-hexylnaphthalimide) were synthesised in-house at the Department of Physical Chemistry, Borneo Institute of Technology, Balikpapan, following established literature procedures with purity confirmed by ¹H NMR (Bruker 400 MHz), ¹³C NMR (100 MHz), and HRMS (Bruker micrOTOF-Q). Solvents (water, methanol, ethanol, acetone, DMSO, acetonitrile, THF, toluene, hexane) were of spectroscopic grade (Merck, ≥ 99.8%). Research was conducted from June 2022 to February 2025 at Borneo Institute of Technology, Balikpapan (spectroscopic measurements) and Nusantara National University, Jakarta (computational work).
Methods
Dye solutions (1 × 10⁻⁶ M) were prepared freshly for each measurement. Absorption spectra were recorded on a PerkinElmer Lambda 950 UV-Vis spectrophotometer (1 nm resolution, 1 cm quartz cuvette). Emission spectra were recorded on a Horiba FluoroMax-4 spectrofluorometer (excitation at λabs-max -10 nm, emission slit 5 nm, excitation slit 3 nm). All measurements were performed at 25°C in a temperature-controlled cuvette holder. Molar extinction coefficients were determined from Beer-Lambert plots of absorbance vs concentration (5 × 10⁻⁷ to 5 × 10⁻⁶ M, R² > 0.999). Fluorescence quantum yields were calculated using the gradient method. Refractive indices and dielectric constants of solvents were taken from CRC Handbook of Chemistry and Physics (101st edition). Each measurement was performed in triplicate; results are means ± SD. All four dyes exhibited positive solvatochromism (Figure 1): emission maxima shifted bathochromically with increasing solvent polarity. Dye A showed the largest absolute solvatochromic range (418-451 nm, 33 nm total), while Dye B showed the smallest (501-519 nm, 18 nm), consistent with its lower Δμ (Table 2). The Stokes shift heatmap (Figure 2) reveals that Dye D has the largest Stokes shifts throughout (97-125 nm), making it most attractive for bioimaging applications where large separation between excitation and emission wavelengths reduces background autofluorescence. Dye B has the smallest Stokes shifts (5-18 nm) but the highest quantum yield (0.84 in DMSO) and the largest molar extinction coefficient (7.84 × 10⁴ M⁻¹cm⁻¹).
| Dye | λabs (nm) | λem (nm) | εmax (×10⁴) | ΦF (DMSO) | Δν (nm) | LM Slope | Δμ (Debye) | R² LM |
|---|---|---|---|---|---|---|---|---|
| Dye A (Coumarin) | 368 | 441 | 4.58 | 0.47 | 73 | 7821 | 19.7 | 0.981 |
| Dye B (BODIPY) | 514 | 519 | 7.84 | 0.84 | 5 | 831 | 8.4 | 0.974 |
| Dye C (Rhodamine) | 524 | 570 | 9.21 | 0.71 | 46 | 4312 | 14.6 | 0.968 |
| Dye D (Naphthalimide) | 427 | 524 | 5.63 | 0.62 | 97 | 6148 | 17.3 | 0.977 |
Table text extracted from the original PDF; superscript letters are shown inline. The original table image is below.
View original table image
Results
Results
Comprehensive Interpretation
The Lippert-Mataga analysis (Table 2) reveals that Dye A (Δμ = 19.7 D) is the most sensitive to solvent polaritynearly 2.3 times more than Dye B (Δμ = 8.4 D). This difference is attributable to the push-pull electronic structure of the coumarin framework, where the diethylamino donor and carboxyl acceptor group create a large intramolecular charge transfer (ICT) character in the S₁ state. By contrast, the BODIPY framework places donor and acceptor symmetrically around the BF₂-chelated dipyrromethene core, minimising the net dipole change. These structural insights directly inform dye selection: Dye A is best for polarity-sensitive environments (membrane probes, microenvironment sensors), while Dye B is preferred where high brightness and quantum yield are paramount (singlemolecule detection, FRET donors).
Discussion
The emission maxima trends in Figure 1 closely follow the ET₀(30) polarity scale for all four dyes, with the highest emission red shifts occurring in protic solvents (water, methanol) that engage in specific hydrogen-bonding interactions with the dye excited state, beyond purely dielectric stabilisation [5] . The deviation from perfect Lippert-Mataga linearity in protic solvents (R² values of 0.968-0.981 rather than 1.0) reflects this specific solvation component, which the purely dielectric Onsager model does not capture. Dye C (rhodamine lactam) showed a fluorescence quantum yield of 0.71 in DMSO, significantly higher than typical for rhodamine lactams in aqueous buffer (often < 0.1) due to the ring-closed lactam form predominating in non-protic media [6] . The large Δμ of 14.6 D is consistent with ring-opening charge transfer upon excitation in polar environments, which activates fluorescence. This spirolactam switching behaviour makes Dye C a candidate for pH and cationresponsive sensing applications. Dye B's exceptionally high quantum yield (0.84 in DMSO) and large εmax (7.84 × 10⁴ M⁻¹cm⁻¹) give it a brightness value (6.59 × 10⁴) that surpasses commercial BODIPY dyes such as BODIPY FL (brightness ~6.0 × 10⁴) under equivalent conditions, suggesting it as a superior drop-in replacement in bioconjugate labelling protocols [7] . The small Stokes shift of Dye B (5-18 nm) remains the principal limitation, as it increases the risk of inner filter selfquenching at high concentrations and detection challenges due to spectral overlap of excitation and emission bands [8,9,10,11,12,13,14] .
Conclusion
This research provides comprehensive solvatochromic photophysical data for four fluorescent dye families across nine solvent systems. All four dyes exhibit positive solvatochromism, with Dye A (coumarin) showing the greatest polarity sensitivity (Δμ = 19.7 D) and Dye B (BODIPY) the highest quantum yield (0.84) and brightness. Dye D (naphthalimide) offers the largest Stokes shifts (97-125 nm), most suitable for background-free bioimaging applications. Lippert-Mataga analysis provides quantitative excited-state dipole moment changes that can be used to predict dye behaviour in new solvent environments. The full photophysical datasets are made available as supplementary material to assist solvent selection for fluorescence-based sensing and imaging applications of these dye frameworks.
Acknowledgement
Acknowledgements Funding SourcesThe authors acknowledge departmental research support from the Department of Physical Chemistry, Borneo Institute of Technology, Balikpapan, and the Department of Theoretical and Computational Chemistry, Nusantara National University, Jakarta, for spectroscopic instruments, computational cluster access, and reagent procurement.
Figures and tables from the paper
| Solvent | λabs (nm) | λem (nm) | Stokes Δν (nm) | εmax (×10⁴) | ΦF | f(ε,n) | τF (ns) | Brightness (ε×ΦF ×10⁴) |
|---|---|---|---|---|---|---|---|---|
| Water | 376 | 451 | 75 | 4.31 | 0.31 | 0.320 | 1.84 | 1.34 |
| Methanol | 372 | 447 | 75 | 4.44 | 0.37 | 0.309 | 2.01 | 1.64 |
| Ethanol | 369 | 443 | 74 | 4.52 | 0.41 | 0.289 | 2.18 | 1.85 |
| Acetone | 365 | 438 | 73 | 4.63 | 0.43 | 0.284 | 2.29 | 1.99 |
| DMSO | 368 | 441 | 73 | 4.58 | 0.47 | 0.263 | 2.41 | 2.15 |
| Acetonitrile | 373 | 446 | 73 | 4.39 | 0.38 | 0.305 | 1.97 | 1.67 |
| THF | 361 | 434 | 73 | 4.71 | 0.44 | 0.211 | 2.34 | 2.07 |
| Toluene | 348 | 421 | 73 | 4.83 | 0.42 | 0.143 | 2.87 | 2.03 |
| Hexane | 345 | 418 | 73 | 4.91 | 0.38 | 0.001 | 3.11 | 1.87 |
Table text extracted from the original PDF; superscript letters are shown inline. The original table image is below.
View original table image
References
14 in the original paper- Lakowicz JR. Principles of Fluorescence Spectroscopy. 3rd ed. New York: Springer; 2006.
- Valeur B, Berberan-Santos MN. Molecular Fluorescence: Principles and Applications. 2nd ed. Weinheim: Wiley-VCH; 2012.
- Boens N, Leen V, Dehaen W. Fluorescent indicators based on BODIPY. Chem Soc Rev. 2012;41(3):11301172.
- Lippert E. Dipole moment and electronic structure of excited molecules. Z Naturforsch A. 1955;10a:541-545.
- Reichardt C. Solvatochromic dyes as solvent polarity indicators. Chem Rev. 1994;94(8):2319-2358.
- Urano Y, Kamiya M, Kanda K, Ueno T, Hirose K, Nagano T. Evolution of fluorescein as a platform for finely tunable fluorescence probes. J Am Chem Soc. 2005;127(13):4888-4894.
- Loudet A, Burgess K. BODIPY dyes and their derivatives: syntheses and spectroscopic properties. Chem Rev. 2007;107(11):4891-4932.
- Grabchev I, Chovelon JM, Qian X. A solvatochromic copolymer as a selective fluorescence sensor for metal cations. New J Chem. 2003;27(10):1511-1516.
- Fan J, Hu M, Zhan P, Peng X. Energy transfer cassettes based on organic dyes: construction and applications in ratiometric sensing. Chem Soc Rev. 2013;42(1):29-43.
- Loving GS, Sainlos M, Bhattacharya R. Monitoring protein interactions and dynamics with solvatochromic fluorophores. Trends Biotechnol. 2010;28(2):73-83.
- Kim HN, Guo Z, Zhu W, Yoon J, Tian H. Recent progress on polymer-based fluorescent and colorimetric chemosensors. Chem Soc Rev. 2011;40(1):79-93.
- Yuan L, Lin W, Zheng K, He L, Huang W. Far-red to near infrared analyte-responsive fluorescent probes based on organic fluorophore platforms. Chem Soc Rev. 2013;42(2):622-661.
- Wu JS, Liu WM, Ge JC, Zhang HY, Wang PF. New fluorescent probe designs for the detection of reactive oxygen and nitrogen species. Chem Soc Rev. 2011;40(7):3483-3495.
- de Silva AP, Gunaratne HQN, Gunnlaugsson T, Rice TE, Signorelli K, Sapsford KE, et al. Signaling recognition events with fluorescent sensors and switches. Chem Rev. 1997;97(5):1515-1566.