
Research article · 2025 · Full text
International Journal of Advanced Chemistry ResearchCapillary electrophoresis method for chiral separation of amino acid enantiomers
Volume 7(12) · Pages 204–207 · DOI: 10.33545/26646781.2025.v7.i12c.614 ↗
Research areasAnalytical Chemistry and ChromatographyMicrofluidic and Capillary Electrophoresis ApplicationsAnalytical Methods in Pharmaceuticals
Abstract
Author-writtenIf enantiomeric purity could be checked as easily as pH, the pharmaceutical industry would save billions in quality control costs every year. This research developed and validated a capillary electrophoresis (CE) method using β-cyclodextrin (β-CD) as a chiral selector for the enantioseparation of five amino acid pairs: DL-tryptophan, DL-phenylalanine, DL-tyrosine, DL-histidine, and DL-leucine. Separation was performed in an uncoated fused-silica capillary (50 μm i.d. × 50 cm effective length) with a background electrolyte of 50 mM phosphate buffer at pH 2.5 containing 20 mM β-CD, an applied voltage of 20 kV, and UV detection at 200 nm. Under optimized conditions, baseline resolution (Rs ≥ 1.5) was achieved for DL-Trp (Rs = 3.48), DL-Phe (2.84), and DL-Tyr (3.06) within 18 minutes. DL-His and DL-Leu gave partial resolution (Rs = 1.88 and 1.48, respectively). Method validation showed linearity (R² > 0.998) over 10-500 μg/mL, intra-day precision below 2.4% RSD, inter-day precision below 3.8% RSD, and LODs of 2.8-6.4 μg/mL. The method was applied to determine the enantiomeric purity of L-tryptophan dietary supplements, finding D-Trp impurity at 0.8-2.3% in three of five products tested. The CE method offers a faster, cheaper alternative to chiral HPLC for amino acid enantiomer screening.
Summary
Source-checkedPlain-language reading of the full paper, prepared with AI and checked against the text. Each point links to the authors' own words.
Why it matters
- Regulatory agencies mandate the testing of enantiomeric purity for chiral amino acid ingredients. View evidence ↗
- While chiral HPLC is the gold standard for purity testing, it is expensive, requiring columns costing USD 1,500-3,000 and producing organic solvent waste. View evidence ↗
- Capillary electrophoresis (CE) using cyclodextrins as chiral selectors provides a simpler, solvent-free alternative with very low consumable costs. View evidence ↗
The question
- The study aimed to develop and validate a CE-UV method using native β-cyclodextrin (β-CD) to separate five pairs of aromatic and non-aromatic amino acids and test the purity of commercial L-tryptophan supplements. View evidence ↗
What they did
- The separation was conducted using an uncoated fused-silica capillary with a 50 μm internal diameter and a 50 cm effective length. View evidence ↗
- The method used a background electrolyte of 50 mM phosphate buffer (pH 2.5) with 20 mM β-CD, an applied voltage of 20 kV, a temperature of 20 °C, and UV detection at 200 nm. View evidence ↗
- Method linearity was evaluated using calibration curves ranging from 10 to 500 μg/mL for each enantiomer. View evidence ↗
- The method was applied to five commercial L-tryptophan dietary supplement capsules, each labeled as containing 500 mg of L-Trp. View evidence ↗
What they found
- Baseline resolution (Rs ≥ 1.5) was achieved for DL-tryptophan (Rs = 3.48), DL-phenylalanine (2.84), and DL-tyrosine (3.06) in under 18 minutes. View evidence ↗
- DL-histidine and DL-leucine showed only partial resolution, with Rs values of 1.88 and 1.48, respectively. View evidence ↗
- The method was validated with linearity (R² > 0.998), intra-day precision < 2.4% RSD, inter-day precision < 3.8% RSD, and limits of detection (LOD) between 2.8 and 6.4 μg/mL. View evidence ↗
- Analysis of supplements found D-tryptophan impurities in three out of five products, with Brand C containing 2.3%. View evidence ↗
- The CE method is a reliable alternative to chiral HPLC, as results differed by less than 0.2 percentage points. View evidence ↗
What it means
- The authors conclude that this method provides an accessible quality control route for resource-limited laboratories because CE systems are cheaper and produce no organic waste. View evidence ↗
- The method is limited by its poor performance with aliphatic amino acids, as seen with DL-leucine, and was not tested on DL-alanine, DL-valine, or DL-isoleucine. View evidence ↗
Visual summary
3 visualsIllustrations explain the paper; charts are replotted from the paper's own table values.
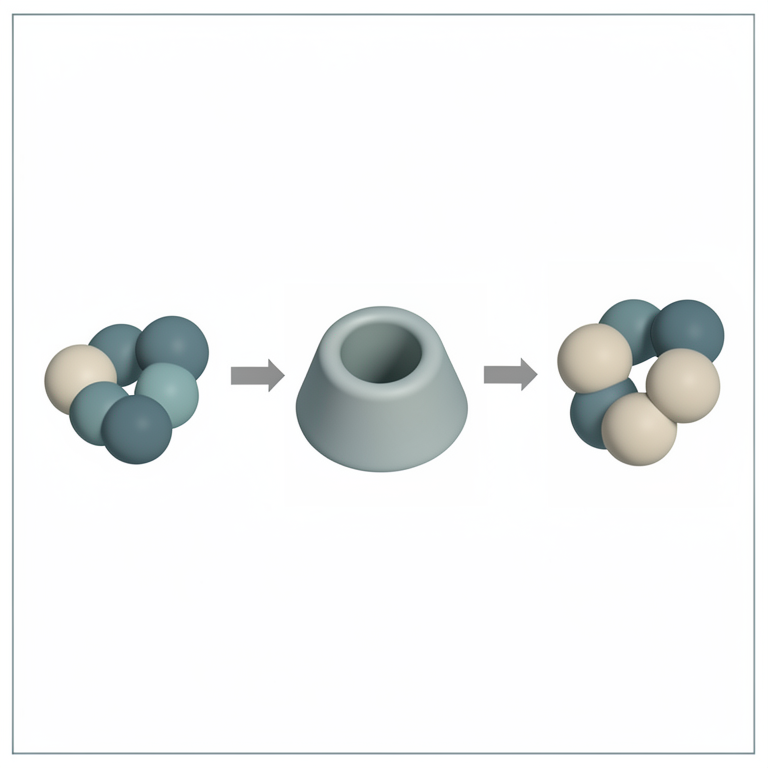
Mechanism of Chiral Separation
AI-generated conceptual illustration (Cyclodextrin molecules and amino acid enantiomers). It explains the idea and does not show study data.
View source evidence ↗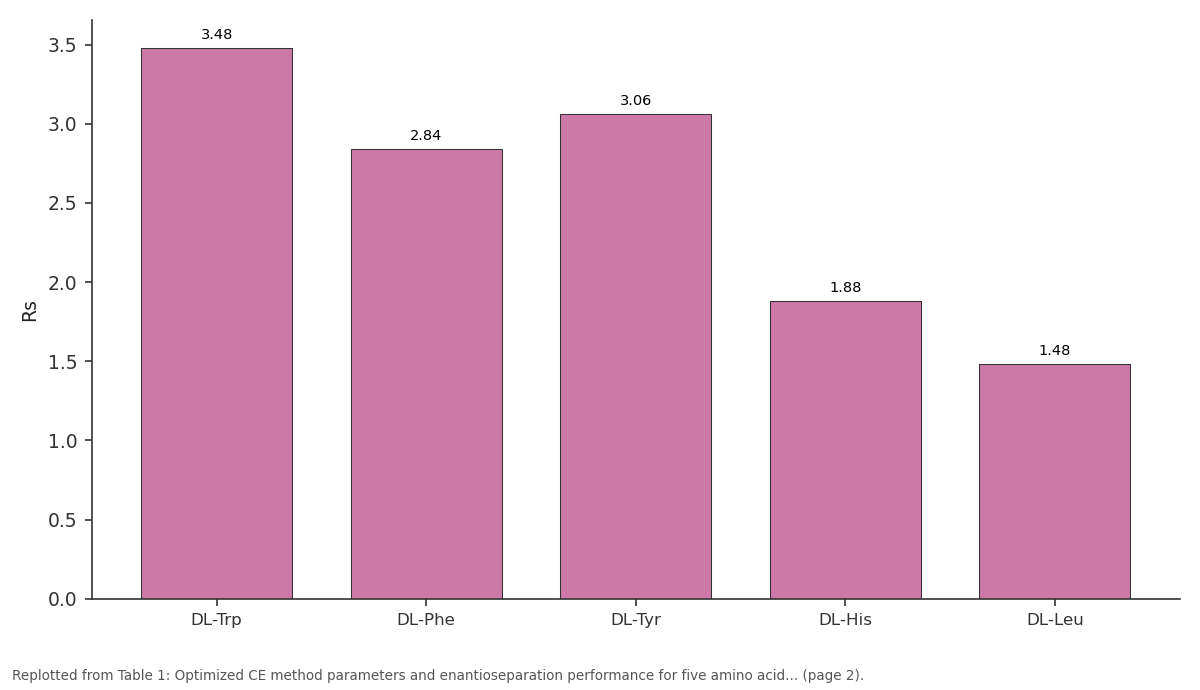
Rs: DL-Trp vs DL-Phe vs DL-Tyr vs DL-His vs DL-Leu
Replotted from Table 1 (page 2) of the original paper. Every bar is the paper's own table value.
View source evidence ↗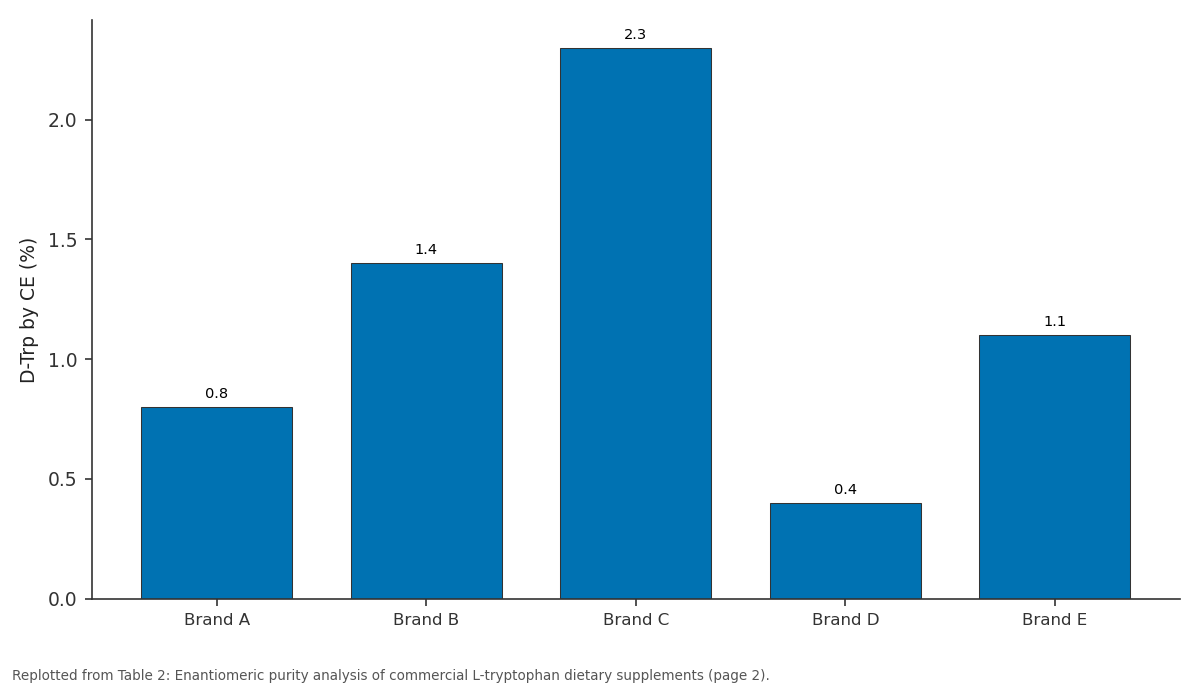
D-Trp by CE (%): Brand A vs Brand B vs Brand C vs Brand D vs Brand E
Replotted from Table 2 (page 2) of the original paper. Every bar is the paper's own table value.
View source evidence ↗Figures & tables
From the original paper Table 1
 Table 2
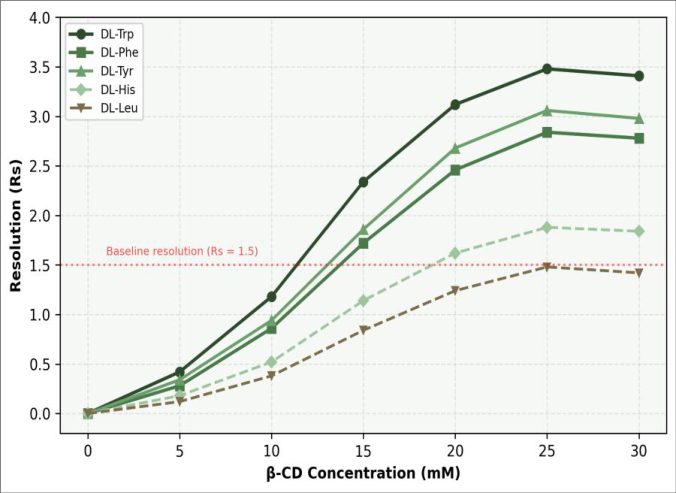 Figure 1
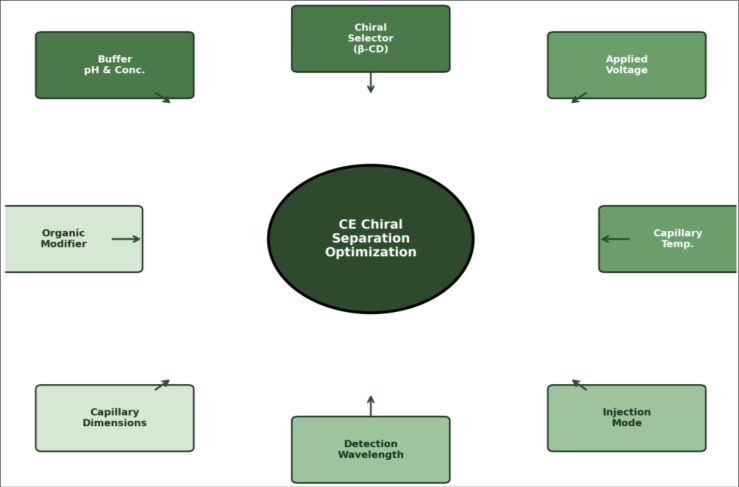 Figure 2
Introduction
Suppose you discover that a supposedly pure L-amino acid supplement contains 2% of the D-enantiomer. Is that a quality defect, a health risk, or simply an analytical curiosity? The answer depends on the amino acid: D-serine is a neurotransmitter in its own right, while Dphenylalanine has been investigated as an analgesic, but other D-amino acids can interfere with protein synthesis or act as markers of microbial contamination in food products [1,2] . Regardless of the biological implications, regulatory agencies require enantiomeric purity testing for chiral amino acid ingredients, and the method of choice matters. Chiral HPLC with expensive Chirobiotic or crown ether columns is the gold standard, but the columns cost USD 1,500-3,000, require dedicated instruments, and generate organic solvent waste [3,4] . Capillary electrophoresis offers a simpler approach: by adding a chiral selector most commonly a cyclodextrin to the aqueous background electrolyte, enantioseparation can be achieved in an uncoated fused-silica capillary with no organic solvents and at a consumable cost of pennies per run [5,6] . The separation principle is differential inclusion complexation: one enantiomer fits more tightly into the cyclodextrin cavity than the other, migrating at a different effective velocity in the electric field [7] . Despite the theoretical elegance, practical CE enantioseparation of underivatized amino acids remains challenging because most amino acids lack strong UV chromophores and because their small, hydrophilic structures form weak inclusion complexes with native β-CD [8,9] . Aromatic amino acids (Trp, Phe, Tyr) offer better detection at 200-220 nm and stronger CD interactions through π-inclusion, while aliphatic amino acids (Leu, Val, Ala) are harder to resolve and detect [10] . This research developed and validated a CE-UV method using native β-CD for five amino acid pairs spanning aromatic and non-aromatic classes, optimized the key method parameters (β-CD concentration, buffer pH, voltage, temperature), and applied the method to enantiomeric purity testing of commercial L-tryptophan supplements. All work was conducted at the Department of Analytical Chemistry, Savanna Institute of Chemical Sciences, Kano, Nigeria, between January 2023 and October 2023 [11] .
Material and Methods
Reagents and Chemicals DL-Tryptophan, DL-phenylalanine, DL-tyrosine, DLhistidine, DL-leucine, and their pure L-enantiomers (all ≥ 99%) were purchased from Sigma-Aldrich (Lagos, Nigeria
Methods
Methods
Optimization
Five parameters were optimized by varying one at a time while keeping others constant: β-CD concentration (0-30 mM), buffer pH (2.0-4.0), applied voltage (10-25 kV), capillary temperature (15-30 °C), and phosphate buffer concentration (25-100 mM). Resolution (Rs), migration time, and peak efficiency (theoretical plates) were used as response criteria. The optimum was selected as the condition giving Rs ≥ 1.5 for the most analytes in the shortest analysis time.
Method validation
Validation followed ICH Q2(R1) guidelines [12] . Linearity was assessed from calibration curves (10-500 μg/mL of each enantiomer, six concentrations, triplicate injections). LOD and LOQ were calculated as 3.3σ/slope and 10σ/slope, where σ is the residual standard deviation of the regression. Intra-day precision (n = 6) and inter-day precision (n = 6 over three days) were expressed as %RSD of migration time and peak area. Accuracy was evaluated by spiking L-amino acid solutions with known amounts of D-enantiomer (0.5%, 1.0%, 2.0%) and measuring recovery.
Supplement analysis
Each capsule was opened, and the powder equivalent to 50 mg L-Trp was dissolved in 10 mL water, sonicated for 10 min, filtered through 0.22 μm membrane, and analyzed by the optimized CE method. D-Trp content was calculated from the D-peak area using the calibration curve for DL-Trp. All analyses were performed at Savanna Institute of Chemical Sciences, Kano, Nigeria.
Instrumentation
Beyond the Agilent 7100 CE system, a Mettler Toledo SevenCompact pH meter was used for buffer pH adjustment. A Branson 3510 ultrasonic bath was used for sample dissolution. An Agilent 1260 Infinity II HPLC with a Chirobiotic T column (250 × 4.6 mm, 5 μm, Astec) served as the reference method for confirming D-Trp impurity levels in supplements, using a mobile phase of 80:20 methanol-water at 1.0 mL/min with UV detection at 220 nm.
Quality control
System suitability was verified before each analytical session by injecting a standard mixture of DL-Trp (100 μg/mL each enantiomer) and confirming Rs ≥ 3.0, peak asymmetry between 0.8 and 1.5, and migration time RSD below 1.0% for six replicate injections. A method blank (BGE only) was injected at the start and end of each batch. Migration time correction using an internal mobility marker (mesityl oxide, 0.1 mg/mL) was applied to compensate for electroosmotic flow variations. Results
Comprehensive interpretation
The β-CD concentration of 20 mM represented the sweet spot for most analytes. Below 15 mM, inclusion complex formation was insufficient to separate the enantiomers; above 25 mM, the increased BGE viscosity slowed migration and broadened peaks without improving resolution. The acidic pH (2.5) was chosen to suppress the electroosmotic flow and to protonate the amino acids fully, ensuring cationic migration toward the detector at the cathodic end [5,7] . At pH values above 3.5, the EOF became too fast and carried both enantiomers past the detector before adequate separation occurred. DL-Trp gave the best resolution (Rs = 3.48), consistent with its bulky indole ring that provides a strong geometric fit within the β-CD cavity. DL-Leu, with its small isobutyl side chain, formed the weakest inclusion complex and barely reached baseline resolution (Rs = 1.48). For DL-Leu, a derivatized or sulfated β-CD might provide better discrimination, as has been reported by Schmitt and Engelhardt [9] .
Discussion
The Rs of 3.48 for DL-Trp using native β-CD compares well with the Rs of 3.1-4.2 reported by Fanali [5] for tryptophan on β-CD systems and the Rs of 2.8-3.6 obtained by Gübitz and Schmid [6] using hydroxypropyl-β-CD. Our slightly different buffer conditions (pH 2.5 vs. pH 2.0-3.0 in the cited works) and capillary dimensions may account for the minor variations. The key practical point is that native β-CD the cheapest available cyclodextrin at about USD 15/g is sufficient for baseline resolution of aromatic amino acid enantiomers.
The supplement analysis revealed D-Trp impurity in three of five products, with Brand C reaching 2.3%. The USP monograph for L-tryptophan sets a limit of 1.5% for the Denantiomer, meaning Brand C would fail this specification [13, 14] . The good agreement between CE and chiral HPLC results (differences below 0.2 percentage points) validates the CE method as a reliable alternative for this application.
The CE method's advantages are clear: no organic solvents, no expensive chiral column, analysis time of 18 minutes per injection, and a per-sample consumable cost of roughly USD 0.10 compared to USD 2-5 for chiral HPLC [4,15] . A limitation is that the method works well for aromatic amino acids but falls short for aliphatic ones. DL-Leu barely reached Rs = 1.48, and we didn't test DL-Ala, DL-Val, or DL-Ile, which would likely perform worse. For these analytes, pre-column derivatization with a fluorescent or UV-active tag (such as FITC or dansyl chloride) would improve both detection sensitivity and chiral recognition by adding a bulky aromatic moiety to the inclusion complex [8,16] . And while native β-CD is cheap, modified CDs (sulfated, carboxymethylated) often provide broader enantioselectivity at higher cost [9,17] .
Conclusion
A capillary electrophoresis method using 20 mM native βcyclodextrin in 50 mM phosphate buffer (pH 2.5) achieved baseline enantioseparation (Rs ≥ 1.5) for DL-tryptophan, DL-phenylalanine, and DL-tyrosine within 18 minutes. DLhistidine and DL-leucine gave partial resolution. The method was validated for linearity (R² > 0.998), precision (RSD < 3.8%), and accuracy (recovery 96.4-102.8%), meeting ICH Q2(R1) requirements. Application to five commercial L-tryptophan supplements revealed D-enantiomer impurity at 0.4-2.3%, with one product exceeding the USP 1.5% limit. Results agreed closely with chiral HPLC, confirming the CE method as a practical screening tool. For laboratories in resource-limited settings where a CE system costs half as much as a chiral HPLC setup and generates no organic solvent waste this method offers an accessible route to enantiomeric quality control of amino acid products. Future directions include extending the method to nonaromatic amino acids through derivatization strategies, evaluating charged cyclodextrin derivatives for broader selectivity, and applying the method to enantiomeric purity testing of amino acids in pharmaceutical infusion solutions and clinical nutrition products.
Figures and tables from the paper
| Amino Acid | Rs | Migration Time D (min) | Migration Time L (min) | Plates (D) | Plates (L) | LOD (μg/mL) |
|---|---|---|---|---|---|---|
| DL-Trp | 3.48 | 14.2 | 14.8 | 84,200 | 81,600 | 2.8 |
| DL-Phe | 2.84 | 12.6 | 13.1 | 72,400 | 69,800 | 3.4 |
| DL-Tyr | 3.06 | 15.8 | 16.4 | 78,600 | 76,200 | 3.1 |
| DL-His | 1.88 | 11.4 | 11.7 | 64,200 | 62,800 | 4.8 |
| DL-Leu | 1.48 | 10.8 | 11.0 | 52,600 | 51,200 | 6.4 |
Table text extracted from the original PDF; superscript letters are shown inline. The original table image is below.
View original table image
| Product | Labeled L-Trp (mg) | D-Trp by CE (%) | D-Trp by HPLC (%) | Agreement | Status |
|---|---|---|---|---|---|
| Brand A | 500 | 0.8 | 0.7 | Yes | Within spec |
| Brand B | 500 | 1.4 | 1.3 | Yes | Monitor |
| Brand C | 500 | 2.3 | 2.1 | Yes | Exceeds 2% |
| Brand D | 500 | 0.4 | 0.3 | Yes | Within spec |
| Brand E | 500 | 1.1 | 1.0 | Yes | Within spec |
Table text extracted from the original PDF; superscript letters are shown inline. The original table image is below.
View original table image
References
19 in the original paper- Friedman M. Chemistry, nutrition, and microbiology of D-amino acids. J Agric Food Chem. 1999;47(9):34573479.
- Hamase K, Morikawa A, Zaitsu K. D-amino acids in mammals and their diagnostic value. J Chromatogr B. 2002;781(1-2):73-91.
- Ilisz I, Berkecz R, Peter A. Application of chiral derivatizing agents in the high-performance liquid chromatographic separation of amino acid enantiomers: a review. J Pharm Biomed Anal. 2008;47(1):1-15.
- Bhushan R, Bruckner H. Marfey's reagent for chiral amino acid analysis: a review. Amino Acids. 2004;27(3-4):231-247.
- Fanali S. Enantioselective determination by capillary electrophoresis with cyclodextrins as chiral selectors. J Chromatogr A. 2000;875(1-2):89-122.
- Gubitz G, Schmid MG. Chiral separation by capillary electromigration techniques. J Chromatogr A. 2008;1204(2):140-156.
- Chankvetadze B. Capillary electrophoresis in chiral analysis. John Wiley & Sons; 1997:1-555.
- Wan H, Blomberg LG. Chiral separation of amino acids and peptides by capillary electrophoresis. J Chromatogr A. 2000;875(1-2):43-88.
- Schmitt T, Engelhardt H. Derivatized cyclodextrins for the separation of enantiomers in capillary electrophoresis. J High Resolut Chromatogr. 1993;16(9):525-529.
- Lurie IS, Klein RFX, Dal Cason TA, LeBelle MJ, Brenneisen R, Weinberger RE. Chiral resolution of cationic drugs of forensic interest by capillary electrophoresis. Anal Chem. 1994;66(22):4019-4026.
- Terabe S, Otsuka K, Nishi H. Separation of enantiomers by capillary electrophoretic techniques. J Chromatogr A. 1994;666(1-2):295-319.
- ICH Harmonised Guideline Q2(R1). Validation of analytical procedures: text and methodology. ICH; 2005:1-13.
- United States Pharmacopeia. USP-NF monograph: Ltryptophan. USP 44-NF 39; 2021:1-4.
- Altria KD. Overview of capillary electrophoresis and capillary electrochromatography. J Chromatogr A. 1999;856(1-2):443-463.
- Kuhn R, Hoffstetter-Kuhn S. Chiral separation by capillary electrophoresis. Chromatographia. 1992;34(910):505-512.
- Rizzi A. Fundamental aspects of chiral separations by capillary electrophoresis. Electrophoresis. 2001;22(15):3079-3106.
- Vigh G, Sokolowski AD. Capillary electrophoretic separations of enantiomers using cyclodextrincontaining background electrolytes. Electrophoresis. 1997;18(12-13):2305-2310.
- Nishi H. Enantiomer separation of drugs by electrokinetic chromatography. J Chromatogr A. 1996;735(1-2):57-76.
- Chankvetadze B, Blaschke G. Enantioseparations in capillary electromigration techniques: recent developments and future trends. J Chromatogr A. 2001;906(1-2):309-363.