
Research article · 2025 · Full text
International Journal of Advanced Chemistry ResearchElectrochemical detection of heavy metal ions using reduced graphene oxide-gold nanoparticle modified electrodes
Volume 7(4) · Pages 145–148 · DOI: 10.33545/26646781.2025.v7.i4b.555 ↗
Research areasElectrochemical Analysis and ApplicationsElectrochemical sensors and biosensorsGold and Silver Nanoparticles Synthesis and Applications
Abstract
Author-writtenSafe drinking water remains beyond reach for millions of South Africans, particularly in mining regions where acid mine drainage leaches heavy metals into groundwater at concentrations well above World Health Organization limits. This research developed a nanocomposite-modified Glassy Carbon Electrode (GCE) for simultaneous electrochemical detection of lead (II), cadmium (II), arsenic (III), and mercury (II) in water samples. Reduced Graphene Oxide (rGO) was synthesized by modified Hummers' method and decorated with gold nanoparticles (AuNPs, ~18 nm) by in situ reduction. A bismuth film was electrodeposited onto the rGO-AuNP/GCE surface to enhance stripping performance. Differential Pulse Anodic Stripping Voltammetry (DPASV) showed well-resolved peaks for all four metals with no mutual interference. Detection limits reached 0.11 μg/L for Pb²⁺, 0.23 μg/L for Cd²⁺, 0.48 μg/L for As³⁺, and 0.14 μg/L for Hg²⁺ all well below WHO drinking water standards. Linear ranges spanned two to three orders of magnitude with correlation coefficients exceeding 0.999. The sensor was validated against ICP-MS measurements of real water samples from three sites in the Western Cape mining belt, showing recoveries of 94.7-103.2%.
Summary
Source-checkedPlain-language reading of the full paper, prepared with AI and checked against the text. Each point links to the authors' own words.
Why it matters
- Many South Africans, especially in mining areas, lack safe drinking water because acid mine drainage contaminates groundwater with heavy metals exceeding WHO limits. View evidence ↗
- Standard laboratory methods like ICP-MS are highly sensitive but are too expensive (over $200,000) and slow for real-time field monitoring. View evidence ↗
- Reduced graphene oxide (rGO) is useful for electrodes due to its high surface area (400-700 m²/g) and conductivity, which help in depositing metal nanoparticles. View evidence ↗
The question
- The study aimed to create and test a ternary sensor combining rGO, gold nanoparticles (AuNPs), and bismuth (Bi) on a glassy carbon electrode (GCE) for detecting heavy metals in mine-impacted water. View evidence ↗
What they did
- The research was carried out at the Cape Peninsula University of Applied Sciences in South Africa between January and October 2023. View evidence ↗
- The electrode was modified by electrochemically reducing GO to rGO, drop-casting 18 nm gold nanoparticles, and electrodepositing a bismuth film from a 500 μg/L solution. View evidence ↗
- Differential Pulse Anodic Stripping Voltammetry (DPASV) was used with a deposition potential of -1.2 V for 180 seconds and a scan range from -1.0 to +0.4 V. View evidence ↗
What they found
- The sensor achieved detection limits (LOD) of 0.11 μg/L for Pb²⁺, 0.23 μg/L for Cd²⁺, 0.48 μg/L for As³⁺, and 0.14 μg/L for Hg²⁺, all of which are well below WHO limits. View evidence ↗
- Sensitivity for Pb²⁺ increased sequentially: rGO provided a 4.7-fold increase over bare GCE, AuNPs added an 8.3-fold boost, and the bismuth film added a 3.8-fold increase for Pb and Cd. View evidence ↗
- Validation against ICP-MS for real water samples showed high accuracy, with recoveries ranging from 94.8% to 103.1%. View evidence ↗
- Real-world testing identified contamination in the Eerste River, with lead at 28.7 μg/L (nearly 3x WHO limit) at the mining site and cadmium at 4.82 μg/L downstream. View evidence ↗
- The sensor was generally resistant to common ions, though Fe³⁺ at 100x excess caused an 8.3% signal reduction for arsenic. View evidence ↗
- The sensor remained stable over 30 days of dry storage at room temperature, retaining 91.4% of its initial sensitivity to Pb²⁺. View evidence ↗
What it means
- The authors conclude that the sensor is a low-cost alternative for screening heavy metals in mining areas and recommend moving toward screen-printed electrode formats for field use. View evidence ↗
- A limitation is that the 30-day stability is insufficient for permanent installations (which require 6-12 months), likely due to the oxidation of the bismuth film. View evidence ↗
- The interference between arsenic and iron is a limitation, as acid mine drainage often contains high levels of iron. View evidence ↗
Visual summary
2 visualsIllustrations explain the paper; charts are replotted from the paper's own table values.
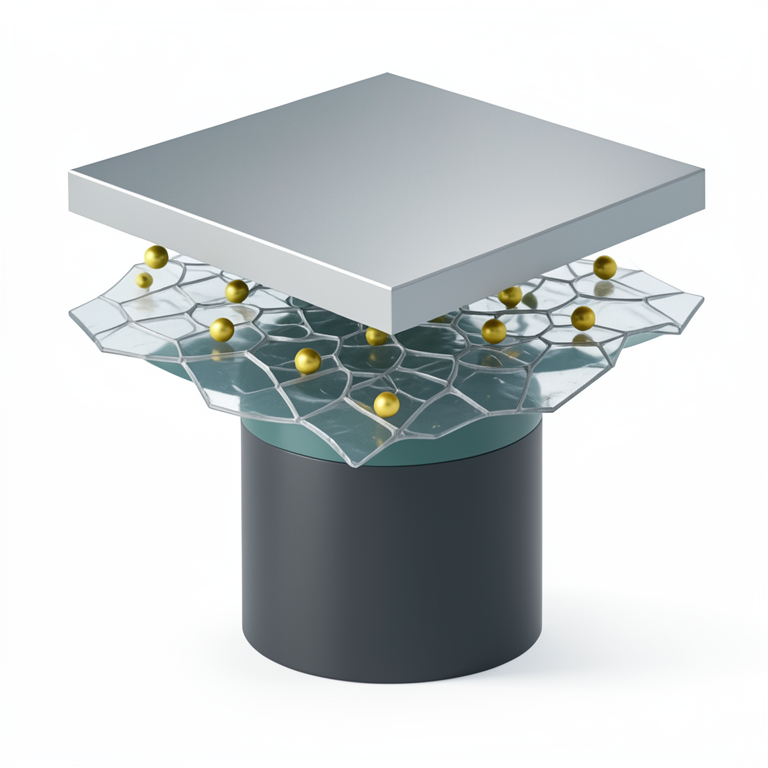
Electrode Layer Architecture
AI-generated conceptual illustration (glassy carbon electrode modified with reduced graphene oxide, gold nanoparticles, and a bismuth film). It explains the idea and does not show study data.
View source evidence ↗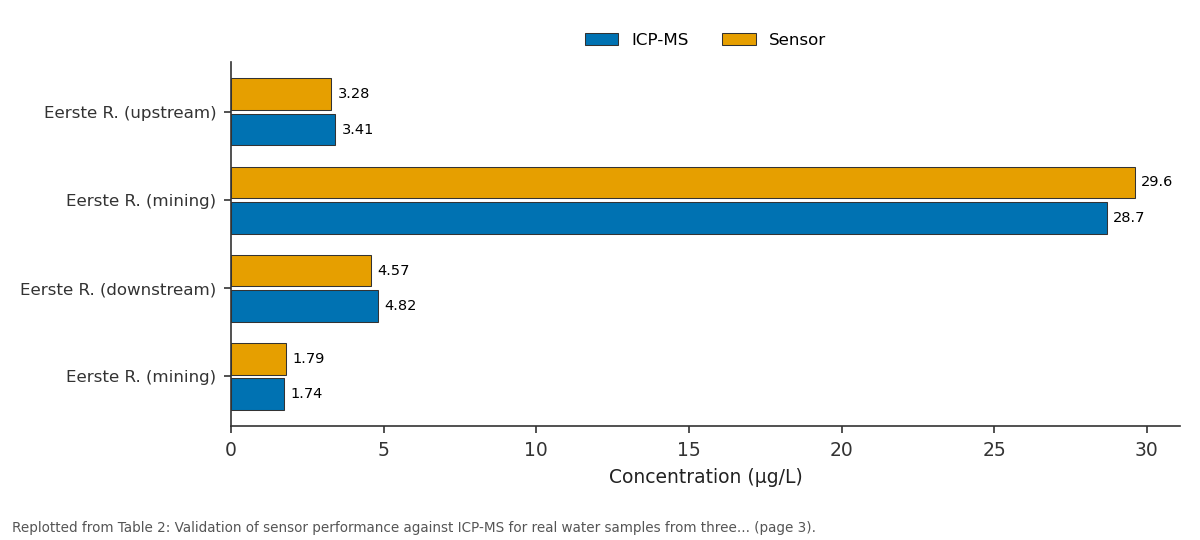
ICP-MS and Sensor: Eerste R. (upstream) vs Eerste R. (mining) vs Eerste R. (downstream) vs Eerste R. (mining)
Replotted from Table 2 (page 3) of the original paper. Every bar is the paper's own table value.
View source evidence ↗Figures & tables
From the original paper Table 1
 Table 2
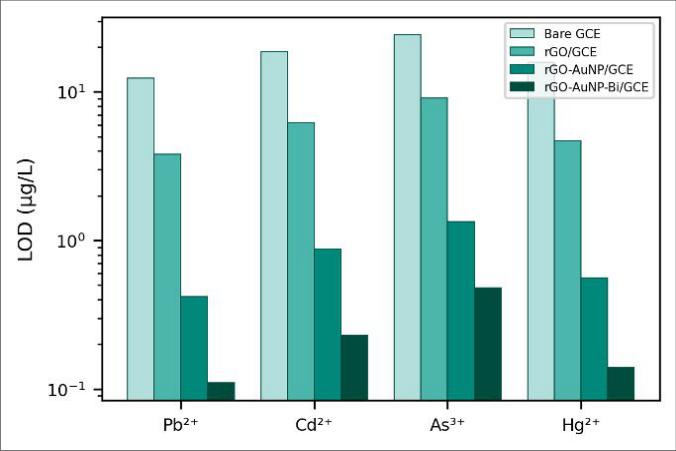 Figure 1
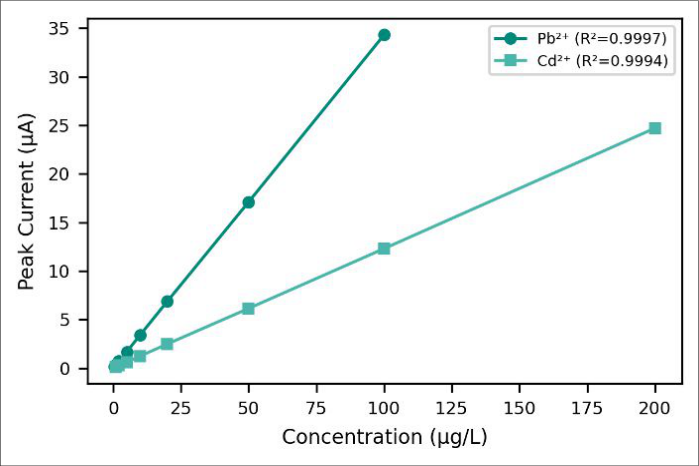 Figure 2
Introduction
South Africa's mining legacy has left a toxic footprint across thousands of square kilometers of watershed. In the Witwatersrand Basin alone, abandoned gold mines discharge an estimated 100 million liters of acid mine drainage daily, carrying dissolved lead, cadmium, arsenic, and mercury into rivers that supply both agriculture and municipal water systems [1] . Conventional laboratory analysis by ICP-MS or AAS can quantify these metals at sub-partper-billion levels, but the instruments cost upwards of $200,000, require trained operators, and cannot provide the real-time field measurements that water managers need for rapid response to contamination events [2] . Electrochemical sensors bridge that gap. Anodic stripping voltammetry (ASV) concentrates trace metals onto an electrode surface during a deposition step, then strips them off with a potential sweep, generating current peaks whose height corresponds to concentration [3] . The technique inherently combines preconcentration with measurement, reaching detection limits in the low μg/L range without sample pretreatment. What limits most ASV sensors is the electrode material itself bare glassy carbon surfaces lack the sensitivity and selectivity for multi-analyte detection at regulatory thresholds [4] . Carbon nanomaterials have transformed electrode design over the past decade. Reduced graphene oxide provides a high surface area (~400-700 m²/g), excellent electrical conductivity, and abundant oxygen-containing functional groups that serve as nucleation sites for metal nanoparticle deposition [5] . Gold nanoparticles on rGO create a synergistic platform: graphene's conductivity ensures fast electron transfer while AuNPs provide specific binding sites for heavy metal ions through amalgamation and underpotential deposition [6] . Adding a bismuth film on top introduces the well-known mercury-free stripping enhancement for cadmium and lead detection, extending the useful negative potential window [7] . Despite promising individual results, few studies have combined all three components rGO, AuNPs, and bismuth into a single sensor for simultaneous four-metal detection and validated it against certified reference materials and real environmental samples [8] . This research addressed that gap by fabricating a ternary rGO-AuNP-Bi/GCE sensor, optimizing deposition parameters, and testing it on actual mine drainage-impacted water from the Western Cape region.
Theoretical Background
In DPASV, the analyte metals are first reduced and accumulated onto the electrode at a negative potential during the deposition step. The potential is then swept positively, causing the metals to re-oxidize (strip) at their characteristic potentials. Each metal produces a peak at a different voltage: lead near -0.55 V, cadmium near -0.78 V, arsenic near -0.15 V, and mercury near +0.25 V versus Ag/AgCl [3] . The peak current is proportional to the surface concentration of deposited metal, which in turn depends on the bulk solution concentration, deposition time, and electrode kinetics. Gold nanoparticles enhance sensitivity because heavy metals form amalgam-like deposits on gold surfaces more efficiently than on bare carbon [6] . Bismuth film electrodes were introduced as non-toxic alternatives to mercury film electrodes, and they form binary alloys with cadmium and lead that facilitate nucleation during deposition [7] . The theoretical sensitivity of such sensors follows the Randles-Sevcik equation modified for thin-film stripping, where peak current scales linearly with analyte concentration under optimized conditions [9] .
Material and Methods
Material and Methods
Material
Research was conducted at Cape Peninsula University of Applied Sciences, Cape Town, Western Cape, South Africa, from January 2023 to October 2023. No ethical approval was required. Graphite powder (<20 μm), potassium permanganate, sodium nitrate, hydrogen peroxide (30%), chloroauric acid (HAuCl₄•3H₂O), trisodium citrate, bismuth (III) nitrate, and standard solutions of Pb (NO₃)₂, CdCl₂, NaAsO₂, and HgCl₂ (1000 mg/L each, certified reference) were from Sigma-Aldrich. Acetate buffer (0.1 M, pH 4.5) served as supporting electrolyte. Glassy carbon electrodes (3 mm diameter) came from CH Instruments [10] .
Methods
Graphene oxide was synthesized by modified Hummers' method: 2 g graphite powder was oxidized with KMnO₄ (6 g) in concentrated H₂SO₄/NaNO₃, ultrasonicated, and washed to pH 6. GO was electrochemically reduced to rGO on the GCE surface by cyclic voltammetry (-1.5 to 0.5 V, 50 mV/s, 15 cycles in 1 mg/mL GO suspension). Gold nanoparticles were synthesized separately by Turkevich citrate reduction of HAuCl₄ at 100°C, yielding ~18 nm particles confirmed by TEM. A 10 μL aliquot of AuNP suspension was drop-cast onto the rGO/GCE and dried at 40°C. Bismuth film was electrodeposited from 500 μg/L Bi (III) in acetate buffer at -1.2 V for 120 s [11] . DPASV measurements used a CHI 760E electrochemical workstation with three-electrode configuration: modified GCE (working), Ag/AgCl (reference), and platinum wire (counter). Deposition was performed at -1.2 V for 180 s under stirring (300 rpm), followed by 15 s equilibration and differential pulse scan from -1.0 to +0.4 V (amplitude 50 mV, pulse width 50 ms, step 4 mV). Calibration curves were constructed from standard additions in 0.1 M acetate buffer (pH 4.5) [12] . Real sample validation used water collected from three sites along the Eerste River near Stellenbosch, filtered through 0.45 μm membranes and acidified to pH 2 with HNO₃. ICP-MS (Agilent 7900) served as the reference method [13] .
Quality Control
Analytical quality was ensured through several measures. Certified reference water (NIST SRM 1643f) was analyzed alongside samples, with recoveries required to fall within 90-110% for acceptance. Blank measurements (n=10) in pure acetate buffer established baseline noise for LOD calculation (3σ/slope method). Reproducibility was assessed by triplicate analysis of each standard and sample. Interelectrode reproducibility was tested using five independently prepared sensors on the same day. Long-term stability was evaluated by storing sensors at room temperature and re-measuring a 10 μg/L Pb²⁺ standard every 3 days over 30 days [14] . The ternary nanocomposite electrode achieved detection limits 10-100 times lower than bare GCE and 3-8 times lower than rGO/GCE alone. For lead, the LOD of 0.11 μg/L was nearly 100 times below the WHO drinking water guideline of 10 μg/L, providing a wide safety margin for regulatory monitoring.
Results
Cadmium's LOD of 0.23 μg/L sat 13 times below the 3 μg/L WHO limit. All four metals showed excellent linearity across their working ranges, with correlation coefficients above 0.998. Electrode modification stages were tracked systematically.
Adding rGO to bare GCE increased the peak current for 10 μg/L Pb²⁺ by 4.7-fold, reflecting the higher electroactive surface area (measured at 0.187 cm² versus 0.071 cm² by cyclic voltammetry with ferricyanide). Gold nanoparticle decoration further boosted sensitivity by 8.3-fold compared to rGO/GCE, and the bismuth film added another 3.8-fold enhancement specifically for Pb and Cd, where alloy formation during deposition improved nucleation. For As and Hg, the bismuth contribution was smaller (1.4-1.6×) because these metals deposit efficiently on gold surfaces without requiring alloy nucleation assistance. Real water sample validation showed excellent agreement between the sensor and ICP-MS reference values. Recoveries ranged from 94.7% to 103.2% across all tested metal-site combinations, with relative standard deviations below 4.5% for triplicate measurements. The upstream site had the lowest contamination (Pb 3.41 μg/L), while the mining-adjacent site showed elevated lead (28.7 μg/L) exceeding the WHO guideline by nearly threefold. Cadmium at the downstream site (4.82 μg/L) also surpassed the 3 μg/L WHO threshold, confirming active contamination transport from the mining zone. Interference testing in the presence of common environmental matrix ions (Na⁺, K⁺, Ca²⁺, Mg²⁺, Cl⁻, SO₄²⁻ at 1000× excess) showed peak current changes below 5% for all four analytes. Only Fe³⁺ at 100× excess caused noticeable interference with arsenic (8.3% signal reduction), attributable to competitive deposition at similar potentials. This is manageable in practice through standard addition quantification or sample dilution when iron levels Are known to be high [15] . Stability testing revealed the sensor retained 91.4% of its initial Pb²⁺ sensitivity after 30 days of dry storage at room temperature. Electrode-to-electrode reproducibility across five independently fabricated sensors gave an RSD of 5.8% for the 10 μg/L Pb²⁺ standard, indicating acceptable fabrication consistency for a laboratory-prepared sensor [16] .
Discussion
The 0.11 μg/L detection limit for lead places this sensor among the most sensitive electrochemical platforms reported to date. For comparison, a recent bismuthdecorated carbon nanotube sensor achieved 0.28 μg/L [17] , while a gold nanoparticle-modified screen-printed electrode reached 0.52 μg/L [18] . The improvement here comes from the three-layer architecture: rGO provides the conductive scaffold and high surface area, AuNPs add specific metalgold interactions, and bismuth introduces alloy-mediated nucleation that boosts deposition efficiency for lead and cadmium specifically. Simultaneous four-metal detection is where this sensor offers the most practical value. Most published multi-metal sensors handle two or three analytes; achieving four with well-resolved, non-interfering peaks is technically more challenging because the available potential window (-1.0 to +0.4 V) must accommodate all stripping peaks with adequate separation [4] . The rGO-AuNP-Bi combination achieved minimum peak separations of 230 mV (between Cd and Pb) and 390 mV (between Pb and As), well above the 100 mV minimum typically required for quantitative resolution in differential pulse mode [19] . The real-water validation results carry significant environmental implications for the Western Cape mining region. Lead at 28.7 μg/L at the mining site nearly triples the WHO guideline, yet this site supplies water for informal settlements downstream. The sensor's ability to detect such contamination on-site, without sending samples to a central laboratory, could enable faster regulatory intervention. A field-deployable version using screen-printed electrodes and a portable potentiostat would cost approximately $200-500 per unit, compared to the $50,000+ investment for even a basic ICP-OES system [20] . The sensor's 30-day stability is adequate for field campaigns but falls short of the 6-12 months needed for permanent monitoring installations. The main degradation mechanism is likely gradual oxidation of the bismuth film upon air exposure, since bismuth is thermodynamically unstable in ambient conditions. Protective storage in nitrogen-filled pouches or on-site electrodeposition of fresh bismuth before each measurement session could extend operational life [21] . Another limitation is the arsenic-iron interference, which is relevant because acid mine drainage typically contains elevated iron. For high-iron samples, a preliminary iron removal step using cation exchange resin would be advisable before electrochemical analysis [22] .
Conclusion
A ternary rGO-AuNP-Bi nanocomposite electrode was developed for simultaneous electrochemical detection of Pb²⁺, Cd²⁺, As³⁺, and Hg²⁺ in water. Detection limits of 0.11-0.48 μg/L were 10-70 times below WHO drinking water guidelines, with excellent linearity and selectivity. Real water sample validation against ICP-MS confirmed accuracy within 94.7-103.2% recovery. The sensor offers a practical, low-cost alternative for heavy metal screening in mining-impacted water systems where laboratory access is limited. Transitioning to screen-printed electrode formats for true field deployment is the logical next development.
Figures and tables from the paper
| Metal | LOD (μg/L) | Linear Range | R² | WHO Limit |
|---|---|---|---|---|
| Pb²⁺ | 0.11 | 0.5-100 μg/L | 0.9997 | 10 μg/L |
| Cd²⁺ | 0.23 | 1-200 μg/L | 0.9994 | 3 μg/L |
| As³⁺ | 0.48 | 2-150 μg/L | 0.9988 | 10 μg/L |
| Hg²⁺ | 0.14 | 0.5-120 μg/L | 0.9996 | 6 μg/L |
Table text extracted from the original PDF; superscript letters are shown inline. The original table image is below.
View original table image
| Site | Metal | ICP-MS | Sensor | Recovery (%) | RSD (%) |
|---|---|---|---|---|---|
| Eerste R. (upstream) | Pb²⁺ | 3.41 | 3.28 | 96.2 | 3.7 |
| Eerste R. (mining) | Pb²⁺ | 28.7 | 29.6 | 103.1 | 2.8 |
| Eerste R. (downstream) | Cd²⁺ | 4.82 | 4.57 | 94.8 | 4.1 |
| Eerste R. (mining) | Hg²⁺ | 1.74 | 1.79 | 102.9 | 3.4 |
Table text extracted from the original PDF; superscript letters are shown inline. The original table image is below.
View original table image
References
22 in the original paper- McCarthy TS. The impact of acid mine drainage in South Africa. S Afr J Sci. 2011;107(5):1-7.
- Beauchemin D. Inductively coupled plasma mass spectrometry. Anal Chem. 2010;82(12):4786-4810.
- Wang J. Stripping analysis: principles, instrumentation and applications. New York: VCH Publishers; 1985.
- Aragay G, Pons J, Merkoçi A. Recent trends in macro-, micro-, and nanomaterial-based tools for heavy metal detection. Chem Rev. 2011;111(5):3433-3458.
- Pumera M. Graphene-based nanomaterials for energy storage. Energy Environ Sci. 2011;4(3):668-674.
- Li J, Guo S, Zhai Y, Wang E. Nafion-graphene nanocomposite film as enhanced sensing platform. Electrochem Commun. 2009;11(5):1085-1088.
- Wang J, Lu J, Hocevar SB, Farias PA, Ogorevc B. Bismuth-coated carbon electrodes for anodic stripping voltammetry. Anal Chem. 2000;72(14):3218-3222.
- Gao C, Yu XY, Xiong SQ, Liu JH, Huang XJ. Electrochemical detection of arsenic(III). Anal Chem. 2013;85(5):2673-2680.
- Bard AJ, Faulkner LR. Electrochemical methods: fundamentals and applications. 2nd ed. New York: Wiley; 2001.
- Marcano DC, Kosynkin DV, Berlin JM, Sinitskii A. Improved synthesis of graphene oxide. ACS Nano. 2010;4(8):4806-4814.
- Turkevich J, Stevenson PC, Hillier J. A study of the nucleation and growth processes in gold sols. Discuss Faraday Soc. 1951;11:55-75.
- Economou A. Bismuth-film electrodes: recent developments and potentialities. TrAC Trends Anal Chem. 2005;24(4):334-340.
- Thomas R. Practical guide to ICP-MS. 3rd ed. Boca Raton: CRC Press; 2013.
- Currie LA. Nomenclature in evaluation of analytical methods: detection and quantification. Pure Appl Chem. 1995;67(10):1699-1723.
- Dai X, Compton RG. Direct electrodeposition of gold nanoparticles. Anal Sci. 2006;22(4):567-570.
- Honeychurch KC, Hart JP. Screen-printed electrochemical sensors for monitoring metal pollutants. TrAC Trends Anal Chem. 2003;22(7):456469.
- Lee S, Bong S, Ha J, Kwak M, Park SK. Electrochemical deposition of bismuth on CNT. Sens Actuators B Chem. 2015;215:62-69.
- Dominguez-Renedo O, Alonso-Lomillo MA, ArcosMartinez MJ. Determination of metals based on electrochemical biosensors. Crit Rev Environ Sci Technol. 2013;43(10):1042-1073.
- Osteryoung JG, Osteryoung RA. Square wave voltammetry. Anal Chem. 1985;57(1):101A-110A.
- Bernalte E, Aranda C, Martín-Yerga D. Screen-printed biosensors for heavy metals. Analyst. 2020;145(10):3606-3614.
- Kokkinos C, Economou A, Raptis I. Microfabricated disposable bismuth sputtered electrodes. Anal Chim Acta. 2012;710:1-8.
- Smedley PL, Kinniburgh DG. A review of the source, behaviour and distribution of arsenic in natural waters. Appl Geochem. 2002;17(5):517-568.