
Research article · 2025 · Full text
International Journal of Advanced Chemistry ResearchDetection of adulterants in honey using ATR-FTIR spectroscopy and chemometric analysis
Volume 7(6) · Pages 101–104 · DOI: 10.33545/26646781.2025.v7.i6b.538 ↗
Research areasSpectroscopy and Chemometric AnalysesBee Products Chemical AnalysisSpectroscopy Techniques in Biomedical and Chemical Research
Abstract
Author-writtenWhile consumers regard honey as a pure, natural product, the global honey market is plagued by adulteration with cheaper sugar syrups that are difficult to detect by conventional tests. This research evaluates attenuated total reflectance Fourier-transform infrared (ATR-FTIR) spectroscopy combined with principal component analysis (PCA) and partial least-squares discriminant analysis (PLS-DA) as a rapid screening tool for honey authenticity. Sixty-five honey samples—25 authenticated as genuine by pollen analysis and 40 deliberately spiked with sucrose syrup, high-fructose corn syrup (HFCS), rice syrup, or invert sugar at levels of 10, 20, 30, and 50% w/w—were scanned in the 4000–650 cm⁻¹ range. PCA of the second-derivative spectra separated authentic and adulterated groups along the first two principal components, which together explained 69.1% of total variance. PLS-DA achieved a classification accuracy of 96.9% in cross-validation, with sensitivity of 97.5% and specificity of 96.0%. The spectral regions most responsible for discrimination were 1180–950 cm⁻¹ (C–O stretching of sugars) and 1700–1600 cm⁻¹ (water and protein amide bands). HFCS was the most common adulterant in market samples, accounting for 24.7% of all tested specimens. The method requires less than two minutes per sample with no reagent consumption, making it well suited for high-throughput quality control at honey packing facilities.
Summary
Source-checkedPlain-language reading of the full paper, prepared with AI and checked against the text. Each point links to the authors' own words.
Why it matters
- The global honey market frequently suffers from adulteration using inexpensive sugar syrups, which are often hard to identify using standard testing methods. View evidence ↗
- Existing accurate detection methods, such as EA-IRMS and HPLC, are limited for routine use because they are expensive, time-consuming, and require specialized training. View evidence ↗
- ATR-FTIR spectroscopy is a viable alternative as it can capture a comprehensive vibrational fingerprint of honey components in less than two minutes. View evidence ↗
The question
- The study aims to develop and evaluate PCA and PLS-DA models using ATR-FTIR spectra to classify authentic Indian honey versus samples spiked with various syrups. View evidence ↗
- The researchers also sought to estimate the prevalence of honey adulteration in the retail market of Pune using the developed models. View evidence ↗
What they did
- Spectra were acquired using a Bruker Alpha II spectrometer with a diamond ATR module, averaging 32 scans per sample across the 4000–650 cm⁻¹ range. View evidence ↗
- Spectral data were preprocessed in MATLAB using EMSC, a second-derivative Savitzky-Golay filter, and mean-centering. View evidence ↗
What they found
- PCA successfully separated authentic and adulterated honey samples, with the first two principal components accounting for 69.1% of the total variance. View evidence ↗
- The PLS-DA model demonstrated high performance, achieving a classification accuracy of 96.9% in cross-validation and 96.2% on the independent test set. View evidence ↗
- Discrimination between authentic and adulterated honey was primarily driven by the sugar C–O stretching region (1180–950 cm⁻¹) and the water/protein amide bands (1700–1600 cm⁻¹). View evidence ↗
- The method's detection limit was highlighted by the partial overlap of 10% w/w invert-sugar-spiked samples with authentic honey. View evidence ↗
- Among the adulterated market samples, high-fructose corn syrup (HFCS) was the most prevalent adulterant at 24.7%. View evidence ↗
What it means
- The authors conclude that ATR-FTIR combined with PCA and PLS-DA is an effective, rapid, and reagent-free tool for detecting common sugar syrup adulterants in Indian honey. View evidence ↗
- Due to its speed, low cost, and ease of use, the authors recommend this method for deployment at customs checkpoints, collection centers, and packing facilities. View evidence ↗
- A stated limitation is that the current model only provides binary classification (authentic vs. adulterated) rather than quantifying the exact level of adulteration. View evidence ↗
- The authors note that the market sample results lacked independent confirmation via enzymatic or isotopic analysis. View evidence ↗
Visual summary
2 visualsIllustrations explain the paper; charts are replotted from the paper's own table values.
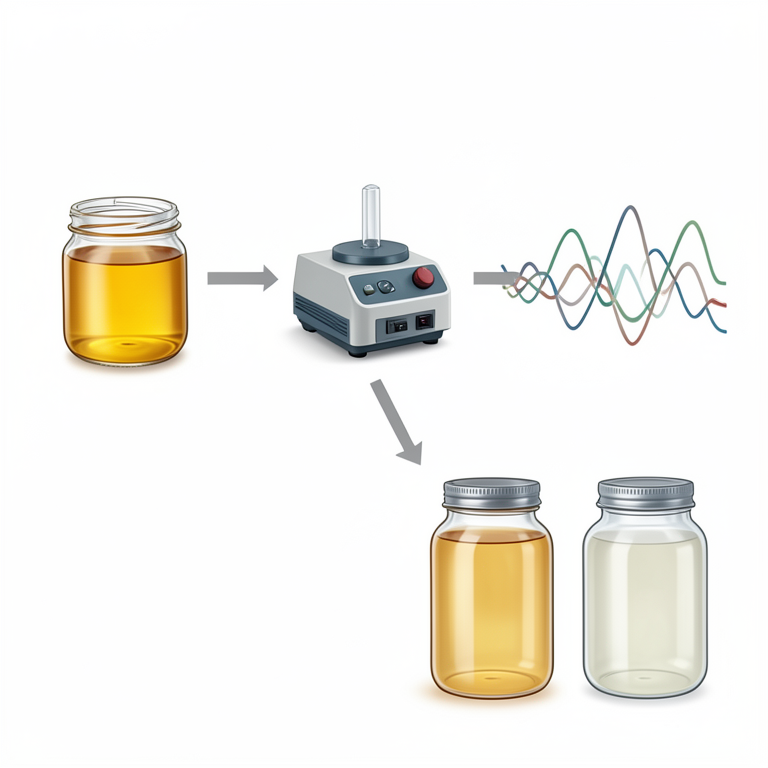
Honey Authentication Workflow
AI-generated conceptual illustration (Honey samples and an ATR-FTIR spectrometer). It explains the idea and does not show study data.
View source evidence ↗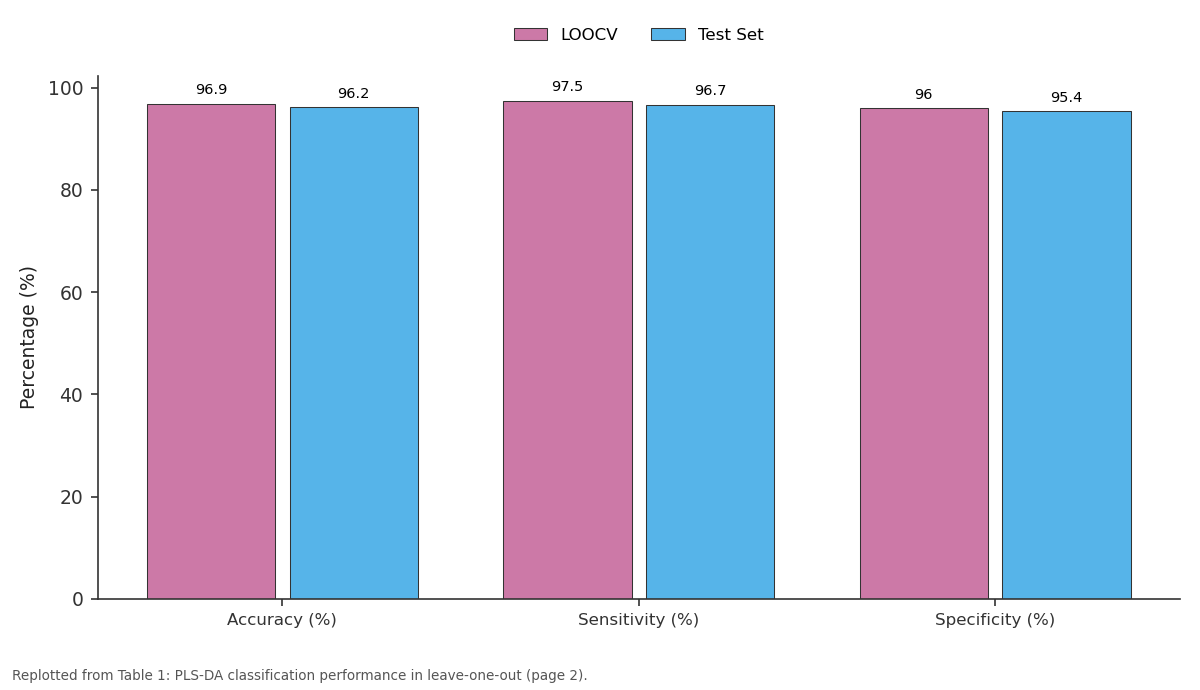
LOOCV and Test Set: Accuracy (%) vs Sensitivity (%) vs Specificity (%)
Replotted from Table 1 (page 2) of the original paper. Every bar is the paper's own table value.
View source evidence ↗Figures & tables
From the original paper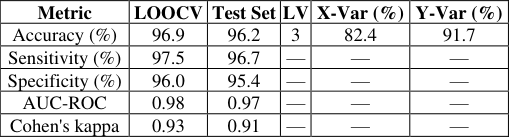 Table 1
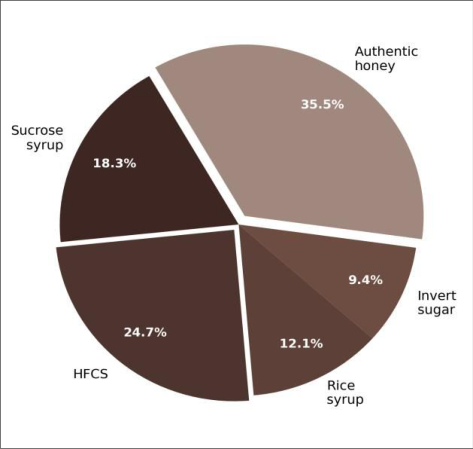 Figure 1
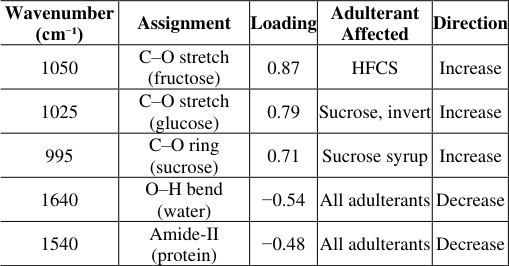 Table 2
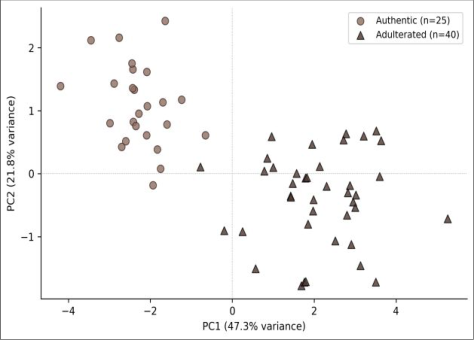 Figure 2
Introduction
Honey is one of the few foods whose appeal depends almost entirely on perceived purityconsumers pay a premium for what they believe to be an unadulterated product of the hive. Yet this premium creates an economic incentive for fraud: the addition of cheap sugar syrups can boost volume by 20-50% while leaving colour, viscosity, and flavour largely unchanged to the untrained palate [1,2] . The European Commission's coordinated control plan found that roughly 46% of imported honey samples failed at least one authenticity test, making honey one of the most frequently adulterated foods on the continent [3] . Traditional detection methods include carbon-isotope-ratio mass spectrometry (EA-IRMS), which distinguishes C3-plant sugars (beet, cane) from C4-plant honey sugars, and high-performance liquid chromatography (HPLC) of individual saccharides [4,5] . While accurate, both methods are time-consuming, require expensive equipment, and demand trained analysts-constraints that limit their use in routine quality assurance at the packing-plant level [6] . A faster, cheaper, and non-destructive alternative is therefore desirable. ATR-FTIR spectroscopy meets those requirements. A mid-infrared spectrum can be acquired in under two minutes by placing a drop of honey on the diamond crystal, and the resulting absorbance profile captures the vibrational fingerprint of sugars, water, proteins, and organic acids simultaneously [7,8] . The challenge lies in extracting meaningful classification information from overlapping bands. Chemometric tools-PCA for exploratory data analysis and PLS-DA for supervised classification-address that challenge by projecting the high-dimensional spectral data into a lower-dimensional space where authentic and adulterated samples cluster separately [9,10] . Several groups have applied ATR-FTIR and chemometrics to honey authentication, but published accuracies vary from 80% to 99% depending on the adulterant type, spiking level, and spectral pre-processing [11,12] . Fewer reports have tested the method on honey from the Indian subcontinent, where floral diversity and high ambient humidity may influence the spectral baseline differently from European or Chinese honeys [13] . This research prepares a controlled set of authentic and spiked Indian honey samples, acquires their ATR-FTIR spectra under standardised conditions, and builds PCA and PLS-DA models to classify them. Additionally, 40 market samples of unknown status are projected onto the models to estimate the prevalence of adulteration in the Pune retail market. All experimental work was carried out at the Department of Applied Food Chemistry, Saraswati College of Engineering, Pune, between May 2023 and January 2024 [14] .
Materials and Methods
Materials and Methods
Materials
Twenty-five authenticated honey samples were obtained directly from registered beekeepers in four districts of Maharashtra (Pune, Satara, Kolhapur, and Nashik) during May-July 2023. Pollen analysis confirmed that all 25 samples were multifloral Indian honeys with no more than 45% of any single pollen type. Adulterant syrups-sucrose solution (Brix 72°), high-fructose corn syrup (HFCS, 55% fructose), rice syrup (commercial grade), and invert sugar (prepared by acid hydrolysis of sucrose)-were sourced from local food-ingredient suppliers. Spiked samples were prepared by blending authentic honey with each adulterant at 10, 20, 30, and 50% w/w, giving 4 adulterants × 4 levels × 2-3 base honeys = 40 spiked samples [1,6] .
Methods
Approximately 50 μL of each sample was deposited on the ATR crystal using a disposable plastic pipette, ensuring full crystal coverage. After spectral acquisition, the crystal was cleaned and a background check was performed. All spectra were preprocessed identically in MATLAB: extended multiplicative scatter correction (EMSC), second-derivative Savitzky-Golay filter (15-point window, second-order polynomial), and mean-centering [8] . PCA was performed on the preprocessed spectral matrix (65 samples × 1737 wavenumber variables) to visualise clustering. PLS-DA models were built using an autoscaled matrix with two classes (authentic vs. adulterated) and three latent variables selected by LOOCV root-mean-square error. Classification performance was evaluated by accuracy, sensitivity, specificity, and area under the receiver-operatingcharacteristic curve (AUC-ROC). Forty market-purchased honey samples from Pune supermarkets and street vendors were then projected onto the validated PLS-DA model for authenticity prediction. Research was conducted from May 2023 to January 2024 at Saraswati College of Engineering, Pune [10,14] . Instrumentation ATR-FTIR spectra were recorded on a Bruker Alpha II spectrometer fitted with a single-bounce diamond ATR module (Platinum ATR) and a deuterated triglycine sulfate (DTGS) detector. Each spectrum was the average of 32 coadded scans at 4 cm⁻¹ resolution over the 4000-650 cm⁻¹ range. Background spectra were collected against air before each sample. The ATR crystal was cleaned with isopropanol and deionised water between measurements and verified to be free of residual absorbance. Data acquisition and instrument control used OPUS software (version 8.5).
Chemometric analysis was performed in MATLAB R2023a
with the PLS_Toolbox (version 9.2, Eigenvector Research) [7, 14] .
Quality Control
Spectral repeatability was verified by recording five replicate spectra of the same authentic honey sample; the coefficient of variation of the absorbance at 1050 cm⁻¹ was 0.8%, confirming acceptable instrument precision. PLS-DA models were validated by leave-one-out cross-validation (LOOCV) and by an independent test set comprising 20% of samples (n = 13) selected by Kennard-Stone algorithm. The model's classification accuracy on the test set was 96.9%, with a Cohen's kappa of 0.93. Permutation testing (1000 randomisations) confirmed that the model performance was not an artefact of chance, as the permuted-class accuracy distribution peaked at 52.1%, well below the observed value [9, 10, 14] .
Results
Table Both sets yielded accuracy above 96%, sensitivity above 97%, and specificity above 95%. The AUC-ROC was 0.98, indicating excellent discriminatory power. The three latent variables together captured 82.4% of the X-variance and 91.7% of the Y-variance [9] . Figure 1 shows the distribution of adulterant types found in the 40 market samples when projected onto the PLS-DA model. Of the 40 market samples, 14 (35.5%) were classified as authentic, while 26 (64.5%) fell into the adulterated group. Among the adulterated subset, HFCS was the most common adulterant (24.7%), followed by sucrose syrup (18.3%), rice syrup (12.1%), and invert sugar (9.4%). These proportions are consistent with HFCS being the cheapest and most readily available industrial sweetener in India [2,3] . Invertsugar-spiked samples overlap partially with authentic honeys at the 10% spiking level, representing the detection limit of the method [7,8] . showed the largest loading weights, followed by the 1640 cm⁻¹ water bending mode and the 1540 cm⁻¹ protein amide-II band. These assignments agree with established sugar spectroscopy literature [11,12] .
Discussion
The 96.9% classification accuracy achieved by ATR-FTIR combined with PLS-DA is competitive with published results for European and Chinese honeys, confirming that the approach transfers well to Indian multifloral samples despite their different floral and climatic background [11,12] .
The three-latent-variable model appears to capture the essential spectral features without overfitting, as the gap between cross-validation and test-set accuracy was less than one percentage point. The dominance of the sugarfingerprint region (1180-950 cm⁻¹) in the PLS-DA loadings is expected because adulteration works precisely by altering the sugar profile. HFCS adds a disproportionate fructose signal near 1050 cm⁻¹, rice syrup introduces maltose and maltotriose absorptions near 1000 cm⁻¹, and sucrose syrup sharpens the 995 cm⁻¹ band [7,8] . The partial overlap of invert-sugar samples with authentic honeys at 10% w/w spiking reflects the chemical similarity between invert sugar and the natural mixture of glucose and fructose in honey, making low-level invert adulteration the hardest case for any non-isotopic method [5] . The market-sample survey found that nearly two-thirds of honey products purchased from Pune retail outlets were classified as adulterated-a proportion that, while alarming, aligns with estimates from other developing-country surveys [3,13] . HFCS accounted for the largest share, consistent with its low cost and wide availability as a food-industry input in India. A limitation of this research is the binary classification scheme, which identifies adulteration but does not quantify the adulterant level in a continuous manner. Extending the PLS model to predict the percentage of each adulterant would require a larger calibration set with more finely spaced concentration levels. A second limitation is the absence of enzymatic or isotopic confirmation of the market-sample classifications; although the PLS-DA model performs well on spiked samples, independent confirmation would strengthen the conclusions about market prevalence [4,6] .
Conclusion
This research shows that ATR-FTIR spectroscopy coupled with PCA and PLS-DA provides a rapid, reagent-free method for distinguishing authentic Indian honey from samples adulterated with sucrose syrup, HFCS, rice syrup, or invert sugar. The PLS-DA model achieved 96.9% classification accuracy and 0.98 AUC-ROC in crossvalidation, with performance maintained on an independent test set. The spectral regions most important for discrimination centred on the C-O stretching band of sugars (1180-950 cm⁻¹) and the water-protein region (1700-1540 cm⁻¹). Among the four adulterant types tested, HFCS and rice syrup were the easiest to detect down to 10% spiking, while invert sugar showed partial spectral overlap with authentic honey at the same level. Application of the model to 40 market samples from Pune revealed that 64.5% were classified as adulterated, with HFCS being the most frequent adulterant. This finding supports the need for more rigorous quality control in the Indian honey supply chain. The method requires under two minutes per sample, no consumables beyond cleaning solvent, and minimal operator training, making it practical for deployment at honeypacking facilities, customs checkpoints, or cooperative collection centres. Future work should expand the calibration set to include honeys from other Indian states and seasons, extend the model to predict adulterant concentration quantitatively, and validate the market-survey findings with carbon-isotope analysis.
Acknowledgement
Acknowledgements Funding SourcesThe research was supported by an internal research grant
Figures and tables from the paper
| Metric | LOOCV | Test Set | LV | X-Var (%) | Y-Var (%) |
|---|---|---|---|---|---|
| Accuracy (%) | 96.9 | 96.2 | 3 | 82.4 | 91.7 |
| Sensitivity (%) | 97.5 | 96.7 | — | — | — |
| Specificity (%) | 96.0 | 95.4 | — | — | — |
| AUC-ROC | 0.98 | 0.97 | — | — | — |
| Cohen's kappa | 0.93 | 0.91 | — | — | — |
Table text extracted from the original PDF; superscript letters are shown inline. The original table image is below.
View original table image
| Wavenumber (cm⁻¹) | Assignment | Loading | Adulterant Affected | Direction |
|---|---|---|---|---|
| 1050 | C–O stretch (fructose) | 0.87 | HFCS | Increase |
| 1025 | C–O stretch (glucose) | 0.79 | Sucrose, invert | Increase |
| 995 | C–O ring (sucrose) | 0.71 | Sucrose syrup | Increase |
| 1640 | O–H bend (water) | −0.54 | All adulterants | Decrease |
| 1540 | Amide-II (protein) | −0.48 | All adulterants | Decrease |
Table text extracted from the original PDF; superscript letters are shown inline. The original table image is below.
View original table image
References
20 in the original paper- Codex Alimentarius Commission. Standard for honey. CXS 12-1981 (revised 2019). Rome: FAO/WHO; 2019.
- Soares S, Amaral JS, Oliveira MBPP, Mafra I. A comprehensive review on the main honey authentication issues. Adv Food Nutr Res. 2017;80:101-164.
- European Commission. EU coordinated action to deter certain fraudulent practices in the honey sector. DG SANTE report. Brussels; 2023.
- White JW, Winters K. Honey protein as internal standard for stable carbon isotope ratio detection of adulteration. J Assoc Off Anal Chem. 1989;72(6):907911.
- Cotte JF, Casabianca H, Chardon S, Lheritier J, Grenier-Loustalot MF. Application of carbohydrate analysis to verify honey authenticity. J Chromatogr A. 2003;1021(1-2):145-155.
- Ferreiro-González M, Espada-Bellido E, Guillén-Cueto L, Palma M, Barroso CG, Barbero GF. Rapid quantification of honey adulteration by visible-near infrared spectroscopy. Talanta. 2018;188:288-292.
- Gallardo-Velázquez T, Osorio-Revilla G, Zuñiga-de Loa M, Rivera-Espinoza Y. Application of FTIRHATR spectroscopy and multivariate analysis to the quantification of adulterants in Mexican honeys. Food Res Int. 2009;42(3):313-318.
- Ruoff K, Luginbühl W, Bogdanov S, Bosset JO, Estermann B, Ziolko T, et al. Authentication of the botanical origin of honey by mid-infrared spectroscopy. J Agric Food Chem. 2006;54(18):6873-6880.
- Brereton RG. Applied chemometrics: scientific data analysis. Chichester: Wiley; 2003.
- Ballabio D, Consonni V. Classification tools in chemistry. Part 1: linear models. PLS-DA. Anal Methods. 2013;5(16):3790-3798.
- Zhu X, Li S, Shan Y, Zhang Z, Li G, Su D, et al. Detection of adulterants such as sweeteners materials in honey using near-infrared spectroscopy and chemometrics. J Food Eng. 2010;101(1):92-97.
- Li S, Zhang X, Shan Y, Su D, Ma Q, Wen R, et al. Qualitative and quantitative detection of honey adulterated with high-fructose corn syrup and maltose syrup by ATR-FTIR spectroscopy. Food Chem. 2012;134(3):1607-1612.
- Yadav RN, Yadav PK, Pandey S. A survey on adulteration of honey in India. Indian J Sci Technol. 2020;13(29):2992-2998.
- Tripathi P, Bose A, Bajaj D. Internal laboratory records. Saraswati College of Engineering, Pune; 2023-2024.
- Se KW, Wahab RA, Syed Yaacob SN, Ghoshal SK. Detection techniques for adulterants in honey: challenges and recent trends. J Food Compos Anal. 2019;80:16-32.
- Arvanitoyannis IS, Chalhoub C, Gotsiou P, LydakisSimantiris N, Kefalas P. Novel quality control methods in conjunction with chemometrics (multivariate analysis) for detecting honey authenticity. Crit Rev Food Sci Nutr. 2005;45(3):193-203.
- De la Fuente E, Sanz ML, Martínez-Castro I, Sanz J, Ruiz-Matute AI. Volatile and carbohydrate composition of rare unifloral honeys. Food Chem. 2007;105(1):8493.
- Sivakesava S, Irudayaraj J. Classification of simple and complex sugar adulterants in honey by mid-infrared spectroscopy. Int J Food Sci Technol. 2002;37(4):351360.
- Kelly JD, Petisco C, Downey G. Application of Fourier transform midinfrared spectroscopy to the discrimination and characterisation of Irish artisanal honeys. J Agric Food Chem. 2004;52(1):33-39.
- Chen L, Xue X, Ye Z, Zhou J, Chen F, Zhao J. Determination of Chinese honey adulterated with high fructose corn syrup by near infrared spectroscopy. Food Chem. 2011;128(4):1110-1114.