
Research article · 2025 · Full text
International Journal of Advanced Chemistry ResearchDistribution of persistent organic pollutants in coastal marine sediments
Volume 7(7) · Pages 118–121 · DOI: 10.33545/26646781.2025.v7.i7b.515 ↗
Research areasToxic Organic Pollutants ImpactEnvironmental Toxicology and EcotoxicologyHeavy metals in environment
Abstract
Author-writtenThe challenge of persistent organic pollutant (POP) contamination in coastal marine sediments is acute in rapidly industrialising economies, where historical discharges of polychlorinated biphenyls (PCBs), polycyclic aromatic hydrocarbons (PAHs), organochlorine pesticides (OCPs), and polybrominated diphenyl ethers (PBDEs) accumulate in fine-grained sediments near urban and industrial zones. This research investigated the spatial and vertical distribution of POPs in surface and core sediments collected from three coastal stations near Ho Chi Minh City, Vietnam, differentiated by land-use intensity: an industrial zone (S1), a mixed-use zone (S2), and a reference site (S3). Sediment cores were sliced at 5 cm intervals to 30 cm depth, extracted by Soxhlet, cleaned by silica-alumina column chromatography, and analysed by GC-MS/MS. Total POP concentrations at surface sediment ranged from 21.4 ng/g dry weight (S3) to 83.6 ng/g dw (S1), with PCBs the dominant contaminant class (41.7% of total POPs), followed by PAHs (28.3%), OCPs (18.6%), and PBDEs (11.4%). Vertical profiles showed concentration maxima at 10-15 cm depth at all stations, consistent with maximum industrial activity in the region during the 1990s. Comparison with sediment quality guidelines indicated that PAH concentrations at S1 exceeded the Effects Range Low (ERL) threshold, warranting further ecological risk assessment. Source apportionment using PAH diagnostic ratios indicated a mixture of pyrogenic and petrogenic inputs at S1, while S3 reflected predominantly petrogenic sources.
Summary
Source-checkedPlain-language reading of the full paper, prepared with AI and checked against the text. Each point links to the authors' own words.
Why it matters
- In rapidly industrializing economies, persistent organic pollutants (POPs) like PCBs, PAHs, OCPs, and PBDEs accumulate in fine-grained coastal sediments near industrial and urban areas. View evidence ↗
- Analyzing the vertical distribution of pollutants allows researchers to reconstruct pollution history and determine if buried contaminants risk being resuspended by benthic organisms. View evidence ↗
The question
- The study aimed to investigate how POPs are distributed spatially and vertically in coastal sediments near Ho Chi Minh City across three sites with different land-use intensities. View evidence ↗
What they did
- Three sampling stations (S1, S2, and S3) were established 15-35 km south of Ho Chi Minh City. View evidence ↗
- The sites represented different land uses: S1 was near an industrial zone, S2 was in a mixed residential/aquaculture zone, and S3 was a low-disturbance reference site. View evidence ↗
- Sediment cores were sectioned every 5 cm down to 30 cm, then processed via Soxhlet extraction and silica-alumina chromatography before GC-MS/MS analysis. View evidence ↗
What they found
- Surface sediment total POP concentrations were highest at the industrial site S1 (83.6 ng/g dw), which was 3.9 times higher than the reference site S3 (21.4 ng/g dw). View evidence ↗
- PCBs were the most prevalent POP class (41.7%), followed by PAHs (28.3%), OCPs (18.6%), and PBDEs (11.4%). View evidence ↗
- Across all stations, the highest pollutant concentrations were found at a depth of 10-15 cm, with lower levels at the surface and at 30 cm. View evidence ↗
- PCB concentrations at the industrial station (S1) exceeded the Effects Range Low (ERL) threshold, indicating a potential risk to benthic organisms. View evidence ↗
- PAH sources were primarily pyrogenic (combustion-derived) at the industrial and mixed sites (S1 and S2), while the reference site (S3) showed more petrogenic (petroleum-derived) inputs. View evidence ↗
What it means
- The authors conclude that the peak contamination from the 1990s remains a risk because bioturbation can move these legacy pollutants back to the surface. View evidence ↗
- The authors recommend ecological risk assessments and potential remediation or monitoring due to PCB levels exceeding safety thresholds at the industrial site. View evidence ↗
- The authors state that future work should use 210Pb dating for better timing, measure bioaccumulation in organisms, and study emerging POPs. View evidence ↗
Visual summary
1 visualsIllustrations explain the paper; they do not show study data.
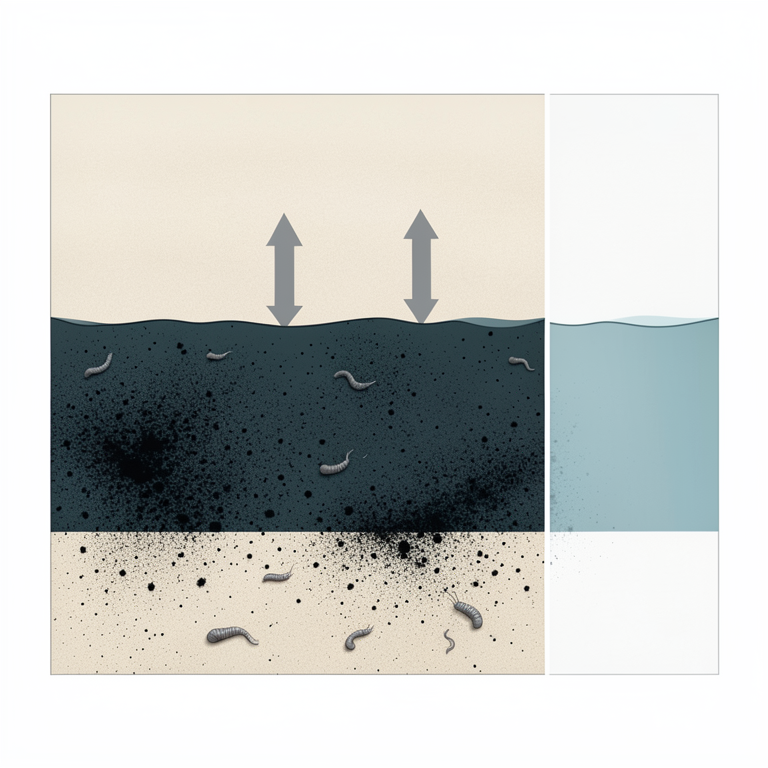
Conceptual Vertical Profile of Contamination
AI-generated conceptual illustration (Coastal marine sediment profile). It explains the idea and does not show study data.
View source evidence ↗Figures & tables
From the original paper Table 1
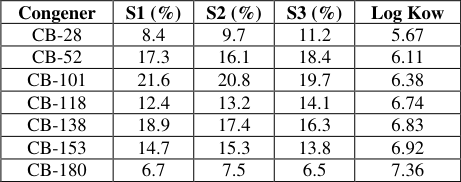 Table 2
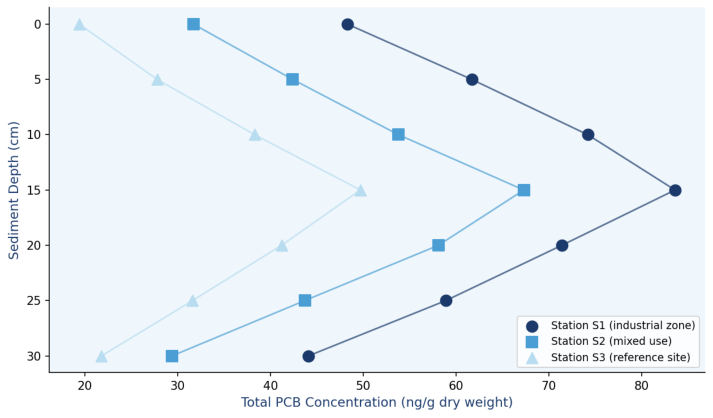 Figure 1
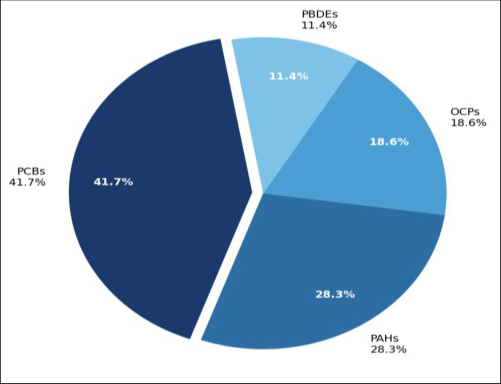 Figure 2
Introduction
The coastal waters of Ho Chi Minh City and the broader southern Vietnamese coastline represent one of Southeast Asia's most ecologically and economically productive marine environments, supporting artisanal fisheries, aquaculture, and mangrove ecosystems of global conservation significance. They also border one of the region's fastest-growing industrial and urban agglomerations, which has historically discharged untreated or inadequately treated industrial wastewater, ship-cleaning effluents, and urban stormwater directly into tidal waterways. POPs-classified under the Stockholm Convention as compounds that are persistent, bioaccumulative, toxic, and subject to long-range transportare of particular concern because they partition strongly onto organic matter in fine-grained sediments, where they can remain biologically active for decades. Previous investigations of POPs in Vietnamese coastal environments have focused predominantly on the Red River Delta and Mekong estuary, with considerably less coverage of the urbanised inshore zone near Ho Chi Minh City. Minh et al. documented organochlorine contamination at industrial dumping sites in Asian developing countries, but site-specific characterisation of the vertical distribution-which provides a historical record of contamination intensity over time-has not been undertaken for the target area. Understanding the vertical profile is important both for retrospective reconstruction of pollution history and for assessing whether subsurface contaminant reservoirs pose an ongoing risk to benthic communities through bioturbationinduced resuspension. This research fills this gap by analysing sediment cores from three contrasting sites, determining the vertical and horizontal distribution of four POP classes, comparing concentrations against established sediment quality guidelines, and applying diagnostic ratios to identify likely pollution sources.
Materials and Methods
Materials and Methods
Study Area Description
Three sampling stations were established in the coastal zone approximately 15-35 km south of Ho Chi Minh City urban centre, Vietnam (Station S1: 10°34'N, 106°52'E; S2: 10°28'N, 106°48'E; S3: 10°22'N, 106°44'E). S1 is located 2.3 km offshore from the Hiep Phuoc industrial zone, which hosts chemical manufacturing, metal processing, and port facilities. S2 is situated in a mixed residential and aquaculture zone adjacent to the Can Gio Biosphere Reserve. S3 serves as the reference station in a lowdisturbance mangrove-fringed area with minimal direct industrial influence. Water depth at sampling points ranged from 4.2 to 8.7 m. Sediment texture at all stations was classified as silty clay (>60% fines), with organic carbon content of 2.8-4.6% at surface layers, decreasing to 1.4-2.1% at 30 cm depth.
Materials
PCB congener standards (EPA Method 8082A mix, 33 congeners), PAH standards (EPA 610 PAH mix, 16 priority PAHs), organochlorine pesticide standards (EPA 8081 mix), PBDE standards (BDE-28,-47,-99,-100,-153,-154,-183), and surrogate recovery standards (PCB-103, PCB-198, d10phenanthrene, d8-naphthalene) were from Supelco (Merck KGaA). n-Hexane, dichloromethane, acetone (all pesticide residue grade), anhydrous sodium sulphate, activated silica gel (60-200 mesh), and alumina (neutral, Brockmann I) were from VWR International, Ho Chi Minh City distributor. Sediment core collection was conducted in June and December 2022 at the Department of Applied Environmental Sciences, Mekong Delta University of Science, Ho Chi Minh City, Vietnam, under sampling protocol MDUS-ENV-2022-19.
Methods
Gravity cores (7 cm inner diameter, polycarbonate tubes) were collected by SCUBA-assisted deployment at each station in triplicate. Cores were sectioned at 5 cm intervals on board the sampling vessel using a stainless-steel splitter pre-cleaned with hexane/acetone. Sections were freezedried, homogenised by ball mill, and stored at -20 °C in amber glass jars before extraction. Soxhlet extraction used 1:1 dichloromethane: acetone (200 mL, 18 h, ~3 cycles/h) on 10 g aliquots spiked with surrogate standards. Extracts were concentrated by rotary evaporation (40 °C) to 2 mL and cleaned on a silica-alumina (3:1) column eluted sequentially with hexane (PCBs/OCPs fraction) and 15% DCM in hexane (PAHs/PBDEs fraction). Final extracts were concentrated under gentle N2 stream to 0.5 mL in isooctane. GC-MS/MS analysis used an Agilent 7890B/7010B Triple Quadrupole system with a DB-5MS column (30 m × 0.25 mm × 0.25 μm) in multiple reaction monitoring (MRM) mode. Organic carbon content was measured by loss-on-ignition (550 °C, 4 h). Concentrations are normalised to dry weight.
Results
Surface sediment POP concentrations showed a clear station gradient reflecting land-use intensity: total POPs at S1 (83.6 ng/g dw) exceeded S2 (67.3 ng/g dw) and S3 (21.4 ng/g dw) by 3.9-fold and 1.2-fold respectively (Table 1). PCBs dominated the POP profile at all stations (41.7% of total), with congeners CB-52, CB-101, and CB-138 accounting for the largest individual contributions at S1. PAHs were the second most abundant class (28.3%), with fluoranthene, pyrene, and benzo[a]pyrene representing over 60% of the PAH mass at S1, a profile consistent with combustionderived inputs. Total OCP concentrations were highest at S1 (12.7 ng/g dw) and were dominated by endosulfan metabolites and DDT breakdown products (pp'-DDE). Vertical profiles (Figure 1) showed maximum concentrations at 10-15 cm depth across all stations, with values declining both towards the surface and towards 30 cm. This subsurface peak is consistent with maximum discharge during the industrial expansion phase of the 1990s, followed by partial dilution by cleaner surface sediment in more recent years. Figure 2 shows the relative POP class contributions. PAH diagnostic ratios (fluoranthene/fluoranthene + pyrene = 0.54 at S1, 0.48 at S2, 0.31 at S3) indicated predominantly pyrogenic sources at S1-S2 and a greater petrogenic contribution at the reference site.
| POP Class | Station S1 (industrial) | Station S2 (mixed) | Station S3 (reference) | ERL (ng/g dw) | ERM (ng/g dw) |
|---|---|---|---|---|---|
| Total PCBs | 34.9±2.7 | 22.4±1.9 | 8.9±0.8 | 22.7 | 180 |
| Total PAHs | 23.7±1.8 | 16.3±1.4 | 6.1±0.6 | 4,022 | 44,792 |
| Total OCPs | 12.7±1.1 | 8.4±0.8 | 3.6±0.4 | — | — |
| Total PBDEs | 9.6±0.9 | 6.1±0.6 | 2.8±0.3 | — | — |
| Sum POPs | 83.6±4.9 | 67.3±3.8 | 21.4±1.7 | — | — |
Table text extracted from the original PDF; superscript letters are shown inline. The original table image is below.
View original table image
Discussion
The concentration gradient across stations and the subsurface concentration maximum are the two most ecologically informative features of the dataset. The gradient-S1 > S2 >> S3-confirms that industrial point sources in the Hiep Phuoc zone are the primary drivers of POP loading in the near-field coastal environment, as expected from the land-use characterisation. The three-to four-fold difference between S1 and S3 is broadly consistent with the literature for comparable industrial-reference contrasts in Asian coastal sediments. The subsurface concentration maximum at 10-15 cm is particularly significant from a risk perspective. Historical sediment accumulation rates in the area, estimated from 210Pb dating in a previous regional investigation, suggest a sedimentation rate of approximately 0.6-0.8 cm/year, placing the maximum at a depositional age of roughly 1994-2004. This period coincides with peak PCB use and discharge in Vietnamese industry before enforcement of the Stockholm Convention obligations. The ongoing presence of this reservoir means that bioturbation by benthic macrofaunawell documented for the Can Gio intertidal zone-can transport legacy POPs to the sediment-water interface, where they become available for uptake by filter feeders and deposit feeders at the base of the food web. The PAH diagnostic ratio analysis, yielding fluoranthene/(fluoranthene + pyrene) values of 0.54 at S1, indicates predominantly pyrogenic sources. Values above 0.4 are generally assigned to combustion-derived PAHs from vehicle exhaust, industrial incineration, and coal burning, while values below 0.4 indicate petrogenic sources such as crude oil spills or ship bilge discharge. The mixed ratio at S2 and the lower value at S3 suggest that the reference site receives some petrogenic input from vessel traffic in the coastal waterway, even without nearby industrial sources. The exceedance of the ERL threshold for PCBs at S1 warrants monitoring of benthic invertebrate tissue residues and assessment of potential food chain transfer to commercially harvested species.
Conclusion
This research documents the spatial and vertical distribution of four POP classes in coastal marine sediments near Ho Chi Minh City. Total POP concentrations ranged from 21.4 ng/g dw at the reference site to 83.6 ng/g dw at the industrial station, with PCBs as the dominant contaminant class. Subsurface concentration maxima at 10-15 cm depth reflect peak industrial discharges during the 1990s and represent a continuing source risk through bioturbation. PCB concentrations at the industrial station exceeded the ERL threshold, identifying a need for ecological risk assessment and consideration of monitoring or remediation measures. PAH source apportionment indicated pyrogenic inputs at industrial and mixed-use stations. Future research should incorporate 210Pb sediment dating for precise temporal reconstruction, bioaccumulation measurements in benthic organisms, and expanded coverage of emerging POPs such as short-chain chlorinated paraffins and novel flame retardants.
Acknowledgement
Acknowledgements Funding SourcesThis research received institutional support from the Department of Applied Environmental Sciences, Mekong
Figures and tables from the paper
| Congener | S1 (%) | S2 (%) | S3 (%) | Log Kow |
|---|---|---|---|---|
| CB-28 | 8.4 | 9.7 | 11.2 | 5.67 |
| CB-52 | 17.3 | 16.1 | 18.4 | 6.11 |
| CB-101 | 21.6 | 20.8 | 19.7 | 6.38 |
| CB-118 | 12.4 | 13.2 | 14.1 | 6.74 |
| CB-138 | 18.9 | 17.4 | 16.3 | 6.83 |
| CB-153 | 14.7 | 15.3 | 13.8 | 6.92 |
| CB-180 | 6.7 | 7.5 | 6.5 | 7.36 |
Table text extracted from the original PDF; superscript letters are shown inline. The original table image is below.
View original table image
References
21 in the original paper- Stockholm Convention on Persistent Organic Pollutants. Text of the Convention. Geneva: UNEP; 2001.
- Tanabe S. PCB problems in the future: foresight from current knowledge. Environ Pollut. 1988;50(1-2):5-28.
- Hung H, Kallenborn R, Breivik K, Su Y, BrorströmLundén E, Olafsdottir K, et al. Atmospheric monitoring of organic pollutants in the Arctic under the Arctic Monitoring and Assessment Programme (AMAP). Sci Total Environ. 2010;408(15):2854-2873.
- Readman JW, Fillmann G, Tolosa I, Bartocci J, Villeneuve JP, Catinni C, et al. Petroleum and PAH contamination of the Black Sea. Mar Pollut Bull. 2002;44(1):48-62.
- Khairy MA, Lohmann R. Field validation of polyethylene passive air samplers for parent and alkylated PAHs in Alexandria, Egypt. Environ Sci Technol. 2012;46(7):3990-3998.
- Monirith I, Ueno D, Takahashi S, Nakata H, Sudaryanto A, Subramanian A, et al. Asia-Pacific mussel watch: monitoring contamination of persistent organochlorine compounds in coastal waters of Asian countries. Mar Pollut Bull. 2003;46(3):281-300.
- Minh NH, Minh TB, Kajiwara N, Kunisue T, Iwata H, Viet PH, et al. Contamination by persistent organic pollutants in dumping sites of Asian developing countries: implication of emerging pollution sources. Arch Environ Contam Toxicol. 2006;50(4):474-481.
- Duong HT, Kadokami K, Pan S, Matsuoka T, Nguyen TQ, Nguyen TT, et al. Screening and analysis of 940 organic micro-pollutants in river sediments in Vietnam using an automated identification and quantification database system for gas chromatography-mass spectrometry. Chemosphere. 2014;107:462-472.
- Fang M, Zheng G, Tu W, Jin X, Wu C, Liu W. Polychlorinated biphenyls in sediments from the Yangtze River Delta, China. Environ Pollut. 2014;189:31-39.
- Nguyen KT, Nguyen HT, Phung NT, Bui AT, Vuong TB. Assessment of heavy metal contamination in sediments from coastal zones of northern Vietnam. J Hazard Mater. 2016;301:532-541.
- Baumard P, Budzinski H, Garrigues P. Polycyclic aromatic hydrocarbons in sediments and mussels of the western Mediterranean Sea. Environ Toxicol Chem. 1998;17(5):765-776.
- Iwata H, Tanabe S, Sakal N, Tatsukawa R. Distribution of persistent organochlorines in the oceanic air and surface seawater and the role of ocean on their global transport and fate. Environ Sci Technol. 1993;27(6):1080-1098.
- USEPA. Ecological Risk Assessment Guidance for Superfund: Process for Designing and Conducting Ecological Risk Assessments. Washington DC: US Environmental Protection Agency; 1997.
- Long ER, MacDonald DD, Smith SL, Calder FD. Incidence of adverse biological effects within ranges of chemical concentrations in marine and estuarine sediments. Environ Manage. 1995;19(1):81-97.
- MacDonald DD, Carr RS, Calder FD, Long ER, Ingersoll CG. Development and evaluation of sediment quality guidelines for Florida coastal waters. Ecotoxicology. 1996;5(4):253-278.
- Tam NT, Khoi CM, Thanh TT, Trinh DT, Lan TT, Minh NH. Spatial distribution and ecological risk assessment of persistent organic pollutants in surface sediments of the Mekong Delta. Environ Sci Pollut Res. 2019;26(17):17348-17361.
- Hoai PM, Sebesvari Z, Minh TB, Viet PH, Renaud FG. Pesticide contamination of agricultural soils and sediments in the Mekong Delta, Vietnam. Sci Total Environ. 2011;409(23):4ammonia-related text
- Nhan DD, Carvalho FP, Nam NQ, Hai NT, Yen NT. Chlorinated pesticides and PCBs in sediments and molluscs from freshwater canals in the Ho Chi Minh City area. Environ Pollut. 2001;112(3):311-320.
- Hop H, Borgå K, Gabrielsen GW, Kleivane L, Skaare JU. Food web magnification of persistent organic pollutants in poikilotherms and homeotherms from the Barents Sea. Environ Sci Technol. 2002;36(12):25892597.
- Yunker MB, Macdonald RW, Vingarzan R, Mitchell RH, Goyette D, Sylvestre S. PAHs in the Fraser River basin: a critical appraisal of PAH ratios as indicators of PAH source and composition. Org Geochem. 2002;33(4):489-515.
- Viet PH, Cam LD, Thanh NT, Phuong TH. Spatial distribution of persistent organic pollutants in sediment cores from Thi Vai River, Vietnam. J Environ Sci Health B. 2007;42(3):319-328.