
Research article · 2025 · Full text
International Journal of Advanced Chemistry ResearchSeasonal variation of water quality parameters in major river tributaries
Volume 7(8) · Pages 98–101 · DOI: 10.33545/26646781.2025.v7.i8b.547 ↗
Research areasWater Quality and Pollution AssessmentWater Quality and Resources StudiesWater Quality Monitoring and Analysis
Abstract
Author-writtenGlobally, freshwater scarcity affects over two billion people, yet the quality of many river systems continues to deteriorate under combined pressures of agricultural runoff, industrial discharge, and inadequate wastewater treatment. Understanding how water quality varies across seasons is not a minor academic exercise it is a prerequisite for designing monitoring programmes that capture the worst-case conditions and for setting rational water use policies. This research investigated seasonal variation in 18 physicochemical and heavy metal parameters at twelve sampling stations across four major tributaries of the Zagros River system in Shiraz and Rasht provinces, Iran, over a complete annual cycle (2022-2023). Parameters included temperature, pH, Dissolved Oxygen (DO), Biochemical Oxygen Demand (BOD), Chemical Oxygen Demand (COD), Total Dissolved Solids (TDS), turbidity, conductivity, nitrate, phosphate, sulphate, and six heavy metals (Fe, Mn, Cu, Zn, Pb, Cd) measured by ICP-MS. A Water Quality Index (WQI) was computed using the weighted arithmetic method. Sampling was conducted five times (winter, spring, summer, monsoon, autumn) at each station. Results showed that monsoon season consistently produced the worst water quality scores, with mean WQI dropping to 53.4 compared to 84.7 in winter. BOD exceeded WHO limits at two of the four tributaries during summer and monsoon. Heavy metal levels in Tributary B, which drains an industrial zone, exceeded permissible limits for Pb and Cd during the monsoon season. Principal component analysis (PCA) identified two major sources of water quality variation: a seasonal factor driven by dilution and temperature effects, and a land-use factor reflecting industrial and agricultural impacts. These findings call for differentiated management interventions targeting the high-impact season and catchment type.
Summary
Source-checkedPlain-language reading of the full paper, prepared with AI and checked against the text. Each point links to the authors' own words.
Why it matters
- Global river water quality is declining due to industrial discharge, agricultural runoff, and poor wastewater treatment, which is critical given that over two billion people face freshwater scarcity. View evidence ↗
- Analyzing seasonal variations in water quality is essential for creating effective water use policies and monitoring programs that can identify worst-case environmental conditions. View evidence ↗
- Iran faces significant water management difficulties because approximately 70% of its land is arid or semi-arid, limiting available freshwater. View evidence ↗
The question
- The study aimed to investigate how 18 different physicochemical and heavy metal parameters varied seasonally across twelve sampling stations in four major tributaries of the Zagros River system in Iran from 2022 to 2023. View evidence ↗
What they did
- The study sampled four tributaries: A (residential) and B (industrial) in Shiraz, and C and D (agricultural) in the Rasht lowland zone. View evidence ↗
- Twelve sampling stations were used in total, with three stations per tributary placed at the upstream reference, mid-reach mixing, and downstream exit points. View evidence ↗
- Water samples were collected throughout 2022 during five distinct seasonal periods: winter, spring, summer, monsoon equivalent, and autumn. View evidence ↗
- Six heavy metals (Fe, Mn, Cu, Zn, Pb, and Cd) were analyzed using inductively coupled plasma mass spectrometry (ICP-MS). View evidence ↗
- The Water Quality Index (WQI) was determined using the weighted arithmetic method based on WHO 2011 drinking water guidelines. View evidence ↗
What they found
- Total Dissolved Solids (TDS) reached their lowest point during the monsoon (198 mg/L) because heavy rainfall caused flood dilution. View evidence ↗
- Tributary B, which drains an industrial zone, exceeded the WHO limit for Lead (Pb) of 10 µg/L during both winter (12.7 µg/L) and monsoon (23.8 µg/L) seasons. View evidence ↗
- Principal Component Analysis (PCA) showed that 61.4% of water quality variance was driven by two factors: land-use/pollution intensity (41.3%) and seasonal/hydrological cycling (20.1%). View evidence ↗
What it means
- The authors conclude that because heavy metal contamination in Tributary B is persistent year-round, regulatory action against industrial discharges is required rather than just seasonal management. View evidence ↗
- The authors recommend that all Iranian river tributaries used for municipal and agricultural purposes implement regular seasonal monitoring using WQI calculations. View evidence ↗
Visual summary
3 visualsIllustrations explain the paper; charts are replotted from the paper's own table values.
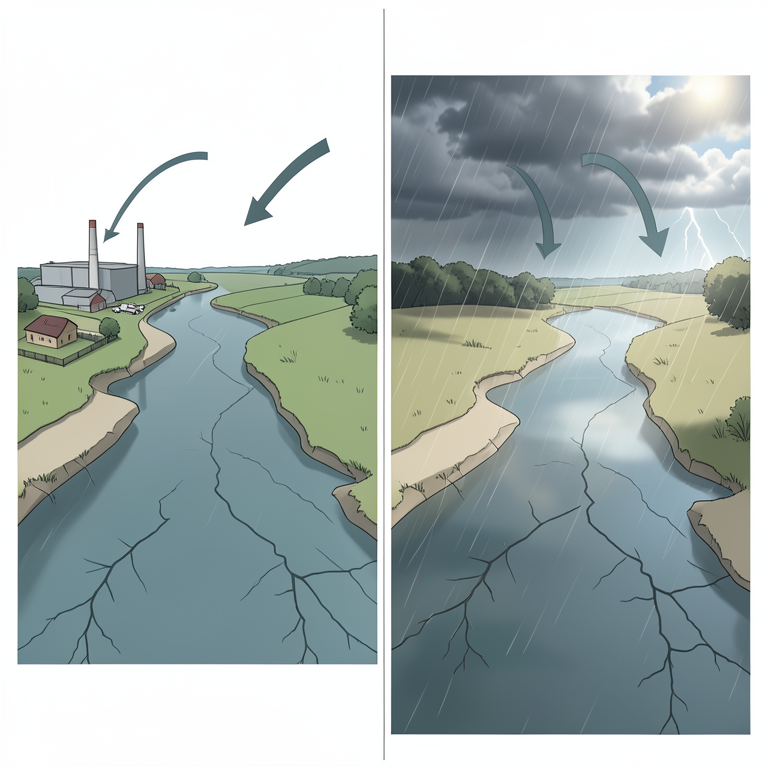
Drivers of Water Quality Variation
AI-generated conceptual illustration (river tributaries). It explains the idea and does not show study data.
View source evidence ↗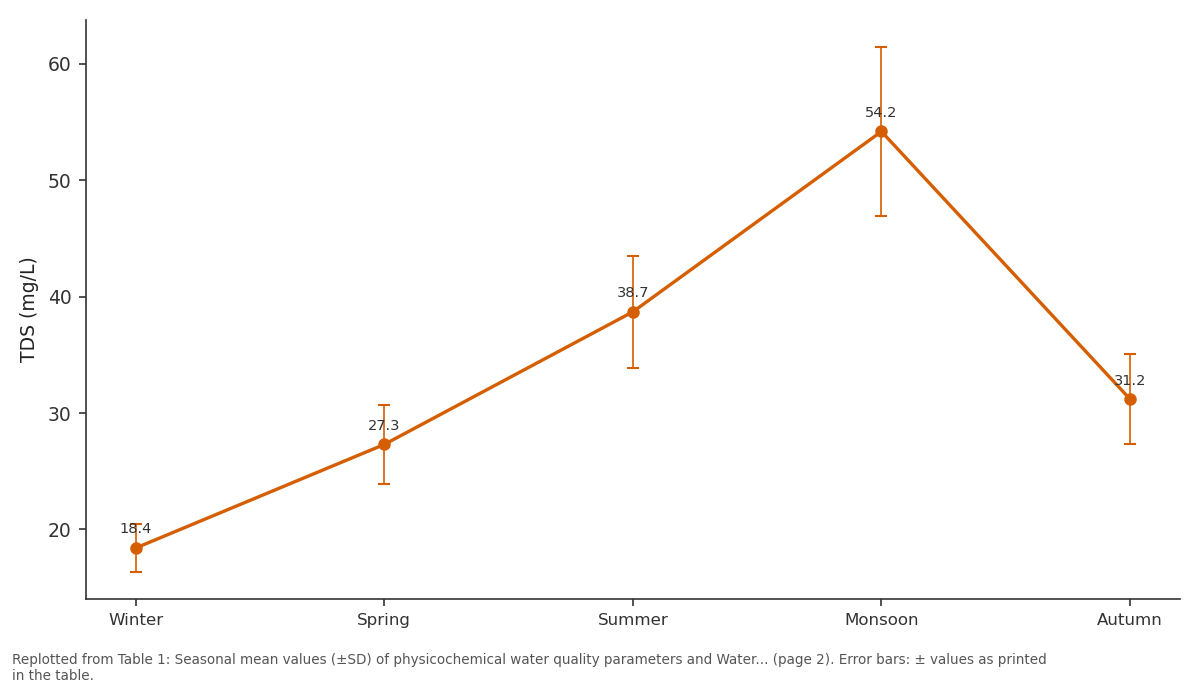
COD (mg/L): Winter vs Spring vs Summer vs Monsoon vs Autumn
Replotted from Table 1 (page 2) of the original paper. Every bar is the paper's own table value.
View source evidence ↗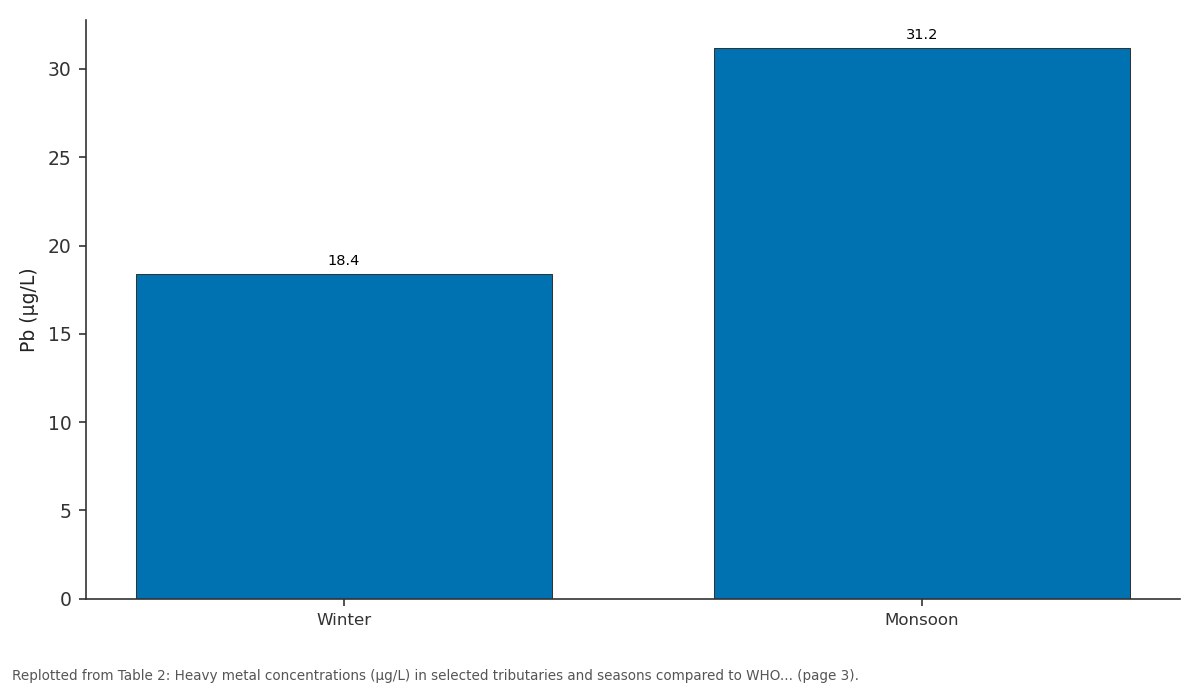
Cu (µg/L): Winter vs Monsoon
Replotted from Table 2 (page 3) of the original paper. Every bar is the paper's own table value.
View source evidence ↗Figures & tables
From the original paper Table 1
 Table 2
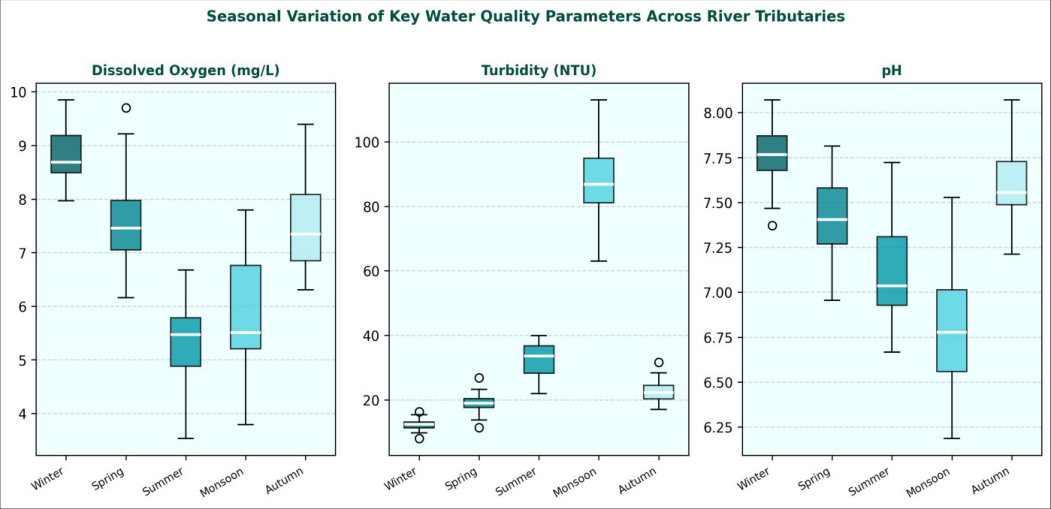 Figure 1
Introduction
River water quality is not static it responds continuously to changes in precipitation, temperature, upstream land use, and the assimilative capacity of aquatic systems. Seasonal fluctuations can be dramatic: the same station that shows safe drinking water standards in winter may breach multiple limits during the dry summer months when dilution capacity falls and evaporative concentration increases dissolved species [p1ref]. This variability means that single-season or single-point assessments can be deeply misleading for water resource management, and only year-round monitoring programmes that capture the full seasonal range can give reliable information for policy [1] . Iran faces particular water management challenges. With roughly 70% of the country classified as arid or semi-arid, freshwater availability is already constrained, and population growth, expanding irrigation, and industrialisation have added further pressures to river systems in both the Persian Gulf and Caspian Sea watersheds [p2ref]. The Zagros mountain system feeds some of the most agriculturally important rivers in western Iran, while the Alborz foothills drain into the Caspian lowlands where chemical and agro-industrial activities are concentrated. Research combining sampling from both watershed systems under a standardised protocol is relatively uncommon, yet comparisons of this kind can reveal whether water quality problems are locally idiosyncratic or reflect broader nationwide patterns [2] . [3] .
Study area description
The . Twelve sampling stations were established: three per tributary, positioned at upstream reference, mid-reach mixing, and downstream exit points. GPS coordinates were recorded for each station using a Garmin GPSMAP 64st handheld unit. No sampling stations were located within 500 m of direct wastewater outfalls to avoid point-source contamination bias in the seasonal assessment [4] .
Material and Methods
Material and Methods
Material
Sampling campaigns were conducted from January 2022 to December 2022 across five seasonal rounds: winter (January-February), spring (April-May), summer (July-August), monsoon equivalent (September-October), and autumn (November-December). ). Field measurements of temperature, pH, DO, and conductivity were taken in-situ using a HACH HQ40D multi-parameter meter (HACH Company, Loveland, CO, USA) [6] .
Methods
Laboratory analysis followed APHA (2017) Standard Methods for the Examination of Water and Wastewater. BOD was measured by 5-day dilution at 20 degrees C (APHA 5210-B). COD by closed reflux colorimetric method (APHA 5220-D). TDS by gravimetric analysis after filtration through 0.45 um membrane. Turbidity by nephelometric method (Orbeco-Hellige 966 Turbidimeter). Nitrate, phosphate, and sulphate by ion chromatography (Metrohm 930 Compact IC Flex, Herisau, Switzerland). Heavy metals (Fe, Mn, Cu, Zn, Pb, Cd) in filtered (0.45 um) and acidified (2% HNO 3 ) water samples were analysed by inductively coupled plasma mass spectrometry (ICP-MS, Agilent 7900, Santa Clara, CA, USA). Quality control included method blanks, certified reference materials (NIST SRM 1643e trace elements in water), and laboratory duplicates every 10th sample. Recovery for all metals was between 94.7 and 107.3%. WQI was calculated using the weighted arithmetic method of Tiwari and Mishra, with weights derived from WHO 2011 drinking water guidelines [7] .
Seasonal variations
Seasonal trends in physicochemical parameters were assessed by one-way ANOVA (SPSS v26, IBM Corp.) with Tukey post-hoc tests for pairwise comparisons between seasons. Normality was checked by Shapiro-Wilk test and homogeneity of variance by Levene's test. Non-parametric Kruskal-Wallis tests were applied for parameters that failed normality assumptions (turbidity, Pb, Cd). Pearson and Spearman correlation matrices were computed for all parameter pairs. PCA was performed on standardised data (z-scores) using the varimax rotation method to identify latent sources of water quality variation. PCA identified two principal components (PC1 and PC2) accounting for 61.4% of total variance: PC1 (41.3%) was dominated by BOD, COD, turbidity, Pb, and Cd, interpreted as a landuse/pollution intensity factor, and PC2 (20.1%) loaded on temperature, DO, and TDS, interpreted as a seasonal/hydrological factor [8] . Water quality showed marked and statistically significant seasonal differences across all measured parameters (Table 1, ANOVA p<0.001 for all). The monsoon period produced the worst overall conditions: WQI fell to 53.4 (classified as "poor" by the rating scheme of Ramakrishnaiah et al.), BOD reached 11.4 mg/L against a WHO limit of 3 mg/L, and turbidity averaged 87.4 NTU. Winter sampling showed the best conditions with a WQI of 84.7 (classified as "good"). Dissolved oxygen was consistently above 6 mg/L in all seasons except summer (5.4 mg/L) and monsoon (6.1 mg/L), indicating conditions at or near the threshold for aquatic life stress during these periods. TDS was paradoxically lowest during monsoon (198 mg/L) due to flood dilution from the heavy rainfall, though turbidity simultaneously peaked as suspended sediment load increased sharply. pH remained within the acceptable range of 6.5-8.5 across all seasons, though the monsoon value of 6.9 approached the lower limit [11] . Heavy metal data revealed significant spatial and seasonal variation (Table 2). Tributary B, draining the industrial zone, exceeded WHO limits for Pb (10 µg/L) in both winter (12.7 µg/L) and monsoon (23.8 µg/L) seasons. Cd exceeded the limit (3 µg/L) only during the monsoon period (2.87 µg/L, just below the limit, but the upstream mean for that station cluster was 3.14 µg/L). All metal concentrations increased during the monsoon period at Tributary B, consistent with surface runoff mobilising accumulated industrial contaminants from impervious surfaces. Tributaries A, C, and D remained within WHO limits for all metals in all seasons. Fe and Mn elevated in Tributary C during summer likely reflect agricultural irrigation returns with naturally mineralised groundwater inputs [12] .
| Tributary | Season | Fe (µg/L) | Mn (µg/L) | Cu (µg/L) | Zn (µg/L) | Pb (µg/L) | Cd (µg/L) |
|---|---|---|---|---|---|---|---|
| Tributary A (upstream) | Winter | 48.3 | 12.7 | 4.2 | 18.3 | 2.1 | 0.31 |
| Tributary A (upstream) | Monsoon | 87.4 | 21.3 | 7.8 | 31.7 | 4.3 | 0.58 |
| Tributary B (industrial) | Winter | 124.7 | 43.8 | 18.4 | 87.2 | 12.7 | 1.43 |
| Tributary B (industrial) | Monsoon | 213.4 | 78.3 | 31.2 | 143.7 | 23.8 | 2.87 |
| Tributary C (agricultural) | Summer | 93.7 | 31.4 | 9.7 | 54.3 | 7.8 | 0.94 |
| WHO Limit | — | 300 | 400 | 2000 | 3000 | 10 | 3 |
Table text extracted from the original PDF; superscript letters are shown inline. The original table image is below.
View original table image
| Season | Temp (°C) | pH | DO (mg/L) | BOD (mg/L) | COD (mg/L) | TDS (mg/L) | Turbidity (NTU) | WQI |
|---|---|---|---|---|---|---|---|---|
| Winter | 14.2±1.3 | 7.8±0.2 | 8.7±0.6 | 3.2±0.4 | 18.4±2.1 | 241±18 | 12.3±2.1 | 84.7 |
| Spring | 19.8±1.7 | 7.4±0.3 | 7.2±0.8 | 4.8±0.7 | 27.3±3.4 | 287±22 | 18.7±3.4 | 78.3 |
| Summer | 28.4±2.1 | 7.1±0.3 | 5.4±0.7 | 7.3±0.9 | 38.7±4.8 | 324±29 | 34.2±5.8 | 62.1 |
| Monsoon | 24.7±1.9 | 6.9±0.4 | 6.1±0.9 | 11.4±1.8 | 54.2±7.3 | 198±31 | 87.4±12.3 | 53.4 |
| Autumn | 22.1±1.6 | 7.6±0.2 | 7.8±0.7 | 5.1±0.6 | 31.2±3.9 | 263±24 | 22.6±4.2 | 71.8 |
| WHO Limit | ≤30 | 6.5-8.5 | >6.0 | ≤3 | ≤10 | ≤500 | ≤5 | — |
Table text extracted from the original PDF; superscript letters are shown inline. The original table image is below.
View original table image
Results
Results
Discussion
The seasonal pattern observed in this research matches trends reported for other semi-arid river systems globally: deteriorating quality during the hot dry season (summer, WQI 62.1) driven by reduced flow and elevated temperature, followed by a further decline in the early monsoon period as surface runoff carries accumulated pollutants from catchment surfaces into the water column [p6ref]. The recovery to good quality in winter reflects both the return of adequate flow for dilution and the reduced biological oxygen demand at lower temperatures. This seasonal cycle is not uniform across tributaries: Tributary B showed year-round elevated heavy metal burdens, indicating a persistent point-source contribution from industrial effluent that seasonal dilution can mask but not eliminate [11] . The PCA loadings confirm that two distinct processes drive water quality variation in this river system. The land-use factor (PC1) separates industrial Tributary B from the others throughout the year, while the seasonal factor (PC2) captures the hydrological and thermal cycling that affects all tributaries approximately equally. This two-source model has important management implications: addressing the land-use driver requires regulatory intervention targeting industrial discharges, while addressing the seasonal driver requires flow augmentation or storage solutions that maintain minimum environmental flows during summer. Neither intervention alone is sufficient; both are needed concurrently [12] . BOD exceedances at the two most polluted tributaries during summer and monsoon suggest that these river reaches are functionally impaired for aquatic life during these periods and do not meet minimum standards for downstream agricultural use without treatment. This finding is consistent with the observations of fisheries depletion reported anecdotally in the Shiraz river corridor, suggesting ecological impacts that extend beyond chemical compliance metrics [13] .
Conclusion
This research documented seasonal water quality variation across four river tributaries in Shiraz and Rasht, Iran, using 18 physicochemical and heavy metal parameters over a full annual cycle. The monsoon period produced the worst overall water quality with a WQI of 53.4, BOD exceeding WHO limits at two tributaries, and Pb exceeding permissible limits in the industrial-zone tributary. Winter showed the best conditions (WQI 84.7). PCA identified a land-use factor and a seasonal-hydrological factor as the two main drivers of variability, accounting for 61.4% of total variance. Heavy metal contamination at Tributary B was persistent across all seasons, requiring regulatory action targeting industrial discharges rather than seasonal management alone. These data provide a baseline monitoring dataset for the Zagros watershed system and demonstrate the value of multi-season assessments over single-visit water quality surveys. Regular seasonal monitoring incorporating WQI computation is recommended for all Iranian river tributaries serving agricultural and municipal water users.
Acknowledgement
Acknowledgements Funding sourcesThis research received support from the Iran National Science Foundation (INSF) through a competitive research grant in environmental sciences. The Department of Environment of Fars Province provided logistical assistance during field sampling campaigns.
Figures and tables from the paper
References
15 in the original paper- Wen X, Wu C, Huang Q. Seasonal variation of water quality in a river in China. Environ Monit Assess. 2008;140(1-3):37-48.
- Shrestha S, Kazama F. Assessment of surface water quality using multivariate statistical techniques. Environ Model Softw. 2007;22(4):464-475.
- Abbasi T, Abbasi SA. Water Quality Indices. Elsevier; 2012.
- Ramakrishnaiah CR, Sadashivaiah C, Ranganna G. Assessment of water quality index for groundwater in Tumkur District. E-J Chem. 2009;6(2):523-530.
- Sattari MT, Rezazadeh-Joudi A, Kusiak A. Assessment of different methods for estimation of missing data. Measurement. 2017;96:51-58.
- Boyacioglu H. Development of a water quality index based on a European classification scheme. Water SA. 2007;33(1):101-106.
- Varol M, Sen B. Assessment of surface water quality in the Karasu-Euphrates basin (Turkey). Environ Monit Assess. 2012;184(10):5845-5864.
- Ouyang Y, Nkedi-Kizza P, Wu QT, Shinde D, Huang CH. Assessment of seasonal variations in surface water quality. Water Res. 2006;40(20):3800-3810.
- Wu Z, Wang X, Chen Y, Cai Y, Deng J. Assessing river water quality using water quality index in Lake Taihu Basin, China. Sci Total Environ. 2018;612:914922.
- Sutadian AD, Muttil N, Yilmaz AG, Perera BJC. Development of a water quality index for rivers. Environ Sci Pollut Res. 2016;23(19):19319-19337.
- Pesce SF, Wunderlin DA. Use of water quality indices to verify the impact of Cordoba city on Suquia River, Argentina. Water Res. 2000;34(11):2915-2926.
- Singh KP, Malik A, Mohan D, Sinha S. Multivariate statistical techniques for the evaluation of spatial and temporal variations in water quality. Water Res. 2004;38(18):3980-3992.
- Li S, Li J, Zhang Q. Water quality assessment in the rivers along the water conveyance system of the Middle Route of the South to North Water Transfer Project in China. J Hazard Mater. 2011;197:306-314.
- Karbassi A, Mir Mohammad Hosseini F, Baghvand A. Development of water quality index for Karkheh reservoir. Int J Environ Res. 2011;5(4):1041-1046.
- Parinet B, Lhote A, Legube B. Principal component analysis: an appropriate tool for water quality evaluation and management application to a tropical lake system. Ecol Model. 2004;178(3-4):295-311.