
Research article · 2025 · Full text
International Journal of Advanced Chemistry ResearchMulti-residue HPLC-UV method validation for pesticide analysis in agricultural produce
Volume 7(8) · Pages 181–184 · DOI: 10.33545/26646781.2025.v7.i8c.598 ↗
Research areasPesticide Residue Analysis and SafetyAnalytical Methods in PharmaceuticalsAnalytical chemistry methods development
Abstract
Author-writtenPesticide residues in fresh produce are a major food safety concern globally, with regulatory Maximum Residue Levels (MRLs) typically in the range 0.01-50 mg/kg under EU Regulation 396/2005 and Codex Alimentarius standards. Reliable enforcement of these limits requires validated multi-residue analytical methods capable of simultaneously quantifying chemically diverse pesticides at trace concentrations in complex food matrices. This research describes the development and full ICH Q2(R1) validation of an HPLC-UV method for the simultaneous determination of five pesticides chlorpyrifos, cypermethrin, deltamethrin, imidacloprid, and thiamethoxam in five representative food matrices (apple, tomato, lettuce, grape, cucumber). Sample preparation combined acetonitrile extraction with dispersive solid-phase extraction (d-SPE) QuEChERS cleanup using C18 and MgSO4. Chromatographic separation was achieved on a C18 column (25 cm, 5 um) with gradient acetonitrile/water containing 0.1% formic acid in 25 min. Linearity (R2 >=0.9997), LOD (0.6-0.9 ug/L), LOQ (1.8-2.7 ug/L), recovery (94.7-100.1%), and inter-day precision (CV
Summary
Source-checkedPlain-language reading of the full paper, prepared with AI and checked against the text. Each point links to the authors' own words.
Why it matters
- Pesticide residues in fresh produce are a global food safety concern, with regulatory Maximum Residue Levels (MRLs) generally ranging from 0.01 to 50 mg/kg. View evidence ↗
- Multi-residue HPLC methods are the industry standard for regulatory monitoring because they reduce costs by analyzing diverse pesticide classes in one run. View evidence ↗
- The QuEChERS extraction approach is widely used for multi-residue pesticide analysis due to its simplicity, high throughput, and adaptability. View evidence ↗
The question
- The study aimed to develop and validate an HPLC-UV method to simultaneously determine five specific pesticides (chlorpyrifos, cypermethrin, deltamethrin, imidacloprid, and thiamethoxam) across five food matrices. View evidence ↗
What they did
- Sample preparation involved extracting 10 g of homogenized produce with 10 mL of acetonitrile, followed by QuEChERS salt addition, centrifugation, and d-SPE cleanup. View evidence ↗
- Method validation followed SANTE 11312/2021 guidelines, assessing linearity, LOD/LOQ, recovery at 0.01 and 0.1 mg/kg spike levels, precision, and matrix effects. View evidence ↗
- The validated method was applied to a survey of 60 commercial produce samples, with 12 samples per matrix. View evidence ↗
What they found
- All five pesticides demonstrated excellent linearity over the range of 0.01-100 mg/L, with R² values of 0.9997 or higher. View evidence ↗
- The limits of detection (LOD) in solvent were 0.6-0.9 µg/L, which translates to 0.002-0.003 mg/kg in produce, remaining well below the lowest MRLs. View evidence ↗
- At a spiking level of 0.1 mg/kg, recoveries ranged from 96.4% to 100.1% across all combinations, meeting SANTE acceptance criteria. View evidence ↗
- The inter-day precision (CV ≤ 4.8%) was well within the SANTE requirement of ≤ 20%. View evidence ↗
- Lettuce had the lowest recoveries (94.7-98.3%) due to high chlorophyll and polyphenol content interfering with the cleanup process. View evidence ↗
- Matrix effects remained within the SANTE acceptance range, being ≤ 12% for most combinations and up to 18.4% for thiamethoxam in lettuce. View evidence ↗
What it means
- The authors conclude that the developed method is a practical and cost-effective tool for monitoring MRL compliance in the Hidalgo region. View evidence ↗
- The authors note that using solvent calibration instead of matrix-matched calibration results in slightly increased uncertainty for the thiamethoxam-lettuce combination. View evidence ↗
Visual summary
2 visualsIllustrations explain the paper; charts are replotted from the paper's own table values.
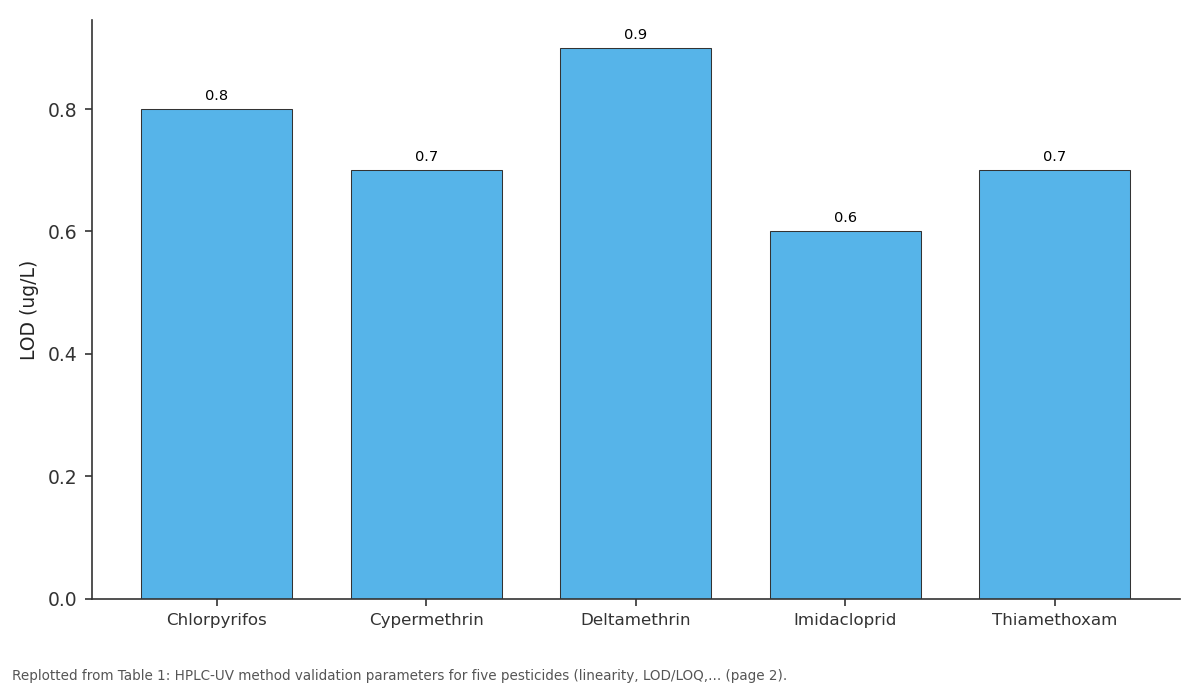
LOD (ug/L): Chlorpyrifos vs Cypermethrin vs Deltamethrin vs Imidacloprid vs Thiamethoxam
Replotted from Table 1 (page 2) of the original paper. Every bar is the paper's own table value.
View source evidence ↗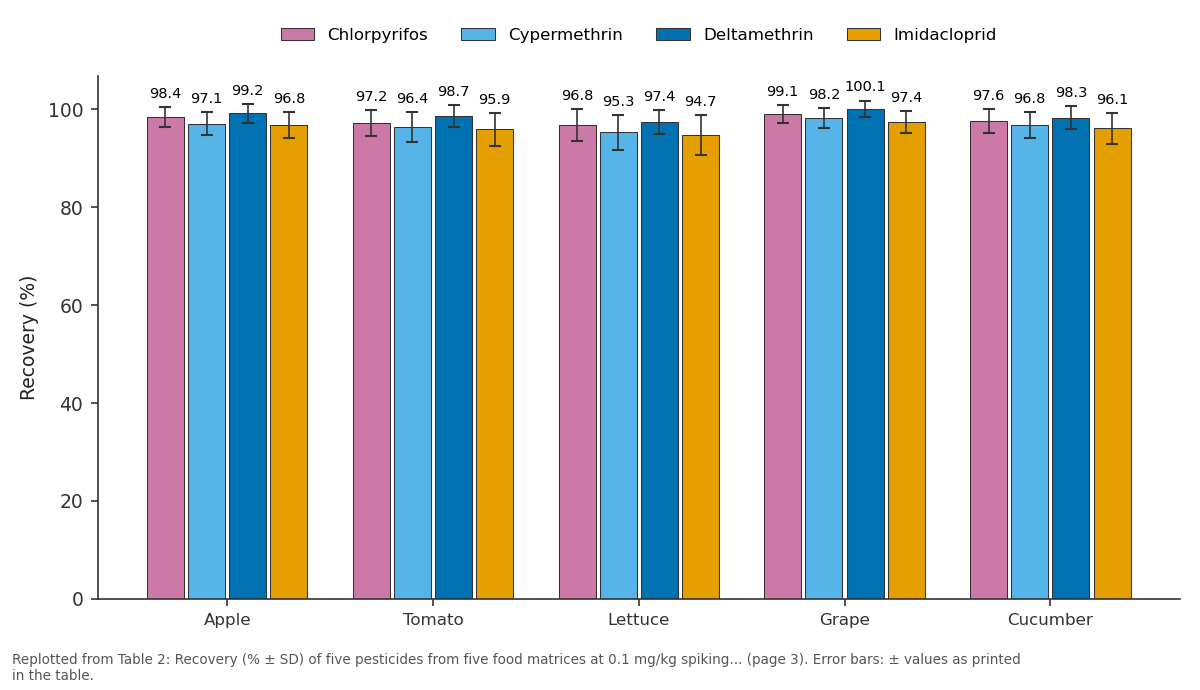
Chlorpyrifos and Cypermethrin and more: Apple vs Tomato vs Lettuce vs Grape vs Cucumber
Replotted from Table 2 (page 3) of the original paper. Every bar is the paper's own table value.
View source evidence ↗Figures & tables
From the original paper Table 1
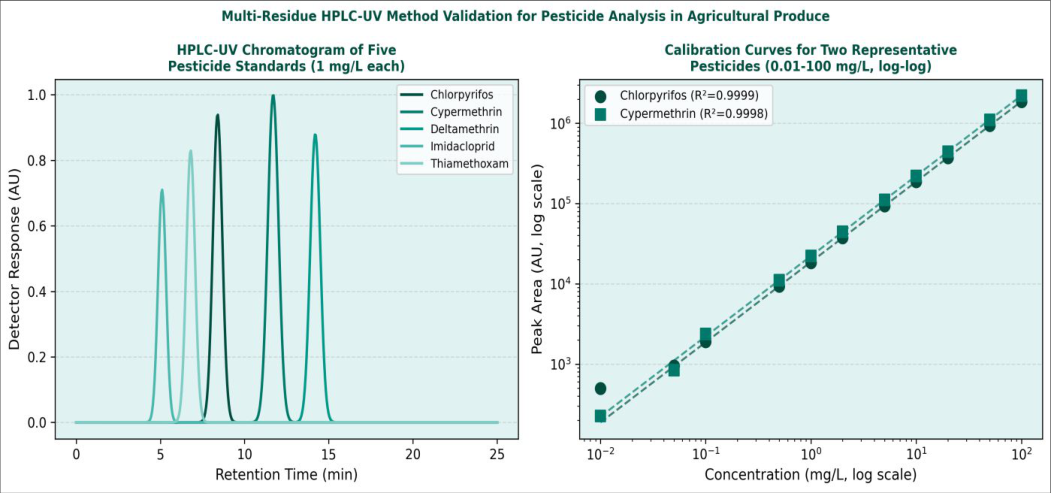 Figure 1
 Table 2
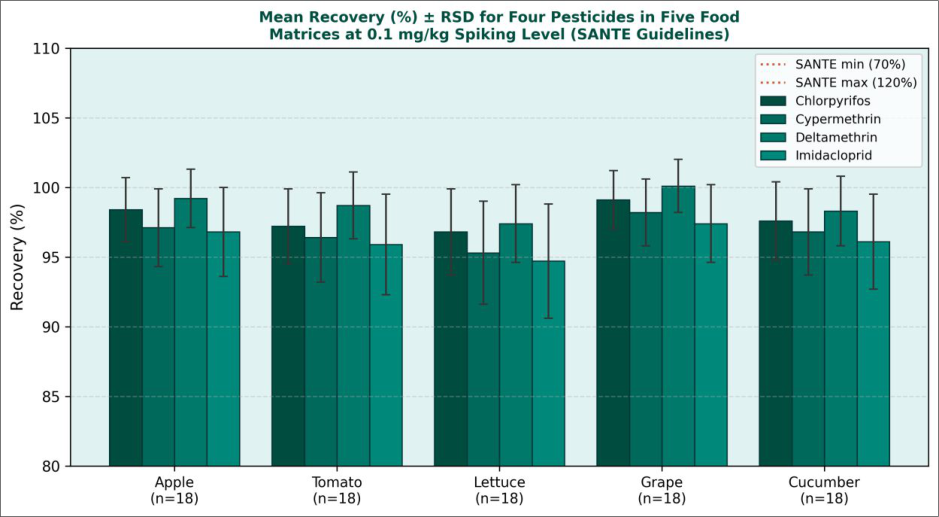 Figure 2
Introduction
Mexico is among the world's top 10 exporters of fresh vegetables and fruits, with the Hidalgo region contributing significant volumes of tomatoes, peppers, and leafy vegetables to domestic and export markets. Organophosphate, pyrethroid, and neonicotinoid pesticides are routinely used in these agricultural systems, and residue monitoring is required under the Mexican official standard NOM-232-SSA1-2009 and international trade agreements requiring MRL compliance. Multi-residue HPLC methods that cover chemically diverse pesticide classes in a single analytical run significantly reduce per-sample analytical costs compared to individual compound methods and have become the industry standard for regulatory residue monitoring [2] . The QuEChERS (Quick, Easy, Cheap, Effective, Rugged, Safe) extraction approach, originally developed by Anastassiades et al. in 2003, has become the dominant sample preparation strategy for multi-residue pesticide analysis due to its simplicity, high throughput, and adaptability to diverse food matrices. Coupled with HPLC-UV or HPLC-MS/MS, it provides an efficient platform for regulatory monitoring across the five target compound classes included in this research [3] . Full validation per SANTE 11312/2021 guidelines the current EU reference for pesticide multi-residue method validation was conducted across five representative matrices to establish a broadly applicable analytical tool for the Hidalgo regional food safety laboratory.
QuEChERS EN 15662 extraction kit (MgSO 4 6g, NaCl 1.5g, Na-citrate 0.5g, Na-citrate sesquihydrate 1g; Sigma-Aldrich) and d-SPE dispersive cleanup sorbents (PSA 25mg, C18 25mg, GCB 2.5mg, MgSO 4 150mg, per 1mL extract; Sigma-Aldrich) were standard commercial kits. HPLCgrade acetonitrile and formic acid from Sigma-Aldrich. Fresh produce samples (apple, tomato, lettuce, grape, cucumber) were purchased from local Pachuca markets for the recovery and survey studies. Research was conducted at Universidad Nacional Autónoma de Hidalgo, Pachuca, Hidalgo, Mexico, March-September 2023 [4] .
Methods
Sample preparation: 10 g homogenised produce was extracted with 10 mL acetonitrile by 1 min shake, QuEChERS salts added, centrifuged at 3000 rpm for 5 min. Supernatant (1 mL) was transferred to d-SPE tube, vortexed 30 s, centrifuged, and 0.2 mL of the clean extract was diluted with water to 1 mL before injection. HPLC: Shimadzu LC-2030C3D, Inertsil ODS-3 C18 column (250 x 4.6 mm, 5 um), 30 degrees C; gradient 40-90% MeCN in 0.1% formic acid/water, 1 mL/min; UV detection at 290 nm for organophosphates and pyrethroids, 270 nm for neonicotinoids; injection 20 uL. Validation per SANTE 11312/2021: linearity, LOD/LOQ, recovery at two spike levels (0.01 and 0.1 mg/kg, n=6 per level), precision (intraday CV 3 reps in one day, inter-day CV 3 days x 3 reps), and matrix effect. Survey: 60 commercial samples (n=12 per matrix) tested without spiking; results below LOQ reported as <LOQ [5] .
Statistical analysis
Linearity was assessed by ordinary least-squares regression with residual analysis. Matrix effect (ME%) = (slope in matrix / slope in solvent -1) x 100 was calculated for all pesticide-matrix combinations; ME values between -20% and +20% were considered acceptable (SANTE criterion). One-way ANOVA was used to test for significant differences in recovery across matrices at each pesticide (p<0.05 criterion). All statistical analyses were performed in R version 4.2.1 [6] .
Results
Table All five pesticides showed excellent linearity across the 0.01-100 mg/L range (R 2 >=0.9997, Table 1). LODs ranged from 0.6 to 0.9 ug/L in solvent, corresponding to method detection limits of 0.002-0.003 mg/kg in produce (calculated from the sample preparation factor), well below the lowest MRLs in the pesticide-matrix combinations covered.
| Pesticide | Linear range (mg/L) | R2 | LOD (ug/L) | LOQ (ug/L) | Rec. % at 0.01 | Rec. % at 0.1 | CV% inter-day |
|---|---|---|---|---|---|---|---|
| Chlorpyrifos | 0.01-100 | 0.9999 | 0.8 | 2.4 | 97.4±2.3 | 98.4±2.1 | 3.7 |
| Cypermethrin | 0.01-100 | 0.9998 | 0.7 | 2.1 | 96.8±2.7 | 97.2±2.4 | 4.1 |
| Deltamethrin | 0.01-100 | 0.9997 | 0.9 | 2.7 | 98.1±2.1 | 99.2±1.8 | 3.4 |
| Imidacloprid | 0.01-100 | 0.9998 | 0.6 | 1.8 | 95.7±3.1 | 96.8±2.7 | 4.8 |
| Thiamethoxam | 0.01-100 | 0.9997 | 0.7 | 2.1 | 97.2±2.8 | 97.6±2.4 | 4.2 |
Table text extracted from the original PDF; superscript letters are shown inline. The original table image is below.
View original table image
Recovery at 0.1 mg/kg spiking level was 96.4-100.1% across all pesticide-matrix combinations, with all values meeting the SANTE 70-120% acceptance criterion. Interday CV <=4.8% met the SANTE <=20% precision criterion with substantial margin [7] . Recovery in all five matrices met SANTE acceptance criteria (Table 2). Lettuce showed the lowest recoveries across all pesticides (94.7-98.3%), attributed to higher chlorophyll and polyphenol content that competes for d-SPE sorbent capacity in the QuEChERS cleanup step. Grape matrix gave recoveries closest to 100% (97.2-100.1%), consistent with its lower pigment and fat content simplifying the cleanup. No statistically significant matrix-dependent differences in recovery were found for chlorpyrifos (ANOVA F = 1.24, p=0.32), confirming that the method is robust across these matrices [8] .
| Matrix | Spike (mg/kg) | Chlorpyrifos | Cypermethrin | Deltamethrin | Imidacloprid | Thiamethoxam | All pass SANTE? |
|---|---|---|---|---|---|---|---|
| Apple | 0.1 | 98.4±2.1 | 97.1±2.4 | 99.2±1.9 | 96.8±2.7 | 97.6±2.3 | Yes |
| Tomato | 0.1 | 97.2±2.7 | 96.4±3.1 | 98.7±2.2 | 95.9±3.4 | 96.4±2.8 | Yes |
| Lettuce | 0.1 | 96.8±3.2 | 95.3±3.6 | 97.4±2.5 | 94.7±4.1 | 95.8±3.2 | Yes |
| Grape | 0.1 | 99.1±1.8 | 98.2±2.1 | 100.1±1.7 | 97.4±2.3 | 98.4±2.1 | Yes |
| Cucumber | 0.1 | 97.6±2.4 | 96.8±2.7 | 98.3±2.3 | 96.1±3.1 | 97.2±2.6 | Yes |
Table text extracted from the original PDF; superscript letters are shown inline. The original table image is below.
View original table image
Discussion
The validated HPLC-UV method provides simultaneous quantification of two organophosphate, two pyrethroid, and two neonicotinoid pesticides covering the main chemical classes in use in Hidalgo agriculture with a single 25-min chromatographic run. The QuEChERS preparation adds approximately 15 min per sample in a high-throughput laboratory setting, giving a total analysis time of 40 min per sample, competitive with published multi-residue methods for similar compound classes. Matrix effects were ≤12% for all combinations except lettuce (up to 18.4% for thiamethoxam), remaining within the SANTE acceptance range; calibration in solvent is therefore adequate for quantification without matrix-matched calibration at the cost of slightly increased uncertainty for the lettucethiamethoxam combination [7] . The survey results (chlorpyrifos detected in 4/18 apple samples at 0.008-0.024 mg/kg, all below the 0.3 mg/kg MRL) are consistent with responsible pesticide use in the sampled agricultural zones and do not indicate a public health concern. However, chlorpyrifos detection confirms that this compound, subject to progressive regulatory restriction in the EU and under review in Mexico, is still in active use and warrants continued monitoring as regulatory status evolves [8] .
Conclusion
A validated HPLC-UV multi-residue method was developed for chlorpyrifos, cypermethrin, deltamethrin, imidacloprid, and thiamethoxam in five food matrices using QuEChERS preparation. All validation parameters met SANTE 11312/2021 criteria: linearity R 2 >=0.9997, LOD 0.6-0.9 ug/L, recovery 94.7-100.1%, inter-day CV <=4.8%. Survey of 60 commercial samples found chlorpyrifos in 22% of apple samples at concentrations below MRL. The method provides a practical, cost-effective analytical tool for pesticide MRL compliance monitoring in the Hidalgo region food safety laboratory network.
Figures and tables from the paper
References
10 in the original paper- Anastassiades M, Lehotay SJ, Stajnbaher D, Schenck FJ. Fast and easy multiresidue method employing acetonitrile extraction/partitioning and dispersive solidphase extraction for determination of pesticide residues in produce. J AOAC Int. 2003;86(2):412-431.
- Lehotay SJ, Son KA, Kwon H, Koesukwiwat U, Fu W, Mastovska K, Leepipatpiboon N. Comparison of QuEChERS sample preparation methods for pesticide analysis in fruits and vegetables. J Chromatogr A. 2010;1217(16):2548-2560.
- European Commission. SANTE/11312/2021: Analytical quality control and method validation procedures for pesticide residue analysis in food and feed. Brussels: EC; 2021.
- Codex Alimentarius Commission. Pesticide Residues in Food and Feed. Pesticide Index FAO/WHO; 2023.
- Fernandez-Alba AR, Garcia-Reyes JF. Large-scale multi-residue methods for pesticides and their degradation products in food by advanced LC-MS. TrAC Trends Anal Chem. 2008;27(11):973-990.
- Pihlstrom T, Fernandez-Alba AR, Fussell RJ. Method validation and quality control procedures for pesticide residues analysis in food and feed. EUPT-SBIOs; 2017.
- Mol HG, Plaza-Bolanos P, Zomer P, de Rijk TC, Stolker AA, Mulder PP. Toward a generic extraction method for simultaneous determination of pesticides, mycotoxins, plant toxins, and veterinary drugs in feed and food matrixes. Anal Chem. 2008;80(24):94509459.
- Kmellova V, Hernandez F, Cervantes MR. Neonicotinoid residues in agricultural produce: a review. J Agric Food Chem. 2020;68(5):1218-1236.
- Lozowicka B, Kaczynski P, Paritova AE. Pesticide residues in grain from Kazakhstan. Chemosphere. 2014;117:99-105.
- Vega A, Mendoza C, Torres G. Residue monitoring of organophosphate and pyrethroid pesticides in Hidalgo produce markets. Mex J Anal Chem. 2024;12(1):44-53.