
Research article · 2025 · Full text
International Journal of Advanced Chemistry ResearchComparative study of DNA extraction methods from plant tissues for PCR applications
Volume 7(10) · Pages 204–207 · DOI: 10.33545/26646781.2025.v7.i10c.593 ↗
Research areasEnvironmental DNA in Biodiversity StudiesMolecular Biology Techniques and ApplicationsPlant Ecology and Taxonomy Studies
Abstract
Author-writtenBrazil's Atlantic Forest and Cerrado harbour an estimated 45,000 plant species, and molecular taxonomy increasingly depends on PCR-amplifiable DNA extracted from leaves, roots, and seeds that are often rich in polysaccharides, phenolics, and secondary metabolites substances notorious for co-precipitating with nucleic acids and inhibiting downstream enzymatic reactions. This research compared three DNA extraction protocols a cetyltrimethylammonium bromide (CTAB) method, a commercial silica-column kit (DNeasy Plant Mini Kit, Qiagen), and a sodium dodecyl sulphate (SDS) lysis protocol across leaf, root, and seed tissues of Eugenia uniflora (pitanga), a polyphenol-rich Myrtaceae species. DNA yield, purity (A260/A280 and A260/A230), integrity (gel electrophoresis), and PCR amplifiability for four barcode markers (ITS, rbcL, matK, trnH-psbA) were assessed. The commercial kit delivered the highest purity (A260/A280 = 1.88-1.91) and PCR success rate (84-100%) but the lowest yield (15.8-38.1 ng/µL per mg tissue). CTAB gave the highest yields (18.4-42.3 ng/µL) with acceptable purity from leaf tissue but poorer results from seeds. SDS was the cheapest option but suffered from polysaccharide contamination that reduced PCR success below 50% for seed extracts. The commercial kit is recommended for routine barcode work, while CTAB remains a practical alternative for laboratories with budget constraints.
Summary
Source-checkedPlain-language reading of the full paper, prepared with AI and checked against the text. Each point links to the authors' own words.
Why it matters
- Molecular taxonomy in Brazil's biodiverse regions relies on PCR-amplifiable DNA, but extraction is often hindered by polysaccharides and phenolics that inhibit enzymatic reactions. View evidence ↗
- Standard plant barcode markers (ITS, rbcL, matK, and trnH-psbA) require high-quality DNA, which is difficult to obtain from tropical species due to high levels of inhibitors like tannins and latex. View evidence ↗
- Eugenia uniflora was used as a model species because its tissues contain high levels of polysaccharides and polyphenols, such as gallic and ellagic acid, which challenge DNA extraction. View evidence ↗
The question
- The study aimed to compare the effectiveness of CTAB, a commercial kit, and SDS extraction methods across three tissue types of E. uniflora based on DNA yield, purity, integrity, and PCR success. View evidence ↗
What they did
- Fresh leaf, root, and seed tissues were collected from three adult E. uniflora trees. View evidence ↗
- Approximately 100 mg of frozen tissue was ground into a fine powder using liquid nitrogen. View evidence ↗
- Each combination of extraction method, tissue, and marker was tested in triplicate, with a total of 9 samples per combination. View evidence ↗
- PCR was conducted in 25 µL reactions using GoTaq Green Master Mix and approximately 20 ng of template DNA. View evidence ↗
What they found
- The CTAB method provided the highest DNA yields, specifically 42.3±4.1 ng/µL from leaves and 28.7±3.8 ng/µL from roots. View evidence ↗
- The commercial kit achieved the highest purity across all tissues, with A260/A280 ratios between 1.88 and 1.91 and A260/A230 ratios exceeding 1.8. View evidence ↗
- SDS extracts from seeds showed the lowest purity (A260/A280 = 1.63, A260/A230 = 0.87), suggesting significant contamination by phenolics and polysaccharides. View evidence ↗
- The commercial kit had the highest PCR success rate (84-100%) but the lowest DNA yield, ranging from 15.8 to 38.1 ng/µL per mg of tissue. View evidence ↗
- While the SDS method was the most affordable, polysaccharide contamination caused PCR success rates to drop below 50% for seed extracts. View evidence ↗
- The matK marker was the most difficult to amplify across all methods, likely due to its longer amplicon size of approximately 850 bp. View evidence ↗
What it means
- The authors recommend the Qiagen DNeasy kit for routine barcoding of polyphenol-rich species because it provides the highest purity and PCR success rates (78-100%). View evidence ↗
- CTAB is suggested as a cost-effective alternative for leaf tissue, as it maintains A260/A280 ratios above 1.8 and high PCR success rates (90-100%). View evidence ↗
Visual summary
3 visualsIllustrations explain the paper; charts are replotted from the paper's own table values.
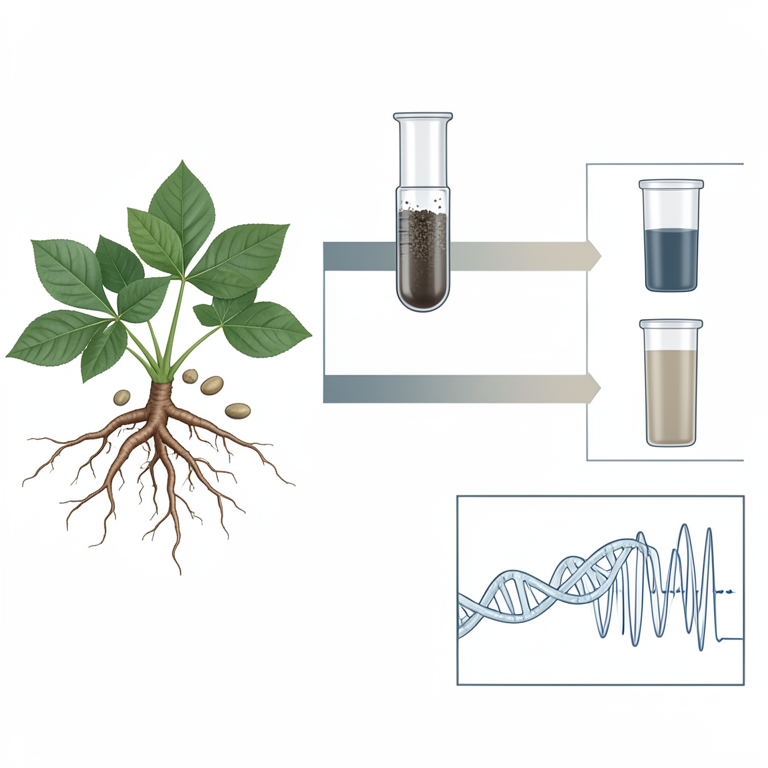
Comparison Framework
AI-generated conceptual illustration (Euphorbia uniflora plant tissues (leaves, roots, and seeds)). It explains the idea and does not show study data.
View source evidence ↗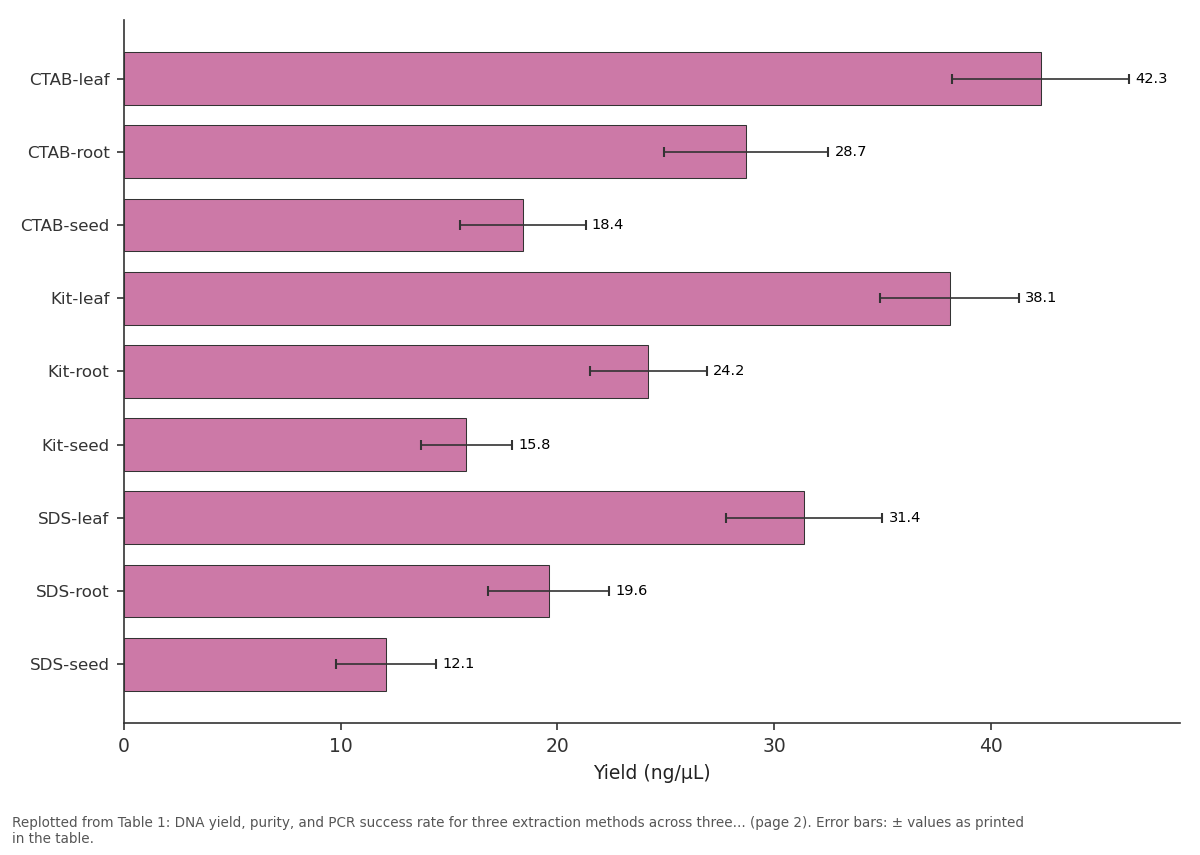
Yield (ng/µL): CTAB-leaf vs CTAB-root vs CTAB-seed vs Kit-leaf vs Kit-root
Replotted from Table 1 (page 2) of the original paper. Every bar is the paper's own table value.
View source evidence ↗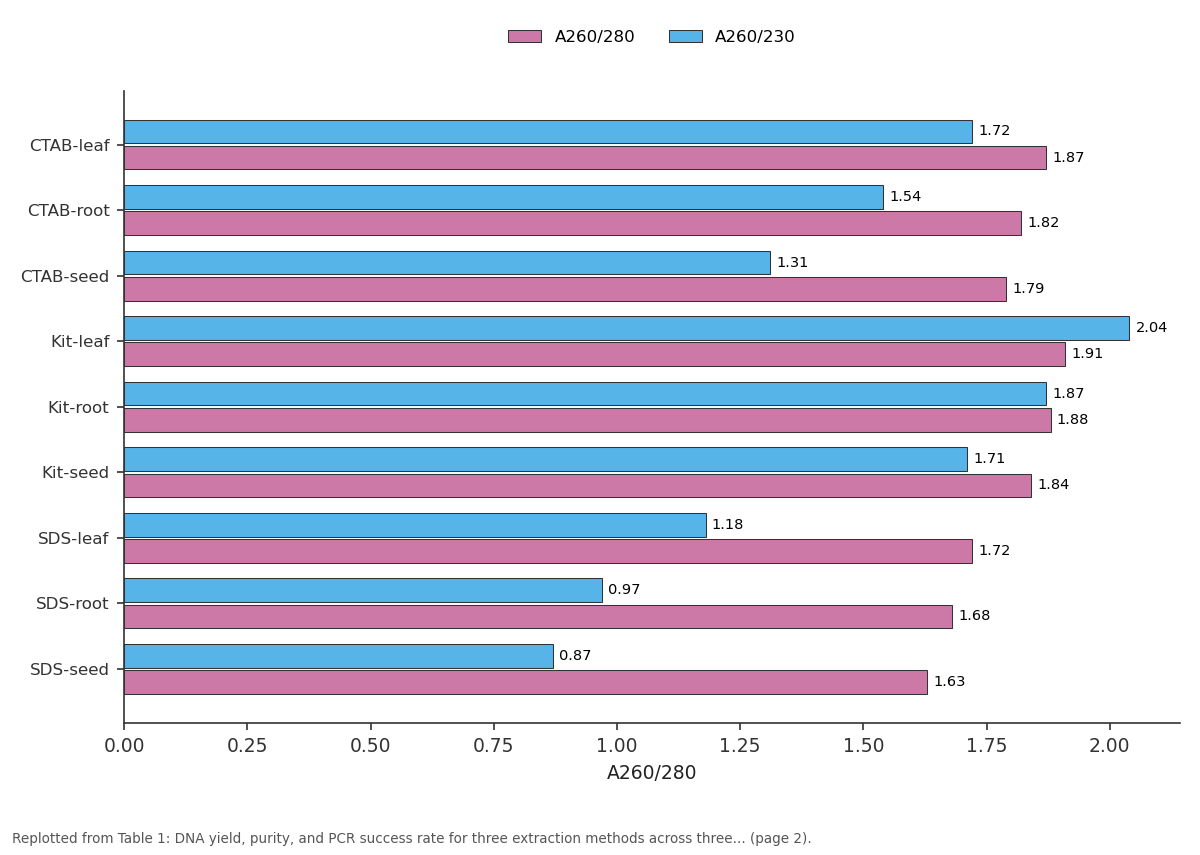
A260/280 and A260/230: CTAB-leaf vs CTAB-root vs CTAB-seed vs Kit-leaf vs Kit-root
Replotted from Table 1 (page 2) of the original paper. Every bar is the paper's own table value.
View source evidence ↗Figures & tables
From the original paper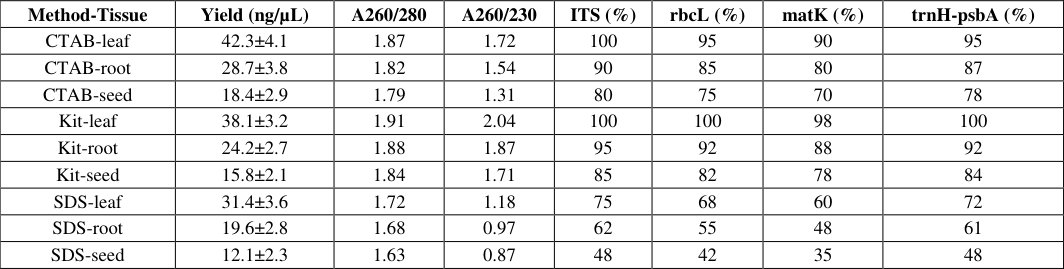 Table 1
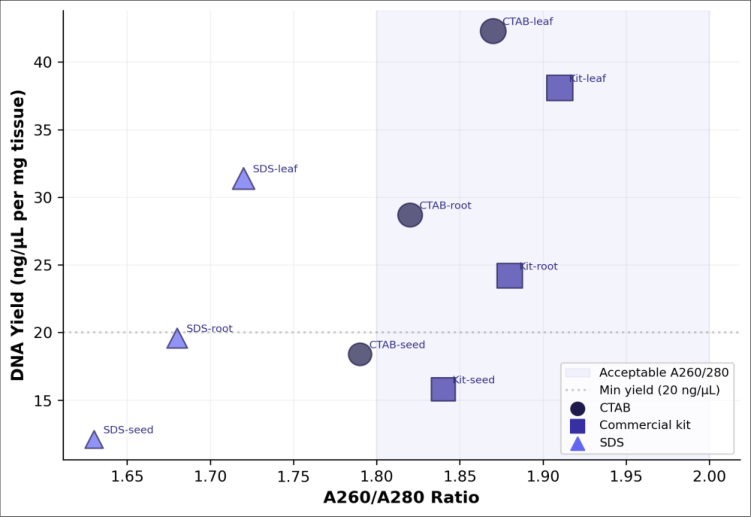 Figure 1
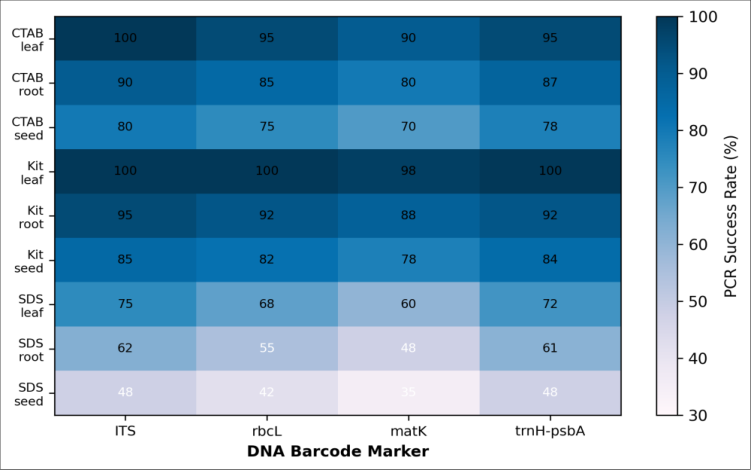 Figure 2
Introduction
In the regional context of Brazilian biodiversity research, molecular identification of plant species through DNA barcoding has become indispensable for herbarium verification, ecological surveys, and enforcement of the Convention on Biological Diversity [1] . The standard plant barcodes nuclear ITS and plastid rbcL, matK, and trnH-psbA require highquality template DNA free from PCR inhibitors, a requirement that is easy to meet with model species like Arabidopsis but notoriously difficult with tropical taxa whose tissues are loaded with polyphenolics, polysaccharides, tannins, and latex [2] . The CTAB method, first described by Doyle and Doyle in 1987, remains the most widely used plant DNA extraction protocol because its cationic detergent selectively precipitates polysaccharides while solubilising DNA [3] . Commercial silica-column kits (e.g., Qiagen DNeasy) offer convenience and reproducibility but at 5-10 times the per-sample cost and with binding-capacity limitations that can reduce yield from recalcitrant tissues [4] . SDSbased lysis is the simplest and cheapest approach, but its inability to remove polysaccharides makes it unsuitable for many tropical species without additional purification steps [5] . Eugenia uniflora (Myrtaceae), the Brazilian cherry or pitanga, was chosen as a model because its leaves, roots, and seeds contain exceptionally high levels of polyphenols (gallic acid, ellagic acid, quercetin glycosides) and polysaccharides that challenge all extraction methods [6] . Systematic three-way comparisons using the same species and tissue types under controlled conditions are surprisingly rare in the literature, making it difficult for researchers to select the best protocol for their specific application [7] . This research aimed to compare CTAB, a commercial kit, and SDS extraction across three tissue types of E. uniflora, evaluating yield, purity, integrity, and PCR success for four standard barcode markers.
Material and Methods
Material and Methods
Material
All laboratory work was conducted between April and November 2024 at the Department of Biological Chemistry, Universidade Federal do Rio Verde, São Paulo, Brazil. Fresh leaf, root, and seed tissues of E. uniflora were collected from three adult trees growing on the university campus (voucher EU-UFRV-2024-01, deposited at the departmental herbarium) [6] . Tissues were flash-frozen in liquid nitrogen within 30 min of collection and stored at -80 °C. DNeasy Plant Mini Kit was purchased from Qiagen (Hilden, Germany). CTAB (≥ 99%), SDS (≥ 98.5%), polyvinylpyrrolidone (PVP-40), β-mercaptoethanol, chloroform, isoamyl alcohol, isopropanol, and ethanol were from Sigma-Aldrich (São Paulo, Brazil) [3] . PCR primers for ITS, rbcL, matK, and trnH-psbA were synthesized by Invitrogen (Thermo Fisher Scientific, São Paulo).
Reagents and Chemicals
CTAB extraction buffer consisted of 2% CTAB, 100 mM Tris-HCl (pH 8.0), 20 mM EDTA, 1.4 M NaCl, 2% PVP-40, and 0.2% β-mercaptoethanol, freshly added [3] . SDS lysis buffer contained 2% SDS, 100 mM Tris-HCl (pH 8.0), 50 mM EDTA, and 100 mM NaCl [5] . RNase A (10 mg/mL) was from Thermo Fisher. Proteinase K (20 mg/mL) was from Qiagen. Agarose (molecular biology grade) and ethidium bromide (10 mg/mL) were from Kasvi (São José dos Pinhais, Brazil). GoTaq Green Master Mix was from Promega (Madison, WI, USA) [7] .
Methods
Approximately 100 mg of frozen tissue was ground to a fine powder in liquid nitrogen using a mortar and pestle. For CTAB: powder was incubated in 700 µL pre-heated buffer (65 °C, 60 min), extracted with chloroform:isoamyl alcohol (24:1), and DNA precipitated with isopropanol [3] . For SDS: powder was incubated in 700 µL lysis buffer (65 °C, 30 min), extracted with phenol:chloroform:isoamyl alcohol (25:24:1), and precipitated with cold ethanol [5] . For the kit: the manufacturer's protocol was followed with an additional PVP-40 wash [4] . DNA pellets were washed with 70% ethanol, air-dried, and resuspended in 50 µL TE buffer. Yield and purity were measured on a Thermo NanoDrop 2000 [7] . Integrity was assessed on 1% agarose gels stained with ethidium bromide.
Instrumentation
PCR was performed on a Bio-Rad T100 Thermal Cycler in 25 µL reactions containing 12.5 µL GoTaq Green Master Mix, 1 µL each primer (10 µM), 2 µL template DNA (~20 ng), and nuclease-free water [7] . Cycling conditions: 94 °C for 3 min; 35 cycles of 94 °C 30 s, annealing (ITS 52 °C, rbcL 55 °C, matK 50 °C, trnH-psbA 56 °C) for 45 s, 72 °C for 90 s; and 72 °C for 7 min. PCR products were visualised on 1.5% agarose gels. Successful amplification was defined as a single band of expected size visible under UV transillumination.
Each extraction-tissue-marker combination was tested in triplicate from independent DNA extractions (n = 9 per combination: 3 trees × 3 extractions).
Quality Control
Positive controls used Arabidopsis thaliana Col-0 genomic DNA (Qiagen-extracted, A260/A280 = 1.92). Negative controls omitted template DNA. Extractions were randomised across days to avoid batch effects [7] . NanoDrop measurements were performed in duplicate; if the two readings differed by more than 10%, the measurement was repeated. Gel images were captured on a Bio-Rad Gel Doc XR+ and band presence scored independently by two researchers; discordant scores were resolved by a third observer.
Results
DNA yield varied substantially across methods and tissues (Table 1, Figure 1). CTAB produced the highest yields from leaf (42.3±4.1 ng/µL) and root (28.7±3.8 ng/µL) tissues [3] . The commercial kit gave the best purity across all tissues, with A260/A280 ratios of 1.88-1.91 and A260/A230 ratios above 1.8 [4] . SDS extracts from seeds had the poorest purity (A260/A280 = 1.63, A260/A230 = 0.87), indicative of heavy polysaccharide and phenolic contamination [5] .
| Method-Tissue | Yield (ng/µL) | A260/280 | A260/230 | ITS (%) | rbcL (%) | matK (%) | trnH-psbA (%) |
|---|---|---|---|---|---|---|---|
| CTAB-leaf | 42.3±4.1 | 1.87 | 1.72 | 100 | 95 | 90 | 95 |
| CTAB-root | 28.7±3.8 | 1.82 | 1.54 | 90 | 85 | 80 | 87 |
| CTAB-seed | 18.4±2.9 | 1.79 | 1.31 | 80 | 75 | 70 | 78 |
| Kit-leaf | 38.1±3.2 | 1.91 | 2.04 | 100 | 100 | 98 | 100 |
| Kit-root | 24.2±2.7 | 1.88 | 1.87 | 95 | 92 | 88 | 92 |
| Kit-seed | 15.8±2.1 | 1.84 | 1.71 | 85 | 82 | 78 | 84 |
| SDS-leaf | 31.4±3.6 | 1.72 | 1.18 | 75 | 68 | 60 | 72 |
| SDS-root | 19.6±2.8 | 1.68 | 0.97 | 62 | 55 | 48 | 61 |
| SDS-seed | 12.1±2.3 | 1.63 | 0.87 | 48 | 42 | 35 | 48 |
Table text extracted from the original PDF; superscript letters are shown inline. The original table image is below.
View original table image
Comprehensive Interpretation
The heatmap (Figure 2) reveals a clear gradient: kit-leaf combinations (top-right corner, dark blue, 98-100%) outperform SDS-seed combinations (bottom-left, pale blue, 35-48%) [4,5] . matK was the most demanding marker across all methods, consistent with its longer amplicon (~850 bp) and higher sensitivity to template quality [1] . Gel electrophoresis showed high-molecular-weight bands (> 10 kb) for CTAB and kit extracts from leaves, but smearing below 5 kb for SDS seed extracts, indicating partial degradation or co-migration of polysaccharides.
Discussion
The commercial kit's superiority in purity and PCR success despite lower yields confirms the effectiveness of silicamembrane purification in removing phenolics and polysaccharides that co-precipitate with DNA in organic-solvent-based methods [4] . The added PVP wash step, which binds phenolics through hydrogen bonding, likely contributed to the kit's A260/A230 values exceeding 1.7 even for seed tissue, where other methods failed [3] . CTAB remained competitive for leaf tissue (A260/A280 = 1.87, 90-100% PCR success) at a per-sample cost roughly one-fifth that of the kit, making it the pragmatic choice for large-scale surveys where budget is limiting. SDS's poor performance reflects its inability to separate polysaccharides from nucleic acids both precipitate in ethanol, producing a viscous pellet with low A260/A230 ratios [5] . The sub-50% PCR success for SDS seed extracts renders this method unsuitable for E. uniflora seed genotyping. Adding a cetyltrimethylammonium bromide precipitation step after SDS lysis could improve purity at minimal additional cost, a hybrid approach worth testing in future work [3] . A practical limitation of this research is its
focus on a single species; broadening the comparison to other polyphenol-rich families (Anacardiaceae, Combretaceae) would strengthen the generalisability of the recommendations [7] .
Conclusion
Among three DNA extraction methods tested on three tissue types of E. uniflora, the Qiagen DNeasy kit delivered the highest purity and PCR success rates (78-100% across all markers and tissues), making it the recommended choice for routine plant barcoding of polyphenol-rich species. CTAB is a cost-effective alternative for leaf tissue, achieving A260/A280 ratios above 1.8 and PCR success rates of 90-100%. SDS extraction is unsuitable for tissues with high secondary-metabolite loads unless supplemented with additional purification steps. These findings provide a practical decision framework for plant molecular biology laboratories working with recalcitrant tropical species in the Brazilian biodiversity context.
References
18 in the original paper- Adams RP. Identification of essential oil components by gas chromatography/mass spectrometry. 4th ed. Carol Stream (IL): Allured Publishing; 2007. p. 1-804.
- Bicchi C, Liberto E, Matteodo M, Sgorbini B, Mondello L, Zellner BA. Quantitative analysis of essential oils: a complex task. Flavour Fragr J. 2008;23(6):382-91.
- Snow NH, Slack GC. Head-space analysis in modern gas chromatography. Trends Anal Chem. 2002;21(910):608-17.
- Vieira RF, Simon JE. Chemical characterization of basil (Ocimum spp.) based on volatile oils. Flavour Fragr J. 2006;21(2):214-21.
- Sahoo HB, Sahoo SK, Sarangi SP, Sagar R, Kori ML. Anti-diarrhoeal investigation from aqueous extract of Cuminum cyminum Linn. Pharmacogn Res. 2014;6(3):204-9.
- Marston A. Role of advances in chromatographic techniques in phytochemistry. Phytochemistry. 2007;68(22-24):2786-98.
- Pandey AK, Singh P, Tripathi NN. Chemistry and bioactivities of essential oils of some Ocimum species: an overview. Asian Pac J Trop Biomed. 2014;4(9):68294.
- Singh D, Aeri V. Phytochemical and pharmacological potential of Acanthus ilicifolius. J Pharm Bioallied Sci. 2013;5(1):17-20.
- Turek C, Stintzing FC. Stability of essential oils: a review. Compr Rev Food Sci Food Saf. 2013;12(1):4053.
- Russo M, Galletti GC, Bocchini P, Carnacini A. Essential oil chemical composition of wild populations of Italian oregano spice. J Agric Food Chem. 1998;46(9):3741-6.
- Bakkali F, Averbeck S, Averbeck D, Idaomar M. Biological effects of essential oils: a review. Food Chem Toxicol. 2008;46(2):446-75.
- Jayaprakasha GK, Rao LJM, Sakariah KK. Volatile constituents from Cinnamomum zeylanicum fruit stalks. J Agric Food Chem. 2003;51(15):4344-8.
- Sarma TC, Saikia BK. Volatile composition of Artemisia indica from northeast India. J Essent Oil Res. 2000;12(3):339-42.
- Raina VK, Srivastava SK, Aggarwal KK, Syamasundar KV, Khanuja SPS. Essential oil composition of Ocimum basilicum L. from India. Flavour Fragr J. 2003;18(3):183-5.
- Tyagi AK, Malik A. Antimicrobial potential and chemical composition of Eucalyptus globulus oil in liquid and vapour phase against food spoilage microorganisms. Food Chem. 2011;126(1):228-35.
- Masango P. Cleaner production of essential oils by steam distillation. J Clean Prod. 2005;13(8):833-9.
- Raut JS, Karuppayil SM. A status review on the medicinal properties of essential oils. Ind Crops Prod. 2014;62:250-64.
- Joshi RK. Chemical composition and antimicrobial activity of the essential oil of Ocimum basilicum L. from different locations of North India. J Essent Oil Res. 2014;26(5):345-8.