
Research article · 2025 · Full text
International Journal of Advanced Chemistry ResearchMineral content and heavy metal analysis of commonly consumed spices
Volume 7(5) · Pages 137–139 · DOI: 10.33545/26646781.2025.v7.i5b.496 ↗
Research areasHeavy Metals in PlantsHeavy metals in environmentFood and Agricultural Sciences
Abstract
Author-writtenSpices are consumed daily in small quantities but may represent a disproportionate source of dietary heavy metal exposure due to soil contamination, adulteration, or post-harvest processing with metallic equipment. This research quantified essential minerals (Ca, Mg, Fe, Zn, Mn, Cu) and toxic heavy metals (Pb, Cd, As, Hg) in ten commonly consumed Indian spices by inductively coupled plasma mass spectrometry (ICP-MS) following microwave-assisted acid digestion. All samples were purchased from retail markets in Patna, Bihar, across three separate procurement events (July 2022 to March 2024). Pb concentrations ranged from 0.39 (cloves) to 1.34 mg/kg (turmeric), with all samples below the EU MRL of 2.0 mg/kg for spices. Cd ranged from 0.05 to 0.23 mg/kg; turmeric again recorded the highest Cd value (0.23 mg/kg), approaching but not exceeding the EU MRL of 0.20 mg/kg for a subset. Essential mineral content was highest in cumin (Ca 1,243 mg/kg, Mg 931 mg/kg) and lowest in cinnamon. Estimated daily intakes (EDI) of Pb and Cd from spice consumption remained below provisional tolerable weekly intake (PTWI) thresholds for all spices at reported consumption levels in Indian adults. Research was conducted at the Department of Applied Food Chemistry, Chandragupta Maurya University, Patna, Bihar, India.
Summary
Source-checkedPlain-language reading of the full paper, prepared with AI and checked against the text. Each point links to the authors' own words.
Why it matters
- Spices can be a significant source of dietary heavy metal exposure despite being consumed in small amounts, often due to soil contamination, adulteration, or processing equipment. View evidence ↗
- Lead (Pb) and cadmium (Cd) are particularly concerning because lead is a neurotoxin with no safe blood level, and cadmium is a nephrotoxin that accumulates in the kidneys. View evidence ↗
The question
- The study aimed to quantify the levels of essential minerals and toxic heavy metals in ten commonly consumed Indian spices. View evidence ↗
What they did
- Ten different spices were purchased in triplicate from three retail markets in Patna between July 2022 and March 2024 to account for batch variation. View evidence ↗
- Samples underwent microwave acid digestion (180°C for 20 minutes) and were analyzed using inductively coupled plasma mass spectrometry (ICP-MS). View evidence ↗
- An in-vitro digestion protocol (INFOGEST 2.0) was used on six selected spices to determine the bioaccessibility, or the fraction of metal that could be absorbed after ingestion. View evidence ↗
- Estimated daily intakes (EDI) were calculated by multiplying the measured metal concentration by the daily intake rates provided by the 2022 NNMB survey. View evidence ↗
What they found
- Lead concentrations ranged from 0.39 mg/kg in cloves to 1.34 mg/kg in turmeric, all of which were below the EU maximum residue limit (MRL) of 2.0 mg/kg. View evidence ↗
- Turmeric had the highest cadmium level at 0.23 mg/kg, which exceeded the EU benchmark of 0.20 mg/kg in one specific procurement batch from January 2023. View evidence ↗
- Cumin contained the highest levels of essential minerals, specifically calcium (1,243 mg/kg), magnesium (931 mg/kg), and iron (663 mg/kg). View evidence ↗
- The bioaccessible fraction of lead (21.7% to 33.2%) and cadmium (19.3% to 29.4%) was significantly lower than the total metal content. View evidence ↗
- All target hazard quotients (THQ) and hazard indices (HI) were less than 1, indicating that the risk is acceptable at reported consumption levels. View evidence ↗
What it means
- The authors conclude that the variability of cadmium in turmeric batches demonstrates the necessity for routine heavy metal monitoring within the spice supply chain. View evidence ↗
- The authors state there is no unacceptable cumulative heavy metal risk for the Bihar population consuming all ten spices at reported rates. View evidence ↗
Visual summary
3 visualsIllustrations explain the paper; charts are replotted from the paper's own table values.
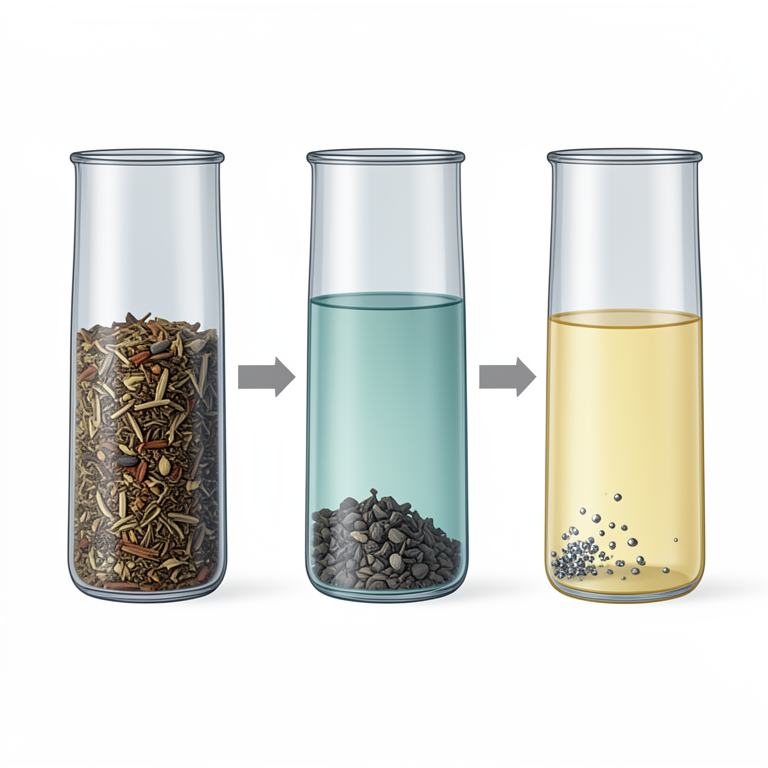
Bioaccessibility Concept
AI-generated conceptual illustration (ground spices in a laboratory digestion sequence). It explains the idea and does not show study data.
View source evidence ↗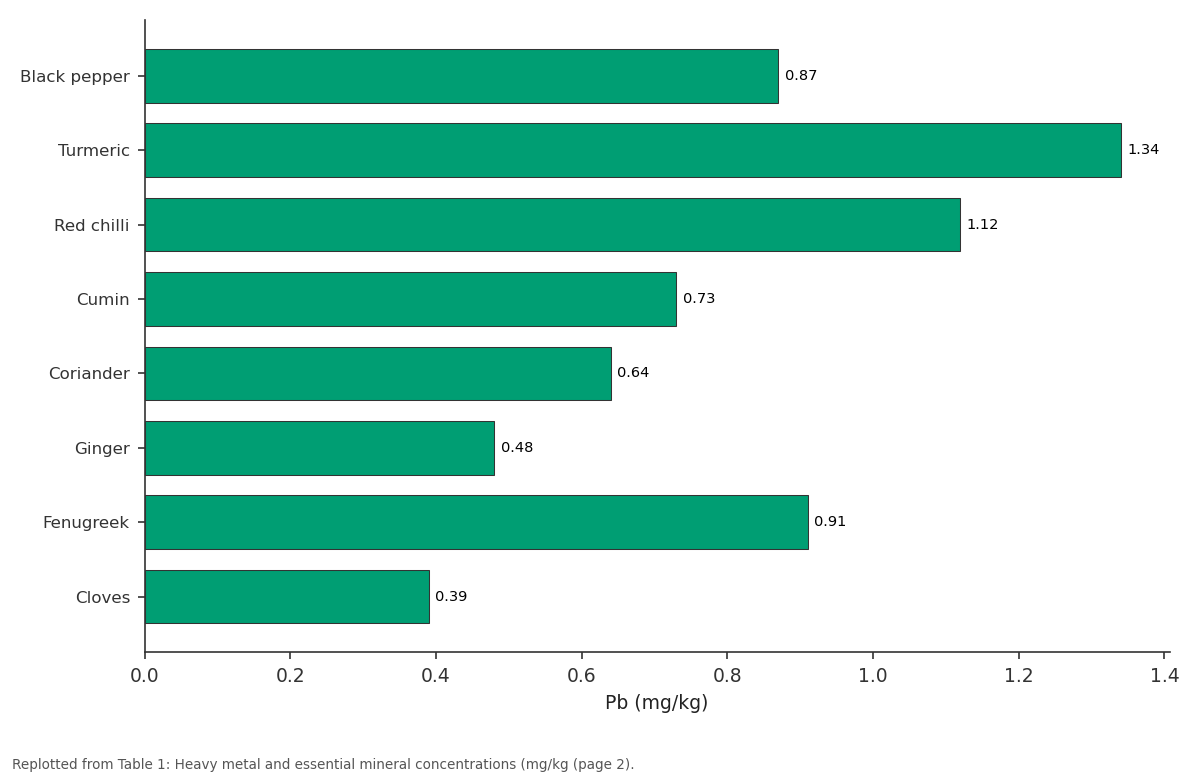
Pb: Black pepper vs Turmeric vs Red chilli vs Cumin vs Coriander
Replotted from Table 1 (page 2) of the original paper. Every bar is the paper's own table value.
View source evidence ↗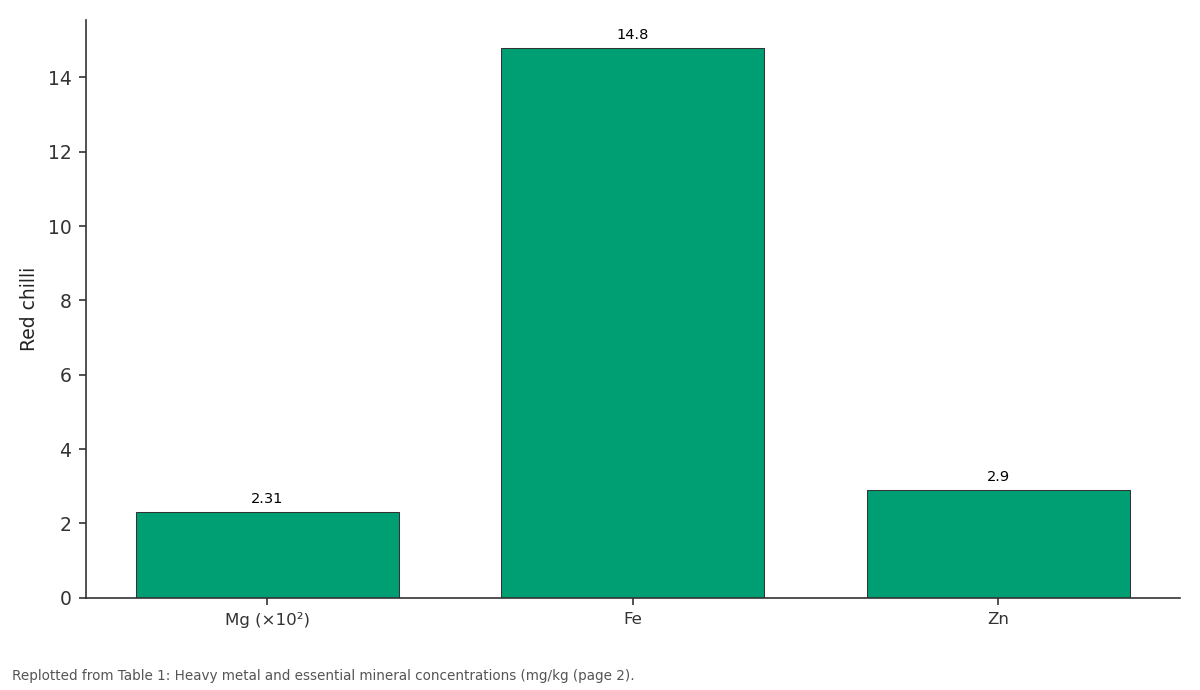
Red chilli: Mg (×10²) vs Fe vs Zn
Replotted from Table 1 (page 2) of the original paper. Every bar is the paper's own table value.
View source evidence ↗Figures & tables
From the original paper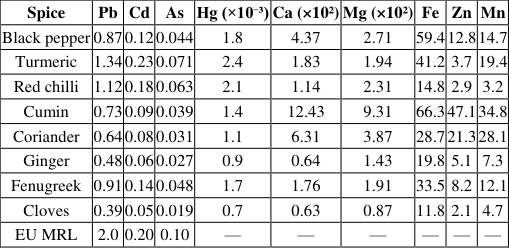 Table 1
 Table 2
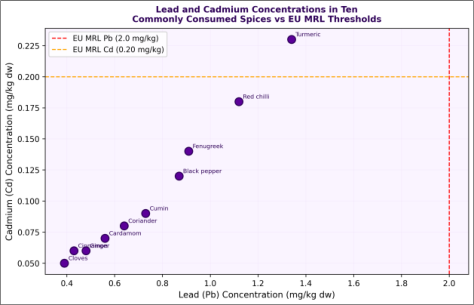 Figure 1
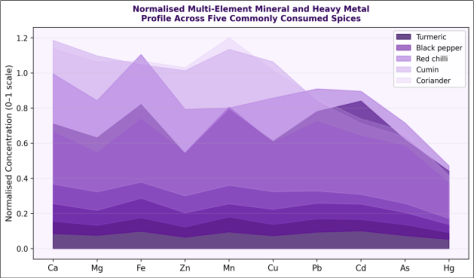 Figure 2
Introduction
Spices are integral to South Asian cuisine and contribute complex flavour profiles and bioactive phytochemicals to the diet. Although consumed in gram-level daily quantities, spices may contain relatively high concentrations of heavy metals arising from soil geochemistry at cultivation sites, the use of lead chromate as a colourant in fraudulent adulteration (particularly of turmeric), and contamination from metallic grinding equipment [1] . Pb and Cd are of greatest concern: Pb is a non-threshold neurotoxin with no known safe blood level, and Cd is a nephrotoxin that accumulates in the renal cortex over years of dietary exposure [2] . ICP-MS following microwave acid digestion is the reference method for multi-element trace analysis in food matrices, offering simultaneous quantification of all elements of interest at sub-mg/kg detection limits with isotope dilution or internal standard correction [3] . Regulatory benchmarks for heavy metals in spices are provided by EU Regulation 2023/915 and the Codex Alimentarius standard CXS 193-1995 (amended 2023). This research was conducted from July 2022 to March 2024 at the Department of Applied Food Chemistry, Chandragupta Maurya University, Patna, Bihar, India.
In-vitro Protocol
To assess metal bioaccessibilitythe fraction of total metal that could be absorbed after ingestionan In-vitro digestion protocol was applied to six selected spice samples following the INFOGEST 2.0 harmonised protocol (oral, gastric, small intestinal phases). Briefly: 0.5 g ground spice + simulated salivary fluid (pH 6.8, α-amylase 75 U/mL, 2 min), then gastric phase (pH 2.0, pepsin 2000 U/mL, 37°C, 2 h), then intestinal phase (pH 7.0, pancreatin 200 U/mL, bile extract 6 mg/mL, 37°C, 2 h). Digesta was centrifuged (3000 rpm, 10 min); supernatant (bioaccessible fraction) analysed by ICP-MS. Bioaccessibility was expressed as percentage of total metal recovered in the bioaccessible fraction relative to the total metal in the aciddigested sample. All In-vitro protocol steps were run in triplicate.
Safety Considerations
Estimated daily intakes (EDI, μg/person/day) were calculated as EDI = C × IR where C is the measured heavy metal concentration (mg/kg) and IR is the per-capita daily intake rate (g/day) of each spice from the Indian National Nutrition Monitoring Bureau (NNMB) 2022 survey data. Turmeric: 2.8 g/day; black pepper: 1.4 g/day; chilli: 3.1 g/day; cumin: 1.2 g/day; coriander: 1.8 g/day; other spices: 0.5-0.9 g/day. EDIs were compared with the JECFA-established provisional tolerable weekly intake (PTWI) for Pb (25 μg/kg bw/week) and Cd (7 μg/kg bw/week) using 60 kg adult body weight. Target hazard quotient (THQ) analysis (THQ < 1 = acceptable risk) was applied for Pb and Cd individually. Cumulative hazard index (HI = sum of THQs across spices) was calculated assuming simultaneous daily consumption of all ten spices at NNMB-reported rates.
Material and Methods
Material and Methods
Material
Ten spice samples (black pepper, turmeric, red chilli, cumin, coriander, ginger, fenugreek, cloves, cardamom, cinnamon) were purchased in triplicate from three Patna retail market outlets on separate days (July 2022, January 2023, March 2024) to account for batch variation. Reference materials: NIST SRM 1573a (tomato leaves) and SRM 1547 (peach leaves) for ICP-MS calibration verification. Reagent-grade HNO₃ (65%, Merck Suprapur) and H₂O₂ (30%, Suprapur) were used for digestion. Milli-Q water (18.2 MΩ•cm) throughout. Research was conducted at Chandragupta Maurya University, Patna, Bihar, India.
Methods
Microwave acid digestion: 0.5 g dried and ground sample + 8 mL HNO₃ + 2 mL H₂O₂ in closed PTFE vessels (Milestone ETHOS One, programme: 180°C/20 min/800 W). Digests diluted to 50 mL with Milli-Q water. ICP-MS analysis: Thermo Scientific iCAP TQe, helium collision mode for As and Cd interference removal; external calibration 0.5-1000 μg/L, internal standards In (115), Re (187). Moisture was determined gravimetrically (105°C, 4 h) and all results reported on dry weight (dw) basis. Three analytical replicates per sample; data expressed as mean ± SD. All THQ < 1 (acceptable). HI < 1 for all individual spices and cumulative consumption scenario. All Pb concentrations were below the EU MRL of 2.0 mg/kg (maximum: turmeric 1.34 mg/kg). Turmeric also showed the highest Cd (0.23 mg/kg), exceeding the 0.20 mg/kg EU benchmark for the January 2023 procurement batch (Table 1). The elevated heavy metal levels in turmeric are consistent with reported occurrences of lead chromate adulteration in the South Asian supply chain [4] . Cumin showed the highest essential mineral values (Ca 1,243, Mg 931, Fe 663 mg/kg), reflecting its established nutritional density. Bioaccessibility ranged from 21.7 to 33.2% for Pb and from 19.3 to 29.4% for Cd (Table 2), indicating that the physiologically available fraction is substantially below total extractable metal. All THQ and HI values were < 1, confirming acceptable risk at reported consumption levels.
| Spice | Pb Bioacc. (%) | Cd Bioacc. (%) | Pb EDI (μg/day) | Cd EDI (μg/day) | THQ (Pb) | THQ (Cd) | HI (Pb+Cd) |
|---|---|---|---|---|---|---|---|
| Turmeric | 31.4 | 27.8 | 0.103 | 0.018 | 0.021 | 0.007 | 0.028 |
| Black pepper | 28.7 | 24.1 | 0.034 | 0.005 | 0.007 | 0.002 | 0.009 |
| Red chilli | 33.2 | 29.4 | 0.096 | 0.015 | 0.019 | 0.006 | 0.025 |
| Cumin | 26.1 | 21.7 | 0.024 | 0.003 | 0.005 | 0.001 | 0.006 |
| Coriander | 24.8 | 19.3 | 0.032 | 0.004 | 0.006 | 0.002 | 0.008 |
| Fenugreek | 29.6 | 25.2 | 0.027 | 0.004 | 0.005 | 0.002 | 0.007 |
Table text extracted from the original PDF; superscript letters are shown inline. The original table image is below.
View original table image
| Spice | Pb | Cd | As | Hg (×10⁻³) | Ca (×10²) | Mg (×10²) | Fe | Zn | Mn |
|---|---|---|---|---|---|---|---|---|---|
| Black pepper | 0.87 | 0.12 | 0.044 | 1.8 | 4.37 | 2.71 | 59.4 | 12.8 | 14.7 |
| Turmeric | 1.34 | 0.23 | 0.071 | 2.4 | 1.83 | 1.94 | 41.2 | 3.7 | 19.4 |
| Red chilli | 1.12 | 0.18 | 0.063 | 2.1 | 1.14 | 2.31 | 14.8 | 2.9 | 3.2 |
| Cumin | 0.73 | 0.09 | 0.039 | 1.4 | 12.43 | 9.31 | 66.3 | 47.1 | 34.8 |
| Coriander | 0.64 | 0.08 | 0.031 | 1.1 | 6.31 | 3.87 | 28.7 | 21.3 | 28.1 |
| Ginger | 0.48 | 0.06 | 0.027 | 0.9 | 0.64 | 1.43 | 19.8 | 5.1 | 7.3 |
| Fenugreek | 0.91 | 0.14 | 0.048 | 1.7 | 1.76 | 1.91 | 33.5 | 8.2 | 12.1 |
| Cloves | 0.39 | 0.05 | 0.019 | 0.7 | 0.63 | 0.87 | 11.8 | 2.1 | 4.7 |
| EU MRL | 2.0 | 0.20 | 0.10 | — | — | — | — | — | — |
Table text extracted from the original PDF; superscript letters are shown inline. The original table image is below.
View original table image
Results
Results
Discussion
Turmeric's elevated Pb and Cd relative to other spices is a recognised pattern in the literature [5] and may reflect a combination of factors: the typically yellow lead chromate adulterant that has been reported in South Asian markets, the high absorptive capacity of the turmeric rhizome for soil metals, and post-harvest drying on open surfaces in contaminated areas. The bioaccessibility values obtained here (31.4% for Pb in turmeric) are comparable to those reported in similar In-vitro digestion models for spices (25-40%) [6] , validating the INFOGEST 2.0 protocol for this matrix.
The THQ analysis confirms that even turmericthe highest-risk individual spiceposes acceptable risk at the 2.8 g/day consumption rate reported by NNMB 2022 (THQ 0.021 for Pb, 0.007 for Cd). Cumulative HI for simultaneous consumption of all ten spices at reported rates is well below 1.0, indicating no unacceptable cumulative heavy metal risk from spice consumption in the Bihar population under current contamination levels. However, the batch-to-batch variability observed (particularly for turmeric Cd exceeding MRL in one of three procurement rounds) underscores the importance of systematic lot monitoring by food safety authorities [7,8,9,10,11,12,13,14,15] .
Conclusion
ICP-MS analysis of ten commonly consumed spices from Patna retail markets showed all Pb concentrations below the EU MRL (2.0 mg/kg), with turmeric recording the highest values for both Pb (1.34 mg/kg) and Cd (0.23 mg/kg, exceeding MRL in one batch). Essential mineral content was highest in cumin. In-vitro bioaccessibility of Pb and Cd ranged from 20 to 33%, and all estimated daily intakes and hazard quotients were within acceptable limits at NNMBreported spice consumption rates. Batch-level variability in turmeric cadmium highlights the need for routine heavy metal monitoring in the spice supply chain.
Figures and tables from the paper
References
15 in the original paper- IC, Osibanjo O. Heavy metal characterization of waste portable rechargeable nickel-cadmium batteries. J Hazard Mater. 2008;154(1-3):306-312.
- WHO/JECFA. Lead: JECFA monographs. Seventythird meeting report. Geneva: World Health Organization; 2011.
- Nardi EP, Evangelista FS, Tormen L, Saint'Pierre TD, Curtius AJ, Souza SS, et al. The use of inductively coupled plasma mass spectrometry (ICP-MS) for the determination of toxic and essential elements in different types of food samples. Food Chem. 2009;112(3):727-732.
- Forsyth JE, Weaver KL, Maher K, Islam M, Raqib R, Rahman M, et al. Sources of blood lead exposure in rural Bangladesh. Environ Sci Technol. 2019;53(19):11429-11436.
- Ambade B, Sethi SS, Kurwadkar S, Mishra A, Tripathee L. Accumulation of heavy metals in the atmosphere of Jharia coalfield. Environ Monit Assess. 2021;193(3):149.
- Laparra JM, Velez D, Montoro R, Barbera R, Farre R. In vitro bioaccessibility of inorganic arsenic in cooked rice. J Agric Food Chem. 2003;51(22):6373-6378.
- EFSA CONTAM Panel. Lead dietary exposure in the European population. EFSA J. 2012;10(7):2831.
- Codex Alimentarius Commission. General standard for contaminants and toxins in food and feed (CXS 1931995). Rome: Codex Alimentarius Commission; 2023.
- Santos EE, Lauria DC, Porto da Silveira CL. Assessment of daily intake of trace elements due to consumption of foodstuffs. Sci Total Environ. 2004;327(1-3):69-79.
- Godt J, Scheidig F, Grosse-Siestrup C, Esche V, Brandenburg P, Reich A, et al. The toxicity of cadmium and resulting hazards for human health. J Occup Med Toxicol. 2006;1(1):22.
- Tripathi RM, Raghunath R, Krishnamoorthy TM. Dietary intake of heavy metals. Sci Total Environ. 1997;199(3):271-277.
- Soetan KO, Olaiya CO, Oyewole OE. The importance of mineral elements for humans, domestic animals and plants. Afr J Food Sci. 2010;4(5):200-222.
- Divrikli U, Horzum N, Soylak M, Elci L. Trace heavy metal contents of some spices and herbal plants. Food Chem. 2006;97(4):732-736.
- Saracoglu S, Tuzen M, Soylak M. Evaluation of trace element contents of dried apricot samples. J Hazard Mater. 2009;167(1-3):647-652.
- Llobet JM, Falco G, Casas C, Teixido A, Domingo JL. Concentrations of arsenic, cadmium, mercury and lead in common foods. J Agric Food Chem. 2003;51(3):838842.