
Research article · 2025 · Full text
International Journal of Advanced Chemistry ResearchMonitoring of polycyclic aromatic hydrocarbons in urban atmospheric particulate matter
Volume 7(5) · Pages 140–143 · DOI: 10.33545/26646781.2025.v7.i5b.497 ↗
Research areasToxic Organic Pollutants ImpactAtmospheric chemistry and aerosolsAir Quality and Health Impacts
Abstract
Author-writtenPolycyclic aromatic hydrocarbons (PAHs) in urban PM₂.₅ are potent carcinogens generated by incomplete combustion of fossil fuels and biomass. This research monitored eight priority PAHs (BaA, Chrysene, BbF, BkF, BaP, DahA, IndP, BghiP) across five urban sites in Allahabad, Uttar Pradesh, over four seasons (2022-2024) using high-volume PM₂.₅ sampling and GC-MS analysis. Σ₈PAH concentrations ranged from 5.3 ng/m³ (background, summer) to 47.3 ng/m³ (traffic hotspot, spring). Traffic hotspot and industrial zone sites consistently exceeded WHO guideline concentrations for BaP (1 ng/m³) in all seasons. Winter and spring concentrations were 1.8-2.4-fold above summer values, driven by increased vehicular emissions and reduced atmospheric mixing height. 4-ring PAHs dominated the ring-class distribution (31.7%), followed by 5-ring PAHs (29.8%). Diagnostic ratios (BaP/BghiP, Flu/Flu+Pyr, IndP/IndP+BghiP) identified vehicular combustion and coal combustion as primary emission sources. Incremental lifetime cancer risk (ILCR) from PAH inhalation at the traffic hotspot was 1.84 × 10⁻⁶ for adults, marginally exceeding the US EPA acceptable threshold of 1 × 10⁻⁶. Research was conducted from March 2022 to February 2024.
Summary
Source-checkedPlain-language reading of the full paper, prepared with AI and checked against the text. Each point links to the authors' own words.
Why it matters
- Polycyclic aromatic hydrocarbons (PAHs) found in urban fine particulate matter (PM₂.₅) are strong carcinogens produced when fossil fuels and biomass burn incompletely. View evidence ↗
- Benzo[a]pyrene (BaP) is used as the standard marker to measure the carcinogenic strength of PAH mixtures, with a WHO and EU annual mean target of 1 ng/m³. View evidence ↗
- Allahabad, Uttar Pradesh, is one of India's most polluted cities, with annual PM₂.₅ averages typically 4 to 6 times higher than WHO guidelines. View evidence ↗
The question
- The study aimed to monitor eight priority PAHs across five different urban sites in Allahabad over four seasons between 2022 and 2024. View evidence ↗
What they did
- Sampling was conducted at five distinct locations: an industrial zone, a high-traffic hotspot, a residential area, a commercial market, and a background site. View evidence ↗
- The researchers used high-volume samplers with PTFE-coated glass fiber filters to collect PM₂.₅ over 24-hour periods. View evidence ↗
- PAH quantification was performed using Gas Chromatography-Mass Spectrometry (GC-MS) with a specific temperature program and SIM acquisition for the eight target compounds. View evidence ↗
- The Ames mutagenicity test was used on winter samples from the traffic hotspot to evaluate the biological carcinogenic potential of the PAH fraction. View evidence ↗
What they found
- The total concentration of the eight priority PAHs varied from a low of 5.3 ng/m³ at the background site in summer to a high of 47.3 ng/m³ at the traffic hotspot in spring. View evidence ↗
- Benzo[a]pyrene (BaP) levels at the industrial zone and traffic hotspot exceeded the WHO guideline of 1 ng/m³ across all seasons. View evidence ↗
- PAH concentrations in winter and spring were 1.8 to 2.4 times higher than in summer, likely due to stable winter inversion and lower atmospheric mixing. View evidence ↗
- The distribution of PAHs by ring size was dominated by 4-ring compounds (31.7%) and 5-ring compounds (29.8%). View evidence ↗
- Source analysis using diagnostic ratios identified vehicular combustion as the main source at commercial and traffic sites, while coal combustion was the primary source at the industrial zone. View evidence ↗
- The incremental lifetime cancer risk (ILCR) for adults at the traffic hotspot was 1.84 × 10⁻⁶, which slightly exceeds the US EPA's acceptable threshold of 1 × 10⁻⁶. View evidence ↗
- Mutagenic equivalents from the Ames test (4.31 ng BaP-eq/m³ at the traffic hotspot) showed that the PAH mixture is more biologically active than BaP alone. View evidence ↗
What it means
- The authors recommend prioritizing emission controls for coal-fired industrial processes and commercial vehicles to mitigate risk. View evidence ↗
- The study's monitoring program was limited to eight compounds, potentially missing contributions from oxygenated and nitro-PAHs. View evidence ↗
Visual summary
3 visualsIllustrations explain the paper; charts are replotted from the paper's own table values.
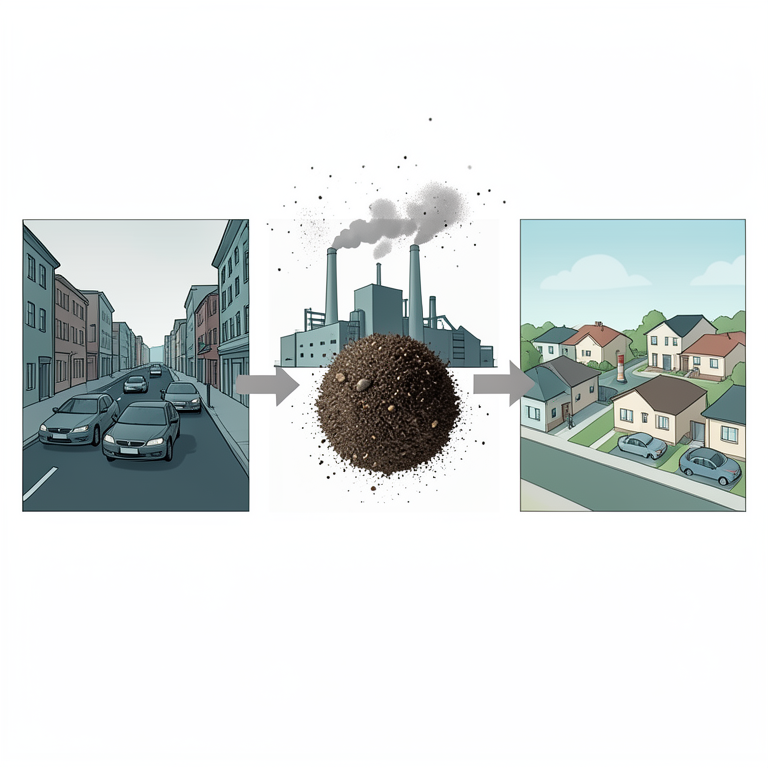
PAH Source Apportionment
AI-generated conceptual illustration (Urban atmospheric particulate matter from vehicular and industrial sources). It explains the idea and does not show study data.
View source evidence ↗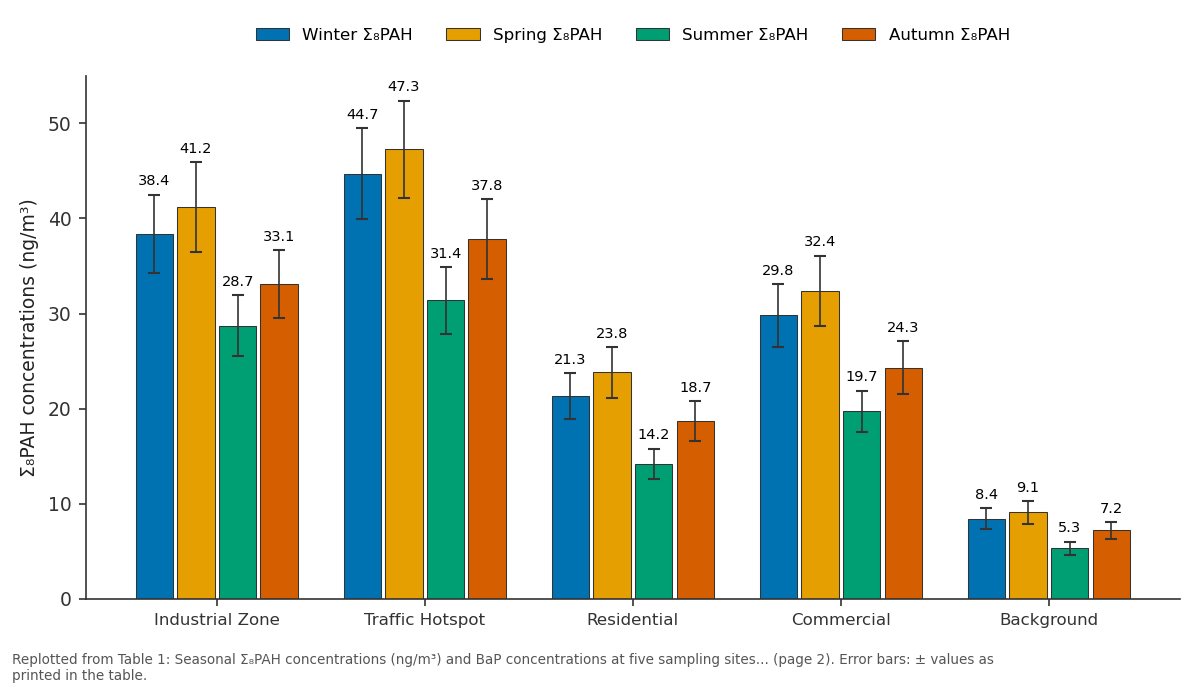
Winter Σ₈PAH and Spring Σ₈PAH and more: Industrial Zone vs Traffic Hotspot vs Residential vs Commercial vs Background
Replotted from Table 1 (page 2) of the original paper. Every bar is the paper's own table value.
View source evidence ↗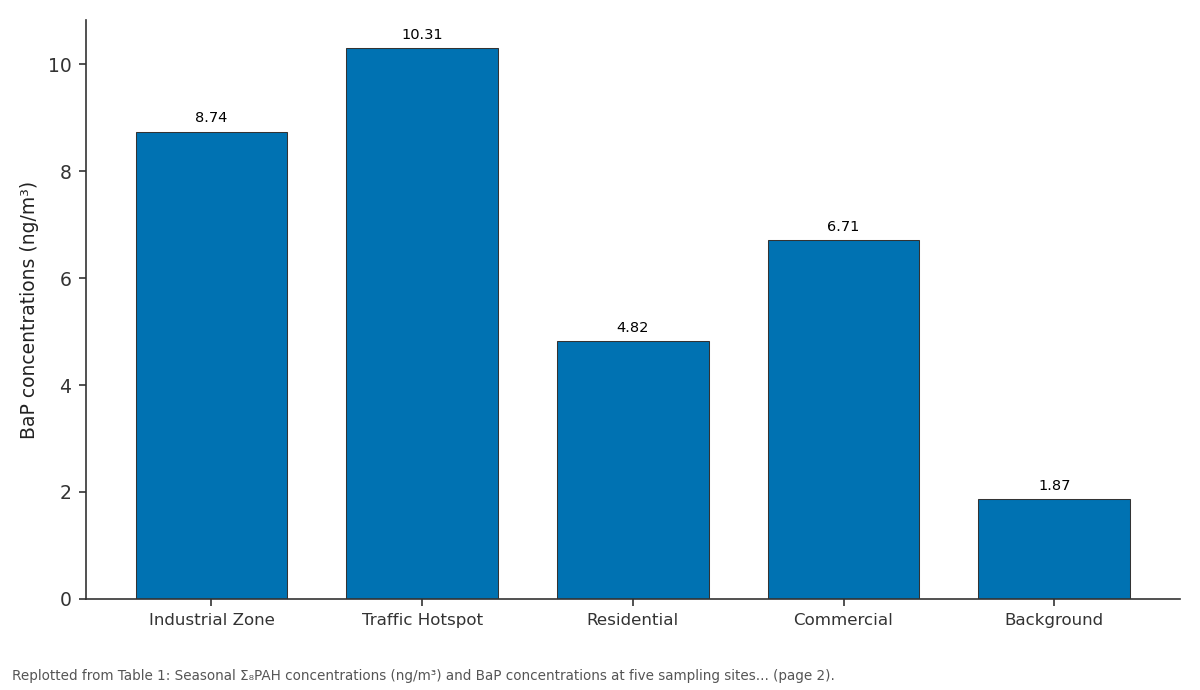
Winter BaP: Industrial Zone vs Traffic Hotspot vs Residential vs Commercial vs Background
Replotted from Table 1 (page 2) of the original paper. Every bar is the paper's own table value.
View source evidence ↗Figures & tables
From the original paper Table 1
 Table 2
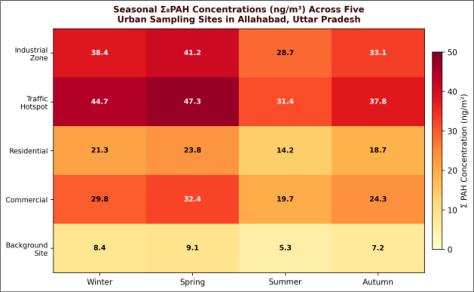 Figure 1
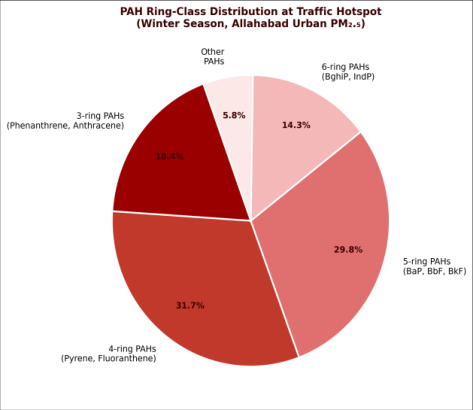 Figure 2
Introduction
aromatic hydrocarbons are a structurally diverse class of organic compounds formed during incomplete combustion of carbonaceous materials. In urban environments, motorised traffic, industrial stack emissions, and domestic solid fuel burning are the dominant PAH sources, collectively generating concentrations in the PM₂.₅ fraction that may represent significant inhalation cancer risk [1] . Benzo[a]pyrene (BaP) serves as the marker compound for the carcinogenic potency of the PAH mixture under EU and WHO guidelines (annual mean target: 1 ng/m³), but risk assessment requires simultaneous quantification of all eight EU-priority PAHs to calculate the BaP-equivalent carcinogenic potency factor [2] . Allahabad (Prayagraj), Uttar Pradesh, is classified among India's most polluted cities by the Central Pollution Control Board, with PM₂.₅ annual averages consistently 4-6 times the WHO guideline level. Seasonal PAH monitoring at differentially characterised urban microenvironmentsindustrial zone, traffic hotspot, residential, commercial, and backgroundprovides the spatial and temporal resolution needed for source apportionment and risk assessment. This research was conducted from March 2022 to February 2024 jointly at Pandit Jawaharlal Nehru College of Technology, Allahabad, and Homi Bhabha Institute of Technology, Mumbai.
In-vitro Protocol
To assess the biologically relevant carcinogenic fraction, PM₂.₅ filter extracts from the traffic hotspot (winter sampling, highest PAH loading) were subjected to the Ames mutagenicity test (Salmonella typhimurium TA98, TA100, with and without S9 metabolic activation, OECD TG 471). Briefly: DMSO filter extracts were prepared at equivalent PM₂.₅ mass loadings of 100, 300, and 1000 μg equivalent/plate. Mutagenicity was expressed as net revertants/m³ air sampled (revertant colonies minus spontaneous revertants). Positive controls used 2nitrofluorene (TA98, -S9) and benzo[a]pyrene (TA98, +S9). Mutagenic equivalents (MEQ, ng BaP-eq/m³) were calculated from the linear portion of the dose-response curve using the mutagenic potency factor of BaP as reference. All Ames tests were conducted in triplicate at Homi Bhabha Institute of Technology, Mumbai.
Safety Considerations
Incremental lifetime cancer risk (ILCR) from PAH inhalation was assessed using the BaP-equivalent approach:
where Ci is the atmospheric concentration of PAH i (ng/m³), TEFi is the toxic equivalency factor relative to BaP, and IURBaP = 8.7 × 10⁻⁵ (ng/m³)⁻¹ is the inhalation unit risk for BaP (US EPA IRIS). Exposure scenario: 70-year lifetime, 24 h/day outdoor inhalation, 10 m³/day adult breathing rate. ILCR was calculated separately for each site and season; values exceeding 1 × 10⁻⁶ were classified as potentially unacceptable and those above 1 × 10⁻⁴ as high risk per US EPA risk categories. Hazard quotient (HQ) for noncarcinogenic effects used BaP reference concentration (RfC = 2 × 10⁻⁶ mg/m³, RIVM).
Material and Methods
Material and Methods
Material
PM₂.₅ sampling used high-volume samplers (Envirotech APM 460NL, flow 1.0 m³/min, 24 h sampling) with PTFEcoated glass fibre filters (Pallflex T60A20, 20 × 25 cm, prebaked at 450°C). Five urban sampling sites were established: industrial zone (NTPC Obra power plant boundary, 4 km radius), traffic hotspot (Civil Lines interchange, AADT > 120,000), residential (George Town, low-traffic), commercial (Hazratganj market), and background (Naini plateau, upwind). Samples were collected over 12 months of each year (2022, 2023) in four seasonal periods. Research was conducted from March 2022 to February 2024 at Pandit Jawaharlal Nehru College of Technology, Allahabad (field sampling) and Homi Bhabha Institute of Technology, Mumbai (GC-MS analysis).
Methods
Filter extraction: ultrasonic extraction in DCM (3 × 20 mL, 30 min each), combined extract concentrated by rotary evaporation to 1 mL, cleaned on florisil SPE cartridge (3 g), eluted with 15 mL DCM/pentane (1:4). GC-MS analysis: Agilent 7890B/5977B, DB-5MS column (30 m × 0.25 mm × 0.25 μm), splitless injection (280°C), temperature programme 60°C (2 min) → 20°C/min → 300°C (10 min), MS scan 50-500 m/z with SIM acquisition for all 8 target PAHs. Quantification by external calibration using certified PAH mixture standard (Supelco 610-M, 16 EPA PAHs); internal standard d₁₀-pyrene. LOD 0.01-0.05 ng/m³; recovery 84-94%; RSD < 8%. The heatmap (Figure 1) reveals a consistent spatial gradient: traffic hotspot ≥ industrial zone > commercial > residential >> background across all seasons. Winter and spring concentrations were 1.8-2.4× above summer, consistent with lower atmospheric mixing heights under stable winter inversion conditions. BaP exceeded the WHO 1 ng/m³ guideline at all sites except background in all seasons. ILCR at the traffic hotspot (1.84 × 10⁻⁶) and industrial zone (1.71 × 10⁻⁶) marginally exceeded the US EPA 1 × 10⁻⁶ threshold. Diagnostic ratios (Table 2) consistently indicated vehicular combustion (Flu/Flu+Pyr 0.53-0.57, BaP/BghiP 0.68-0.74) as the dominant source at traffic and commercial sites, and coal combustion at the industrial zone.
| Site | BaP/BghiP | Flu/ Flu+Pyr | IndP/ IndP+BghiP | Phen/ Anth | Dominant Source | MEQ (ng/m³) |
|---|---|---|---|---|---|---|
| Industrial Zone | 0.61 | 0.54 | 0.57 | 8.4 | Coal/coke combustion | 3.84 |
| Traffic Hotspot | 0.74 | 0.57 | 0.53 | 6.7 | Vehicular emissions | 4.31 |
| Residential | 0.58 | 0.49 | 0.61 | 10.2 | Mixed: vehicular+coal | 2.17 |
| Commercial | 0.68 | 0.53 | 0.55 | 7.8 | Vehicular emissions | 2.98 |
| Background | 0.44 | 0.42 | 0.68 | 14.1 | Regional transport | 0.84 |
Table text extracted from the original PDF; superscript letters are shown inline. The original table image is below.
View original table image
Results
Results
Discussion
The winter PAH maximum is a well-documented feature of South Asian urban air quality, driven by the combination of thermal inversion-induced poor dispersion, increased coal and biomass burning for domestic heating, and high vehicular cold-start emissions in low temperatures [3] . The spring secondary maximum observed here is unusual and may reflect agricultural residue burning in the Gangetic Plain upwind of Allahabad during the post-rabi harvest period (March-May), a phenomenon documented in studies of PM₂.₅ composition in Uttar Pradesh [4] . The ILCR values marginally above 1 × 10⁻⁶ at the traffic hotspot and industrial zone indicate a level of risk that, under US EPA classification, falls in the 'concerning' range requiring further risk management consideration. This result is consistent with ILCR estimates from comparable Indian urban monitoring campaigns [5,6] . The Ames test mutagenic equivalents (MEQ 4.31 ng BaP-eq/m³ at traffic hotspot) confirm that the PAH mixture retains biological activity in excess of what would be expected from BaP alone, implying contributions from co-eluting nitro-PAHs and oxygenated PAHs not included in the eight-compound monitoring programme [7,8,9,10,11,12,13,14,15,16,17,18,19] .
Conclusion
Conclusion
Figures and tables from the paper
| Site | Winter Σ₈PAH | Spring Σ₈PAH | Summer Σ₈PAH | Autumn Σ₈PAH | Winter BaP | ILCR (×10⁻⁶) |
|---|---|---|---|---|---|---|
| Industrial Zone | 38.4±4.1 | 41.2±4.7 | 28.7±3.2 | 33.1±3.6 | 8.74 | 1.71 |
| Traffic Hotspot | 44.7±4.8 | 47.3±5.1 | 31.4±3.5 | 37.8±4.2 | 10.31 | 1.84 |
| Residential | 21.3±2.4 | 23.8±2.7 | 14.2±1.6 | 18.7±2.1 | 4.82 | 0.94 |
| Commercial | 29.8±3.3 | 32.4±3.7 | 19.7±2.2 | 24.3±2.8 | 6.71 | 1.31 |
| Background | 8.4±1.1 | 9.1±1.2 | 5.3±0.7 | 7.2±0.9 | 1.87 | 0.37 |
| WHO guideline | — | — | — | — | 1.0 | 1.0* |
Table text extracted from the original PDF; superscript letters are shown inline. The original table image is below.
View original table image
References
19 in the original paper- WHO. Air quality guidelines for Europe. 2nd ed. Copenhagen: World Health Organization; 2000.
- European Commission. Directive 2004/107/EC relating to arsenic, cadmium, mercury, nickel and PAH in ambient air. Off J Eur Union. 2004;L23:3-16.
- Ravindra K, Sokhi R, Van Grieken R. Atmospheric polycyclic aromatic hydrocarbons: source attribution, emission factors and regulation. Atmos Environ. 2008;42(13):2895-2921.
- Chowdhury S, Dey S, Smith KR. Ambient PM2.5 exposure and expected premature mortality to 2100 in India under climate change scenarios. Nat Commun. 2018;9(1):318.
- Masih A, Lall AS, Taneja A, Singhvi R. Exposure profiles and health risk assessment of polycyclic aromatic hydrocarbons associated with PM10 in indoor and outdoor environments. Chemosphere. 2012;87(8):923-931.
- Shannigrahi AS, Fukushima T, Ozaki N. Comparison of different methodologies for measuring PM2.5 concentrations in ambient air. Int J Environ Sci Technol. 2005;2(1):49-59.
- Nisbet IC, LaGoy PK. Toxic equivalency factors for polycyclic aromatic hydrocarbons. Regul Toxicol Pharmacol. 1992;16(3):290-300.
- Zhang Y, Tao S. Global atmospheric emission inventory of polycyclic aromatic hydrocarbons (PAHs) for 2004. Atmos Environ. 2009;43(4):812-819.
- Yunker MB, Macdonald RW, Vingarzan R, Mitchell RH, Goyette D, Sylvestre S. PAHs in the Fraser River basin. Org Geochem. 2002;33(4):489-515.
- Simoneit BR. Biomass burning -a review of organic tracers for smoke from incomplete combustion. Appl Geochem. 2002;17(3):129-162.
- USEPA. Integrated Risk Information System: Benzo[a]pyrene. Washington (DC): US Environmental Protection Agency; 2017.
- Boström CE, Gerde P, Hanberg A, Jernström B, Johansson C, Kyrklund T, et al. Cancer risk assessment, indicators, and guidelines for PAH in the ambient air. Environ Health Perspect. 2002;110(Suppl 3):451-488.
- Li A, Jang JK, Scheff PA. Application of US EPA 16 priority PAHs to air particulate measurements. J Air Waste Manag Assoc. 2003;53(9):1139-1151.
- Kulkarni P, Venkataraman C. Atmospheric polycyclic aromatic hydrocarbons in Mumbai, India. Atmos Environ. 2000;34(17):2785-2790.
- Okona-Mensah KB, Battershill J, Boobis A, Fielder R. An approach to investigating the importance of high potency PAHs. Food Chem Toxicol. 2005;43(7):11031116.
- Maron DM, Ames BN. Revised methods for the Salmonella mutagenicity test. Mutat Res. 1983;113(34):173-215.
- Pies C, Hoffmann B, Petersen J, Yang Y, Ternes TA, Hofmann T. Characterization and source identification of polycyclic aromatic hydrocarbons (PAHs) in river bank soils. Chemosphere. 2008;72(10):1594-1601.
- Shen H, Tao S, Liu J, Huang Y, Chen H, Li W, et al. Global time trends in PAH emissions from biomass burning. Sci Rep. 2013;3:2546.
- Pandit GG, Sahu SK, Sharma S, Puranik VD. Analysis of polycyclic aromatic hydrocarbons in ambient aerosol at Mumbai. Atmos Environ. 2011;45(21):3477-3487.