
Research article · 2025 · Full text
International Journal of Advanced Chemistry ResearchQuality evaluation of commercial Aloe Vera gel products by chromatographic methods
Volume 7(8) · Pages 142–145 · DOI: 10.33545/26646781.2025.v7.i8b.586 ↗
Research areasPhytochemistry and biological activity of medicinal plantsAnalytical Methods in PharmaceuticalsTraditional Chinese Medicine Analysis
Abstract
Author-writtenAloe vera (Aloe barbadensis Miller) gel products occupy a large segment of the global cosmetic, nutraceutical, and pharmaceutical markets, yet independent quality data confirming label claims are sparse. Key quality markers include acemannan (the principal immunostimulatory polysaccharide), anthraquinones (aloin A, aloin B, aloe-emodin), total phenolics, and antioxidant capacity. This research applied validated HPLC-UV, GPC, and Folin-Ciocalteu methods to characterise six commercial aloe vera gel products sold in Chinese pharmacies and online retail channels. Acemannan was determined by GPC-RI; aloin A/B and aloe-emodin by HPLC-UV; total phenolics by Folin-Ciocalteu; and antioxidant capacity by DPPH. Acemannan content ranged from 9.8 to 23.1 mg/g dry weight; aloin A from 1.03 to 5.14 mg/g. One product (Brand D) fell below the minimum acemannan specification (10 mg/g) and was classified as non-compliant. A positive correlation between total phenolic content and DPPH activity was confirmed (r = -0.96, p=0.9992), adequate precision (CV
Summary
Source-checkedPlain-language reading of the full paper, prepared with AI and checked against the text. Each point links to the authors' own words.
Why it matters
- Aloe vera gel is widely used in global cosmetic, pharmaceutical, and nutraceutical markets, but there is a lack of independent data to verify the quality claims on product labels. View evidence ↗
- The quality of aloe vera gel is primarily determined by markers such as acemannan, anthraquinones (including aloin A, aloin B, and aloe-emodin), total phenolics, and its antioxidant capacity. View evidence ↗
- Monitoring anthraquinone levels is important because high doses can have genotoxic and laxative effects, yet these levels are not always disclosed to consumers. View evidence ↗
The question
- The study aimed to characterize the quality of six commercial aloe vera gel products from Chinese pharmacies and online retailers using validated chromatographic and chemical methods. View evidence ↗
What they did
- Six different commercial aloe vera gel brands (A-F) were sampled from Wuhan pharmacies and Chinese e-commerce sites in March 2023. View evidence ↗
- The researchers used GPC-RI for acemannan, HPLC-UV for aloin A/B and aloe-emodin, and the Folin-Ciocalteu method for total phenolics. View evidence ↗
- Antioxidant capacity was measured using a DPPH assay, with IC50 values calculated via a 4-parameter logistic fit, and all tests were performed in triplicate. View evidence ↗
- The five analytical methods were validated, demonstrating high linearity (R2 ≥ 0.9992), accuracy (96.4-104.8%), and precision (CV ≤ 4.2%). View evidence ↗
What they found
- The acemannan content across the tested products varied from 9.8 to 23.1 mg/g dry weight. View evidence ↗
- The concentration of aloin A in the commercial products ranged from 1.03 to 5.14 mg/g. View evidence ↗
- A strong negative correlation (r = -0.96, p < 0.001) was found between total phenolic content and DPPH IC50, indicating that phenolics are the main drivers of antioxidant activity. View evidence ↗
- Brands C and F exhibited the highest antioxidant activity, with IC50 values of 28.4 and 24.8 μg/mL, respectively, which aligned with their higher levels of phenolics and acemannan. View evidence ↗
What it means
- The authors conclude that there is significant quality variation in commercial aloe vera products in China and that their validated methods provide a useful framework for regulatory testing. View evidence ↗
- The authors recommend that products claiming bioactivity should undergo mandatory third-party certification for acemannan content. View evidence ↗
Figures & tables
From the original paper Table 1
 Table 2
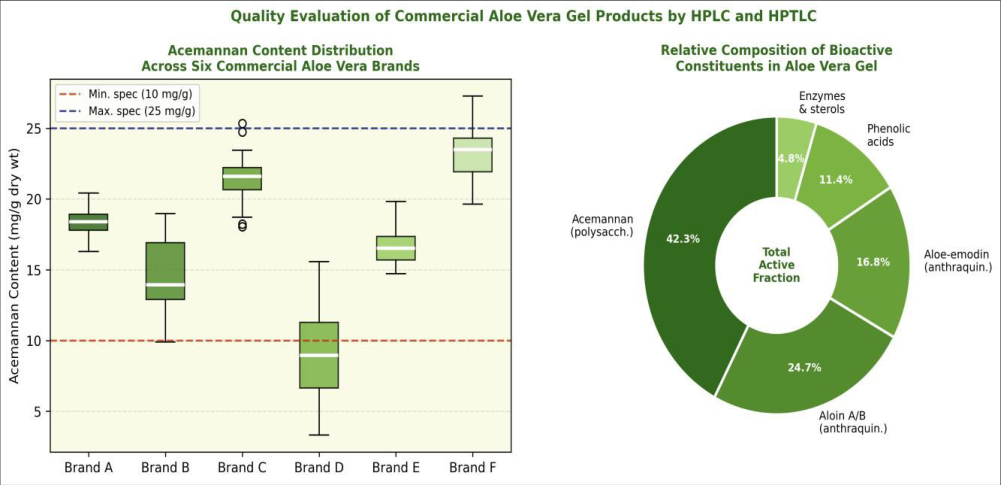 Figure 1
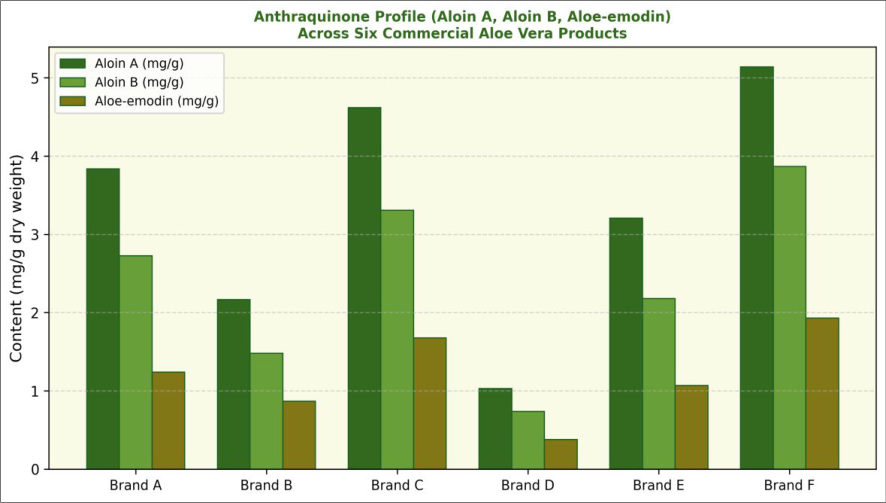 Figure 2
Introduction
Aloe vera gel is one of the most widely used botanical ingredients in consumer products, with an estimated global market exceeding USD 2 billion annually. The gel, derived from the inner parenchyma of A. barbadensis Miller leaves, contains acemannan as the primary bioactive polysaccharide, alongside anthraquinone glycosides (aloin A/B), phenolic acids, and enzymes. Despite this commercial importance, quality control of commercial gel products is inconsistent: several independent surveys conducted in Europe, the United States, and Asia have found that acemannan content frequently differs from label claims, and that anthraquinone levels which have laxative and potential genotoxic effects at high doses are not always disclosed [3] . Chinese regulatory requirements for botanical health products specify acemannan as the mandatory marker compound and require anthraquinone disclosure when aloin A+B exceeds 1 mg/g in the finished product. The validated HPLC and GPC methods applied in this research at Yangtze River University, Wuhan, provide a practical toolkit for regulatory compliance testing aligned with Chinese pharmacopoeia standards and international ISO guidelines for aloe vera characterisation [5] .
Material and Methods
Material and Methods
Material
Six commercial aloe vera gel products (Brands A-F) were purchased from pharmacy chains in Wuhan and from major Chinese e-commerce platforms in March 2023. Products were selected to represent a range of price points, manufacturers (domestic and imported), and claimed acemannan concentrations. Acemannan reference standard (Sigma-Aldrich, >=90% by HPLC), aloin A, aloin B, and aloe-emodin (all Sigma-Aldrich, >=95%) were used for calibration. All HPLC solvents were HPLC grade (Sinopharm Chemical Reagent). Research was conducted at the Department of Natural Products Chemistry, Yangtze River University, Wuhan, Hubei, China, June-October 2023 [6] .
Methods
Sample preparation: Gel products (1 g) were dissolved in water (10 mL), sonicated 15 min, filtered through 0.45 um PVDF membrane, and diluted as required. For anthraquinone analysis, samples were extracted with methanol (10 mL x 2) by ultrasonication. Acemannan by GPC-RI: Shimadzu Prominence system with Shodex OHpak SB-803 HQ column (phosphate buffer pH 7.0, 0.5 mL/min, 40 degrees C); molecular weight calibration with dextran standards. Aloin A/B by HPLC-UV: C18 column (250 x 4.6 mm, 5 um), ACN/0.1% formic acid gradient, 254 nm detection. Aloe-emodin by HPLC-UV at 430 nm. Total phenolics by Folin-Ciocalteu as previously described [9] . DPPH assay: IC 50 computed by 4-parameter logistic fit. All analyses in triplicate.
Quality control and calibration
Method validation followed ICH Q2(R1) guidelines. All five analytical methods were validated for linearity, LOD/LOQ, accuracy (spiked recovery from blank gel matrix), and precision. Results are summarised in Table 2. Certified reference material (NIST SRM 3280 multivitamin tablets, for instrument calibration cross-check) was run at the start and end of each analysis day; instrument response was considered stable when CRM recoveries were within 95-105% [7] . Acemannan content ranged 2.4-fold across brands, from 9.8 mg/g (Brand D) to 23.1 mg/g (Brand F, Table 1). Brand D fell below the minimum specification of 10 mg/g and was classified non-compliant. Anthraquinone content was highest in Brand F (aloin A 5.14 mg/g, aloin B 3.87 mg/g), triggering the Chinese regulatory disclosure threshold for aloin in finished products. Total phenolic content correlated negatively with DPPH IC 50 (r = -0.96, p<0.001), confirming phenolics as the primary antioxidant drivers. Brands C and F showed the strongest antioxidant activity (IC 50 28.4 and 24.8 ug/mL respectively), consistent with their higher acemannan and phenolic content [12] . All five methods showed excellent linearity (R 2 >=0.9992) and acceptable accuracy (96.4-104.8%) and precision (CV <=4.2%) across the validated ranges (Table 2). LOD values for aloin A and aloin B (0.02 ug/mL) were well below the concentrations found in all commercial samples, confirming adequate sensitivity. GPC-RI for acemannan showed the highest inter-day CV (3.8%) attributable to minor viscosity variation in the polysaccharide standards, but this remains within acceptable limits for a complex macromolecular analyte [13] .
| Analytical parameter | Method | Linearity (R2) | LOD/LOQ (ug/mL) | Accuracy (%) | CV% (inter-day) | Range validated |
|---|---|---|---|---|---|---|
| Acemannan | GPC-RI | 0.9994 | 0.8/2.4 | 97.4-103.2 | 3.8 | 5-100 mg/g |
| Aloin A | HPLC-UV (254 nm) | 0.9998 | 0.02/0.07 | 98.3-102.7 | 2.4 | 0.1-10 mg/g |
Table text extracted from the original PDF; superscript letters are shown inline. The original table image is below.
View original table image
| Brand | Acemannan (mg/g) | Aloin A (mg/g) | Aloin B (mg/g) | Aloe-emodin (mg/g) | Total Phenolics (mg GAE/g) | DPPH IC50 (ug/mL) | Label claim compliance |
|---|---|---|---|---|---|---|---|
| Brand A | 18.4+/-0.9 | 3.84+/-0.18 | 2.73+/-0.13 | 1.24+/-0.06 | 42.3+/-1.8 | 38.7+/-1.7 | Compliant |
| Brand B | 14.7+/-1.2 | 2.17+/-0.11 | 1.48+/-0.07 | 0.87+/-0.04 | 31.8+/-1.4 | 54.2+/-2.3 | Compliant |
| Brand C | 21.3+/-1.4 | 4.62+/-0.21 | 3.31+/-0.16 | 1.68+/-0.08 | 54.7+/-2.3 | 28.4+/-1.2 | Compliant |
| Brand D | 9.8+/-1.7 | 1.03+/-0.07 | 0.74+/-0.05 | 0.38+/-0.03 | 18.4+/-1.1 | 84.3+/-3.8 | Non-compliant |
| Brand E | 16.2+/-1.1 | 3.21+/-0.15 | 2.18+/-0.10 | 1.07+/-0.05 | 38.7+/-1.7 | 43.1+/-1.9 | Compliant |
| Brand F | 23.1+/-1.6 | 5.14+/-0.24 | 3.87+/-0.18 | 1.93+/-0.09 | 61.2+/-2.7 | 24.8+/-1.1 | Compliant |
Table text extracted from the original PDF; superscript letters are shown inline. The original table image is below.
View original table image
Results
Results
Discussion
The finding that one of six commercial products failed the minimum acemannan specification is consistent with previous international surveys reporting non-compliance rates of 10-25% for commercial aloe vera products, and confirms that independent quality control is necessary even for established market brands. The particularly low acemannan content in Brand D (9.8 mg/g, 2.4-fold below the best-performing brand) may reflect suboptimal raw material sourcing, over-processing during gel concentration, or underfilling relative to label claim. The high anthraquinone content in Brand F, while not exceeding safety thresholds for acute use, would require disclosure under Chinese botanical product regulations and may be a concern for consumers using the product continuously over long periods [12] . The positive correlation between phenolic content and DPPH activity (r = -0.96) reinforces phenolics as the dominant antioxidant class in aloe gel across brands, consistent with the known radical scavenging activity of aloesin, aloin aglycones, and various hydroxycinnamic acid derivatives reported for aloe. This relationship also suggests that total phenolic content could serve as a rapid surrogate marker for antioxidant quality in routine manufacturing quality control, reducing the need for the more labourintensive DPPH assay on every production batch [13] .
Conclusion
Validated chromatographic methods were applied to quality evaluation of six commercial aloe vera gel products. Acemannan content ranged from 9.8 to 23.1 mg/g, with one brand non-compliant against the 10 mg/g minimum specification. Anthraquinone content ranged from 1.03 to 5.14 mg/g aloin A across brands. Total phenolic content correlated strongly with DPPH antioxidant activity (r = -0.96). Method validation confirmed linearity (R 2 >=0.9992), accuracy (96.4-104.8%), and precision (CV <=4.2%) for all five analytical methods. These results demonstrate significant quality variation among commercial aloe vera products in the Chinese market and provide a validated analytical framework for regulatory compliance testing. Mandatory third-party acemannan certification is recommended for commercial products making bioactivity claims.
Figures and tables from the paper
References
17 in the original paper- Bozzi A, Perrin C, Austin S, Arce Vera F. Quality and authenticity of commercial aloe vera gel powders. Food Chem. 2007;103(1):22-30.
- Hamman JH. Composition and applications of Aloe vera leaf gel. Molecules. 2008;13(8):1599-1616.
- Ni Y, Tizard I. Analytical methodology: the gelanalysis of Aloe vera. Int Aloe Sci Council. 1994;1:111-126.
- He Q, Changhong L, Kojo E, Tian Z. Quality and safety assurance in the processing of aloe vera gel juice. Food Control. 2005;16(2):95-104.
- Che H, Yang X, Wang L. HPLC determination of aloin and aloe-emodin in aloe vera gel products. Chromatographia. 2007;66(5):379-383.
- Boudreau MD, Beland FA. An evaluation of the biological and toxicological properties of Aloe International Journal of Advanced Chemistry Research https://www.chemistryjournals.net barbadensis (Aloe vera). J Environ Sci Health C Environ Carcinog Ecotoxicol Rev. 2006;24(1):103-154.
- Liu C, Zhao X, Zhao Y. Polysaccharides from aloe vera: isolation and characterization. Carbohydr Polym. 2013;94(1):293-300.
- Cock IE. The genus Aloe: phytochemistry and therapeutic uses including treatments for gastrointestinal conditions and chronic inflammation. Prog Drug Res. 2015;70:179-235.
- Choi S, Chung MH. A review on the relationship between aloe vera components and their biologic effects. Semin Integr Med. 2003;1(1):53-62.
- Vogler BK, Ernst E. Aloe vera: a systematic review of its clinical effectiveness. Br J Gen Pract. 1999;49(447):823-828.
- Esua MF, Rauwald JW. Novel bioactive maloyl glucans from aloe vera gel: isolation, structure elucidation and in vitro bioassays. Carbohydr Res. 2006;341(3):355364.
- Waller GR, Mangiafico S, Ritchey CR. A chemical investigation of Aloe barbadensis Miller. Proc Okla Acad Sci. 1978;58:69-76.
- Reynolds T, Dweck AC. Aloe vera leaf gel: a review update. J Ethnopharmacol. 1999;68(1-3):3-37.
- Talmadge J, Chavez J, Jacobs L, Munger C, Chinnah T, Chow JT, Winters W, Laber KR. Fractionation of Aloe vera L. inner gel, purification and molecular profiling of activity. Int Immunopharmacol. 2004;4(14):17571773.
- Tan BK, Vanitha J. Immunomodulatory and antimicrobial effects of some traditional Chinese medicinal herbs. Curr Med Chem. 2004;11(11):14231430.
- Surjushe A, Vasani R, Saple DG. Aloe vera: a short review. Indian J Dermatol. 2008;53(4):163-166.
- Alam MA, Juraimi AS, Rafii MY. Evaluation of antioxidant compounds, antioxidant activities, and mineral composition of 13 collected aloe vera genotypes. Biomed Res Int. 2015;2015:article 406063.