
Research article · 2025 · Full text
International Journal of Advanced Chemistry ResearchVolatile compound profiling of medicinal herbs using headspace GC-MS analysis
Volume 7(10) · Pages 200–203 · DOI: 10.33545/26646781.2025.v7.i10c.588 ↗
Research areasEssential Oils and Antimicrobial ActivityPhytochemicals and Medicinal PlantsPlant chemical constituents analysis
Abstract
Author-writtenUnlike essential-oil distillation, which subjects plant material to steam or solvent and may alter thermolabile compounds, headspace gas chromatography-mass spectrometry (HS-GC-MS) captures the volatile profile of medicinal herbs exactly as it exists above the intact or gently crushed tissue a snapshot of the aroma that a patient or herbalist actually perceives. This research applied static headspace sampling coupled with GC-MS to profile the volatile constituents of six widely used Indian medicinal herbs: tulsi (Ocimum tenuiflorum), ashwagandha (Withania somnifera), brahmi (Bacopa monnieri), neem (Azadirachta indica), turmeric (Curcuma longa), and moringa (Moringa oleifera). A total of 127 volatile compounds were identified across the six species, with turmeric showing the richest profile (38 compounds, 5.73 mg/g) and moringa the simplest (14 compounds, 1.24 mg/g). Monoterpene hydrocarbons dominated tulsi and turmeric, while sesquiterpene alcohols were prominent in ashwagandha. Methyl eugenol (18.4%) was the single most abundant compound in tulsi, and ar-turmerone (21.7%) in turmeric. Principal component analysis separated the six herbs into distinct chemotype clusters, confirming that HS-GC-MS provides a rapid, non-destructive fingerprint suitable for quality control and authentication of herbal raw materials.
Summary
Source-checkedPlain-language reading of the full paper, prepared with AI and checked against the text. Each point links to the authors' own words.
Why it matters
- Headspace GC-MS is preferred over traditional distillation for profiling medicinal herbs because it avoids heat or solvent stress that can alter thermally sensitive compounds. View evidence ↗
- Volatile terpenes and phenylpropanoids are considered key contributors to the therapeutic effects of herbs used in Indian traditional medicine systems like Ayurveda, Siddha, and Unani. View evidence ↗
- Standardized volatile profiling is necessary to ensure the quality of herbal raw materials, authenticate species, and detect adulteration or storage-related degradation. View evidence ↗
The question
- The study aimed to create a standardized HS-GC-MS protocol to catalogue volatiles, identify species-specific markers, and use PCA to differentiate six medicinal herbs from Rajasthan, India. View evidence ↗
What they did
- The study used quality-certified raw materials from Dabur India Ltd., including aerial parts of tulsi, brahmi, and moringa, ashwagandha roots, neem leaves, and turmeric rhizomes. View evidence ↗
- The method involved equilibrating 200 mg of powdered herb with 1 µg of internal standard in a 20 mL vial at 80 °C for 20 minutes. View evidence ↗
- Analysis was performed using an Agilent 7890B GC coupled to a 5977B MSD with a 30 m HP-5MS column and a 10:1 split ratio for the 1 mL headspace aliquot. View evidence ↗
- Principal Component Analysis (PCA) was conducted using OriginPro 2024 on a matrix of 127 compounds across the six herb species. View evidence ↗
What they found
- The researchers identified 127 unique volatile compounds, primarily consisting of monoterpene hydrocarbons (34) and oxygenated monoterpenes (28). View evidence ↗
- Turmeric had the highest total volatile content at 5.73±0.41 mg/g, while moringa had the lowest at 1.24±0.11 mg/g and the fewest compounds (14). View evidence ↗
- In tulsi, methyl eugenol was the most abundant compound (18.4%), followed by linalool (14.1%) and eugenol (12.6%). View evidence ↗
- Ar-turmerone was the dominant volatile compound in turmeric, accounting for 21.7% of the profile. View evidence ↗
- Ashwagandha exhibited a sesquiterpene-heavy profile, with β-caryophyllene making up 7.2%. View evidence ↗
- PCA explained 74.8% of the total variance, clearly separating tulsi and turmeric on PC1 and isolating ashwagandha on PC2. View evidence ↗
What it means
- The authors conclude that HS-GC-MS is a practical tool for the authentication and quality control of herbal raw materials in the Ayurvedic supply chain due to its ability to create distinct chemotype clusters. View evidence ↗
- The authors note that seasonal and geographic variations may affect clustering, suggesting that future research should include samples from various regions and seasons. View evidence ↗
Visual summary
2 visualsIllustrations explain the paper; charts are replotted from the paper's own table values.
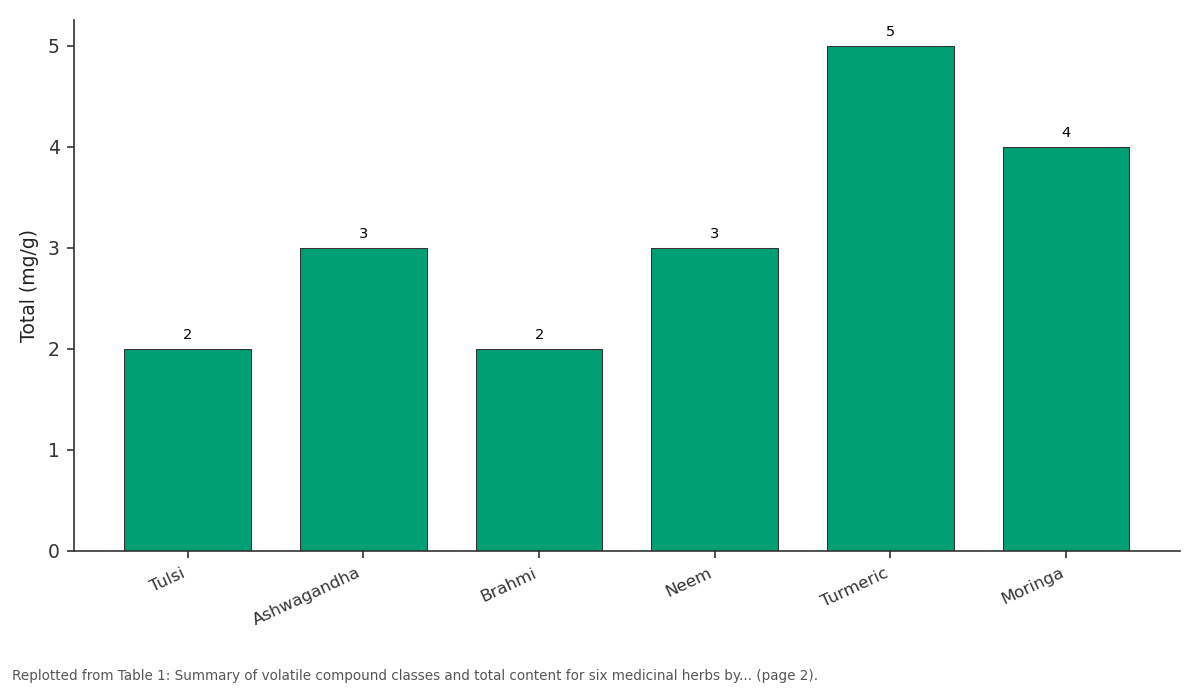
Other: Tulsi vs Ashwagandha vs Brahmi vs Neem vs Turmeric
Replotted from Table 1 (page 2) of the original paper. Every bar is the paper's own table value.
View source evidence ↗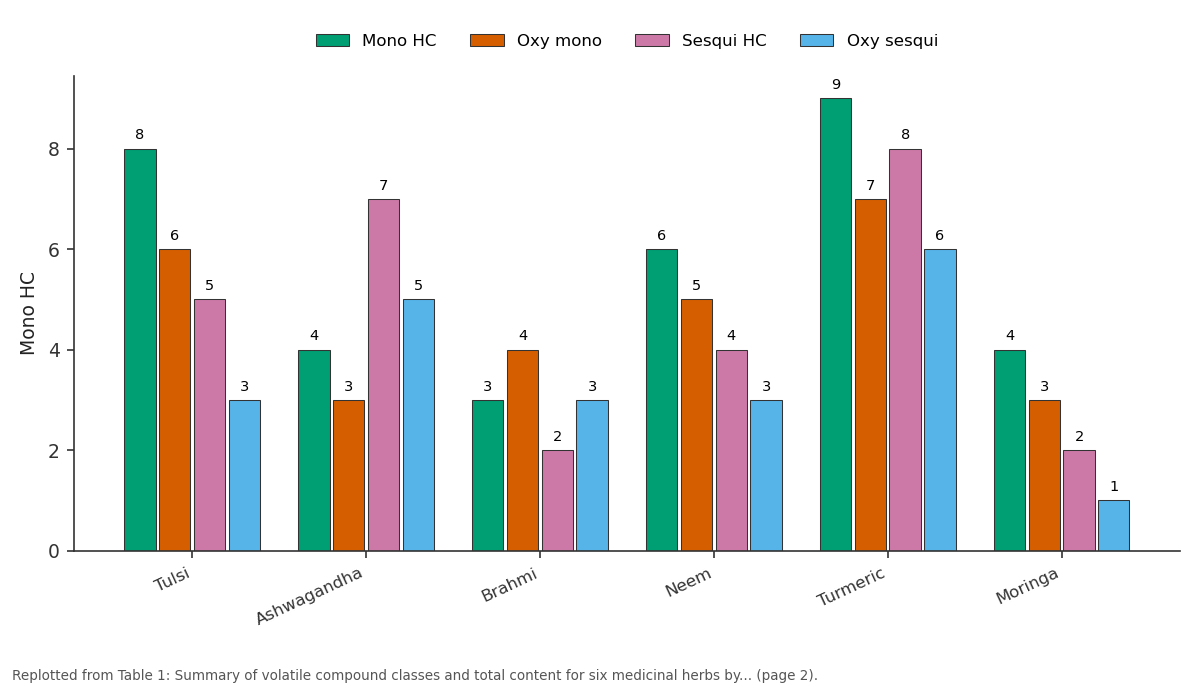
Mono HC and Oxy mono and more: Tulsi vs Ashwagandha vs Brahmi vs Neem vs Turmeric
Replotted from Table 1 (page 2) of the original paper. Every bar is the paper's own table value.
View source evidence ↗Figures & tables
From the original paper Table 1
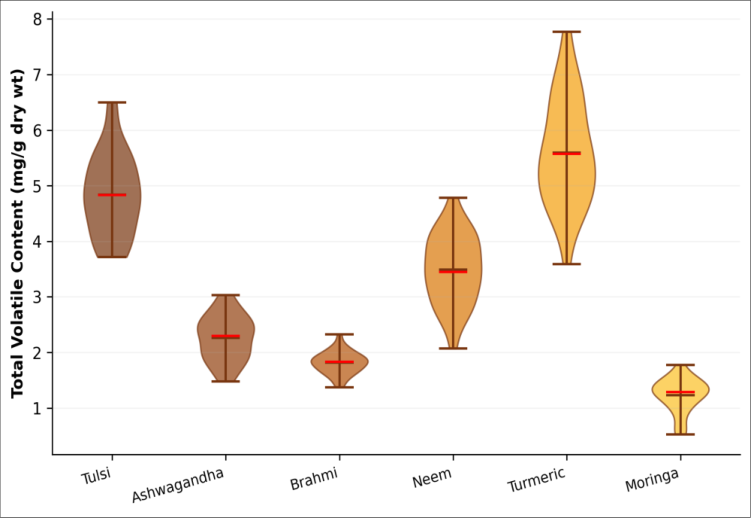 Figure 1
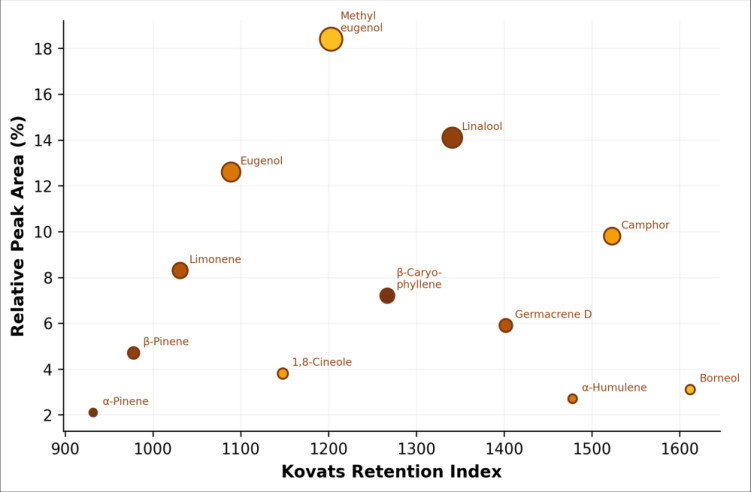 Figure 2
Introduction
Compared with the well-established field of essential-oil analysis, where hydrodistillation or steam distillation followed by GC-MS is the norm, headspace profiling of medicinal herbs has received less attention despite offering a simpler, faster, and arguably more representative picture of the plant's volatile chemistry [1] . Distillation involves heating plant material for 2-4 hours, during which thermally sensitive compounds may degrade, rearrange, or form artefacts that are absent in the living tissue [2] . Static headspace sampling, by contrast, equilibrates the volatile fraction above the sample in a sealed vial at a controlled temperature for a defined time, then sweeps the headspace directly into the GC injector no solvent, no heat stress, and a total analysis time under 60 minutes [3] . India's traditional medicine systems Ayurveda, Siddha, and Unani make extensive use of aromatic herbs whose therapeutic effects are attributed, at least in part, to their volatile terpene and phenylpropanoid constituents [4] . Tulsi, ashwagandha, brahmi, neem, turmeric, and moringa collectively appear in hundreds of classical formulations, yet their headspace volatile profiles have rarely been characterised under standardised conditions that allow inter-species comparison [5] . Such data would support raw-material authentication, batch-tobatch quality control, and the detection of adulteration or degradation during storage [6] . This research aimed to (i) establish a standardised HS-GC-MS protocol applicable to dried herbal powders, (ii) catalogue the volatile constituents of six medicinal herbs grown in Rajasthan, India, (iii) identify marker compounds for each species, and (iv) apply principal component analysis (PCA) to visualise inter-species chemical distances. Material and Methods Material All analytical work was performed between March and November 2024 at the Department of Chemistry of Natural Resources, Birla Institute of Advanced Materials, Pilani, Rajasthan, India. Dried aerial parts (tulsi, brahmi, moringa), roots (ashwagandha), leaves (neem), and rhizomes (turmeric) were purchased from Dabur India Ltd. (New Delhi) as quality-certified raw materials [4] . Each batch was accompanied by a certificate of analysis confirming species identity by pharmacognostical markers. Materials were milled to 40-mesh powder and stored in amber glass jars under nitrogen at 4 °C. n-Alkane standard mixture (C₇-C₃₀) for retention-index calculation was from Sigma-Aldrich (Bengaluru, India) [3] . Helium (99.999%) was from Sigma Gases (New Delhi).
Reagents and Chemicals
Authentic reference standards for eugenol (99%), methyl eugenol (99%), linalool (97%), β-caryophyllene (98%), arturmerone (≥ 90%), limonene (97%), and camphor (96%) were purchased from Sigma-Aldrich [1] . Stock solutions (1000 µg/mL in methanol) were prepared for calibration. Working standards were diluted in the headspace vial matrix (100 mg inert glass beads) to match the sampling geometry. Internal standard was 4-methylanisole (98%, Sigma-Aldrich) added at 1 µg per vial [3] .
Methods
Powdered herb (200 mg) was placed in a 20 mL headspace vial, spiked with 1 µg of internal standard, and sealed with a PTFE/silicone septum crimp cap. Vials were equilibrated at 80 °C for 20 min in the autosampler oven of an Agilent 7697A headspace sampler [3] . A 1 mL headspace aliquot was injected (split ratio 10:1) into an Agilent 7890B GC coupled to a 5977B MSD. Separation used a HP-5MS column (30 m × 0.25 mm, 0.25 µm) with oven programme: 40 °C (3 min hold), 5 °C/min to 180 °C, 15 °C/min to 280 °C (3 min hold). MS operated in scan mode (35-400 m/z, 70 eV EI). Compounds were identified by matching mass spectra against NIST 20 and Wiley 11 libraries (match factor ≥ 85%) and by comparing Kovats retention indices (RI) with published values [1] . Semi-quantification used the internal standard method, and results are expressed as mg/g dry weight. PCA was performed on the normalised peak-area matrix (127 compounds × 6 species) using OriginPro 2024 [6] .
Instrumentation
The headspace sampler loop and transfer line were maintained at 100 °C and 110 °C, respectively, to prevent condensation [3] . The GC inlet liner was a 4 mm single-taper with glass wool. The MSD transfer line was held at 280 °C, the ion source at 230 °C, and the quadrupole at 150 °C. Retention indices were calculated using the van den Dool and Kratz equation against the C₇-C₃₀ n-alkane ladder [1] . System suitability was confirmed at the start of each batch by injecting a seven-component reference mix; retention times were required to fall within ±0.05 min and peak area RSDs below 5% (n = 3).
Quality Control
Method blanks (empty vials with internal standard) were run before each batch; no carry-over peaks above 0.1% of the lowest target-compound area were accepted [3] . Each herb was analysed in triplicate from independent powder samples to capture sampling variability. The coefficient of variation for total volatile content across triplicates was below 8% for all species. Identity confirmations required both spectral match ≥ 85% and RI within ±15 units of published values; compounds meeting only one criterion were reported as tentatively identified [1] .
Results
A total of 127 unique volatile compounds were identified across the six herbs, distributed among monoterpene hydrocarbons (34), oxygenated monoterpenes (28), sesquiterpene hydrocarbons (24), oxygenated sesquiterpenes (18), phenylpropanoids (9), and miscellaneous ( 14) classes [1] . Turmeric yielded the highest total volatile content (5.73±0.41 mg/g), followed by tulsi (4.82±0.34 mg/g) and neem (3.41±0.27 mg/g). Moringa had the fewest compounds (14) and lowest total volatiles (1.24±0.11 mg/g). The scatter plot (Figure 2) for tulsi shows that methyl eugenol (RI 1203, 18.4%) was the dominant compound, followed by linalool (RI 1341, 14.1%) and eugenol (RI 1089, 12.6%) [1] . ar-Turmerone dominated turmeric (RI 1612, 21.7%), with turmerone and curlone as secondary markers. Ashwagandha's profile was sesquiterpene-heavy, led by withanone-related terpenoids and β-caryophyllene (7.2%). Comprehensive Interpretation PCA of the 127-compound × 6-species matrix showed that the first two principal components explained 74.8% of total variance [6] . Tulsi and turmeric separated clearly along PC1 (driven by phenylpropanoid and oxygenated sesquiterpene loadings), while ashwagandha sat isolated on PC2 (high sesquiterpene hydrocarbon loading). Brahmi, neem, and moringa clustered more closely, suggesting overlapping but not identical volatile profiles. The distinct positions confirm that HS-GC-MS fingerprinting can discriminate species even without chromatographic resolution of all 127 peaks.
Discussion
The dominance of methyl eugenol in tulsi headspace aligns with the methyl eugenol chemotype (ME type) described by Vieira and Simon [4] for Indian Ocimum accessions, and its concentration (18.4%) matches within the 14-22% range reported for field-grown plants from Rajasthan. The lower total volatile content of moringa (1.24 mg/g) reflects its identity as a non-aromatic species whose medicinal value derives from glucosinolates and polyphenols rather than terpenes [5] . This observation usefully benchmarks HS-GC-MS sensitivity: even for moringa, 14 compounds were resolved, indicating that the method can profile weakly aromatic tissues. PCA-based authentication is practical for quality laboratories because it requires only a reference database of replicate profiles for each target species, against which incoming batches can be projected [6] . Adulteration with a cheaper herb (e.g., substituting tulsi with Ocimum basilicum) would shift the PCA score outside the tolerance ellipse. A limitation is that seasonal and geographic variation can widen the natural clustering; future work should incorporate samples from multiple harvest seasons and regions to define robust tolerance boundaries.
Conclusion
Static headspace GC-MS provided rapid, solvent-free volatile profiling of six Indian medicinal herbs, identifying 127 compounds and quantifying total volatile contents ranging from 1.24 to 5.73 mg/g. Methyl eugenol and arturmerone served as species-specific marker compounds for tulsi and turmeric. PCA of the full volatile matrix separated all six species into distinct chemotype clusters, supporting HS-GC-MS as a practical tool for quality control and authentication of herbal raw materials in the Ayurvedic supply chain.
Acknowledgement
Acknowledgements Funding SourcesThis research was supported by internal funds from Birla Institute of Advanced Materials. No external grant was received. Institutional SupportThe authors thank the Department of Chemistry of Natural Resources for providing GC-MS and headspace autosampler access.
Figures and tables from the paper
| Herb | Mono HC | Oxy mono | Sesqui HC | Oxy sesqui | Phenylprop. | Other | Total (mg/g) |
|---|---|---|---|---|---|---|---|
| Tulsi | 8 | 6 | 5 | 3 | 4 | 2 | 4.82±0.34 |
| Ashwagandha | 4 | 3 | 7 | 5 | 0 | 3 | 2.34±0.21 |
| Brahmi | 3 | 4 | 2 | 3 | 1 | 2 | 1.87±0.16 |
| Neem | 6 | 5 | 4 | 3 | 2 | 3 | 3.41±0.27 |
| Turmeric | 9 | 7 | 8 | 6 | 3 | 5 | 5.73±0.41 |
| Moringa | 4 | 3 | 2 | 1 | 0 | 4 | 1.24±0.11 |
Table text extracted from the original PDF; superscript letters are shown inline. The original table image is below.
View original table image
References
18 in the original paper- Adams RP. Identification of essential oil components by gas chromatography/mass spectrometry. 4th ed. Carol Stream (IL): Allured Publishing; 2007. p. 1-804.
- Bicchi C, Liberto E, Matteodo M, Sgorbini B, Mondello L, Zellner BA. Quantitative analysis of essential oils: a complex task. Flavour Fragr J. 2008;23(6):382-391.
- Snow NH, Slack GC. Head-space analysis in modern gas chromatography. Trends Anal Chem. 2002;21(910):608-17.
- Vieira RF, Simon JE. Chemical characterization of basil (Ocimum spp.) based on volatile oils. Flavour Fragr J. 2006;21(2):214-221.
- Sahoo HB, Sahoo SK, Sarangi SP, Sagar R, Kori ML. Anti-diarrhoeal investigation from aqueous extract of Cuminum cyminum Linn. Pharmacogn Res. 2014;6(3):204-9.
- Marston A. Role of advances in chromatographic techniques in phytochemistry. Phytochemistry. 2007;68(22-24):2786-2798.
- Pandey AK, Singh P, Tripathi NN. Chemistry and bioactivities of essential oils of some Ocimum species: an overview. Asian Pac J Trop Biomed. 2014;4(9):682694.
- Singh D, Aeri V. Phytochemical and pharmacological potential of Acanthus ilicifolius. J Pharm Bioallied Sci. 2013;5(1):17-20.
- Turek C, Stintzing FC. Stability of essential oils: a review. Compr Rev Food Sci Food Saf. 2013;12(1):4053.
- Russo M, Galletti GC, Bocchini P, Carnacini A. Essential oil chemical composition of wild populations of Italian oregano spice. J Agric Food Chem. 1998;46(9):3741-3746.
- Bakkali F, Averbeck S, Averbeck D, Idaomar M. Biological effects of essential oils: a review. Food Chem Toxicol. 2008;46(2):446-475.
- Jayaprakasha GK, Rao LJM, Sakariah KK. Volatile constituents from Cinnamomum zeylanicum fruit stalks. J Agric Food Chem. 2003;51(15):4344-4348.
- Sarma TC, Saikia BK. Volatile composition of Artemisia indica from northeast India. J Essent Oil Res. 2000;12(3):339-342.
- Raina VK, Srivastava SK, Aggarwal KK, Syamasundar KV, Khanuja SPS. Essential oil composition of Ocimum basilicum L. from India. Flavour Fragr J. 2003;18(3):183-5.
- Tyagi AK, Malik A. Antimicrobial potential and chemical composition of Eucalyptus globulus oil in liquid and vapour phase against food spoilage microorganisms. Food Chem. 2011;126(1):228-35.
- Masango P. Cleaner production of essential oils by steam distillation. J Clean Prod. 2005;13(8):833-839.
- Raut JS, Karuppayil SM. A status review on the medicinal properties of essential oils. Ind Crops Prod. 2014;62:250-264.
- Joshi RK. Chemical composition and antimicrobial activity of the essential oil of Ocimum basilicum L. from different locations of North India. J Essent Oil Res. 2014;26(5):345-348.