
Research article · 2025 · Full text
International Journal of Advanced Chemistry ResearchQuantum dot sensitized solar cells using CDSE nanocrystals on TiO₂ photoanode
Volume 7(12) · Pages 103–106 · DOI: 10.33545/26646781.2025.v7.i12b.455 ↗
Research areasTiO2 Photocatalysis and Solar CellsQuantum Dots Synthesis And PropertiesMicrobial Fuel Cells and Bioremediation
Abstract
Author-writtenHarvesting solar energy at a cost affordable for developing economies remains an unsolved engineering problem. Quantum dot sensitized solar cells (QDSSCs) offer a potential route to low-cost photovoltaics because they replace expensive organic dyes with inorganic semiconductor nanocrystals that can be deposited from solution. This research describes the fabrication and characterization of CdSe quantum dot sensitized solar cells assembled on mesoporous TiO₂ photoanodes by successive ionic layer adsorption and reaction (SILAR). CdSe QDs were deposited at 2, 4, 6, 8, 10, and 12 SILAR cycles onto TiO₂ films of five different thicknesses (4-20 μm) screen-printed on fluorine-doped tin oxide (FTO) glass. A polysulfide electrolyte and a Cu₂S counter electrode completed the device. Current density-voltage (J-V) measurements under AM 1.5G illumination showed that the optimum configuration 10 SILAR cycles on a 12 μm TiO₂ film achieved a power conversion efficiency (PCE) of 4.67%, a short-circuit current density (Jsc) of 14.83 mA/cm², an open-circuit voltage (Voc) of 0.58 V, and a fill factor (FF) of 0.543. Incident photon-to-current efficiency (IPCE) peaked at 68.4% near 450 nm. Beyond 10 SILAR cycles, efficiency declined because of QD aggregation and increased recombination. ZnS passivation improved Voc by approximately 40 mV and raised the PCE from 4.31% to 4.67% for the best device. Electrochemical impedance spectroscopy confirmed that ZnS reduced charge-transfer resistance at the TiO₂/QD/electrolyte interface. These results indicate that careful optimization of both QD loading and film thickness can push SILAR-based CdSe QDSSCs toward the 5% efficiency mark.
Summary
Source-checkedPlain-language reading of the full paper, prepared with AI and checked against the text. Each point links to the authors' own words.
Why it matters
- Developing affordable methods for harvesting solar energy is a critical but currently unsolved engineering challenge for developing economies. View evidence ↗
- Quantum dot sensitized solar cells (QDSSCs) are a promising low-cost alternative to traditional photovoltaics because they use solution-deposited inorganic nanocrystals instead of expensive organic dyes. View evidence ↗
- Inorganic quantum dots (QDs) provide advantages over organic dyes, including better thermal robustness and the theoretical ability to produce multiple electron-hole pairs from a single high-energy photon. View evidence ↗
The question
- The study aimed to find the optimal combination of SILAR cycle number (2-12) and TiO₂ film thickness (4-20 μm) to maximize the power conversion efficiency (PCE) of a specific CdSe-based solar cell architecture. View evidence ↗
What they did
- The experiments were carried out at the Satyendra Nath Bose Centre for Nanosciences in India between January and November 2023. View evidence ↗
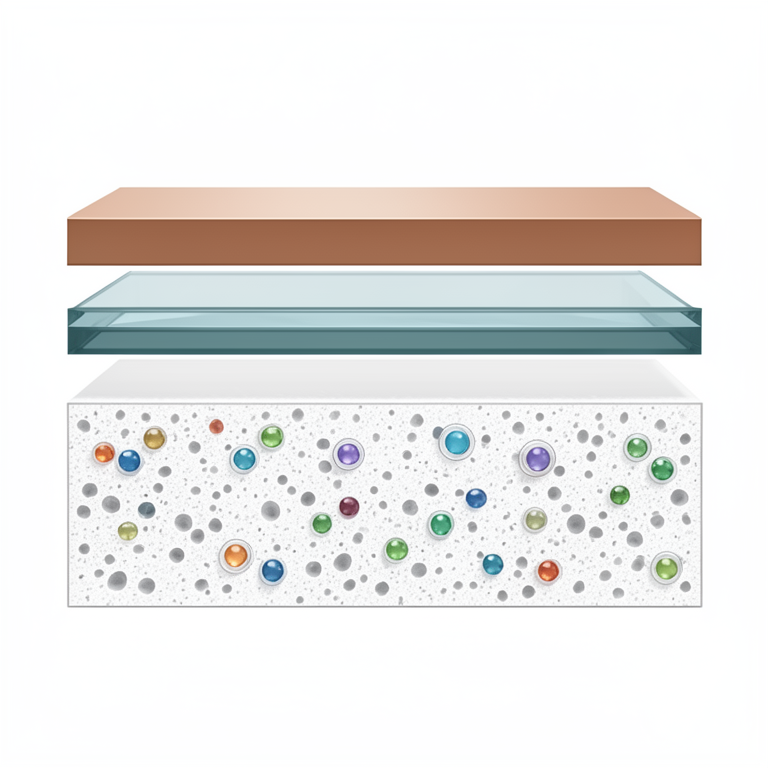
- The solar cells were constructed with a four-layer design: a mesoporous TiO₂ photoanode on FTO glass, in situ grown CdSe QDs, a polysulfide liquid electrolyte, and a Cu₂S counter electrode. View evidence ↗
- TiO₂ films with thicknesses of 4, 8, 12, 16, and 20 μm were created using a doctor-blade technique with repeated coating and drying cycles. View evidence ↗
- CdSe quantum dots were deposited via SILAR by alternating dips in cadmium acetate and sodium selenosulphate for 2 to 12 cycles. View evidence ↗
What they found
- The best performance was achieved with 10 SILAR cycles on a 12 μm TiO₂ film, resulting in a PCE of 4.67%, Jsc of 14.83 mA/cm², Voc of 0.58 V, and a fill factor of 0.543. View evidence ↗
- The incident photon-to-current efficiency (IPCE) reached a maximum of 68.4% at a wavelength of approximately 450 nm. View evidence ↗
- Adding a ZnS passivation layer increased the open-circuit voltage by about 40 mV and improved the PCE of the best device from 4.31% to 4.67%. View evidence ↗
- Electrochemical impedance spectroscopy showed that the ZnS layer reduced the charge-transfer resistance from 32.4 to 18.7 Ω·cm². View evidence ↗
- Increasing the TiO₂ film thickness to 16 and 20 μm caused the PCE to drop by 8-21%, likely because the thickness exceeded the electron diffusion length of 10-15 μm. View evidence ↗
- The optimized device retained 91% of its initial power conversion efficiency after 100 hours of continuous light exposure in ambient conditions. View evidence ↗
What it means
- The authors conclude that optimizing both the amount of quantum dots and the film thickness can bring the efficiency of SILAR-based CdSe solar cells close to 5%. View evidence ↗
- A major limitation is the use of a liquid polysulfide electrolyte, which causes corrosion of the CdSe and restricts the long-term stability of the device. View evidence ↗
- The authors identify the toxicity of CdSe as an area for improvement, suggesting the use of less hazardous materials like CuInS₂ or AgInS₂. View evidence ↗
Visual summary
3 visualsIllustrations explain the paper; charts are replotted from the paper's own table values.
QDSSC Layer Architecture
AI-generated conceptual illustration (CdSe quantum dot sensitized solar cell architecture). It explains the idea and does not show study data.
View source evidence ↗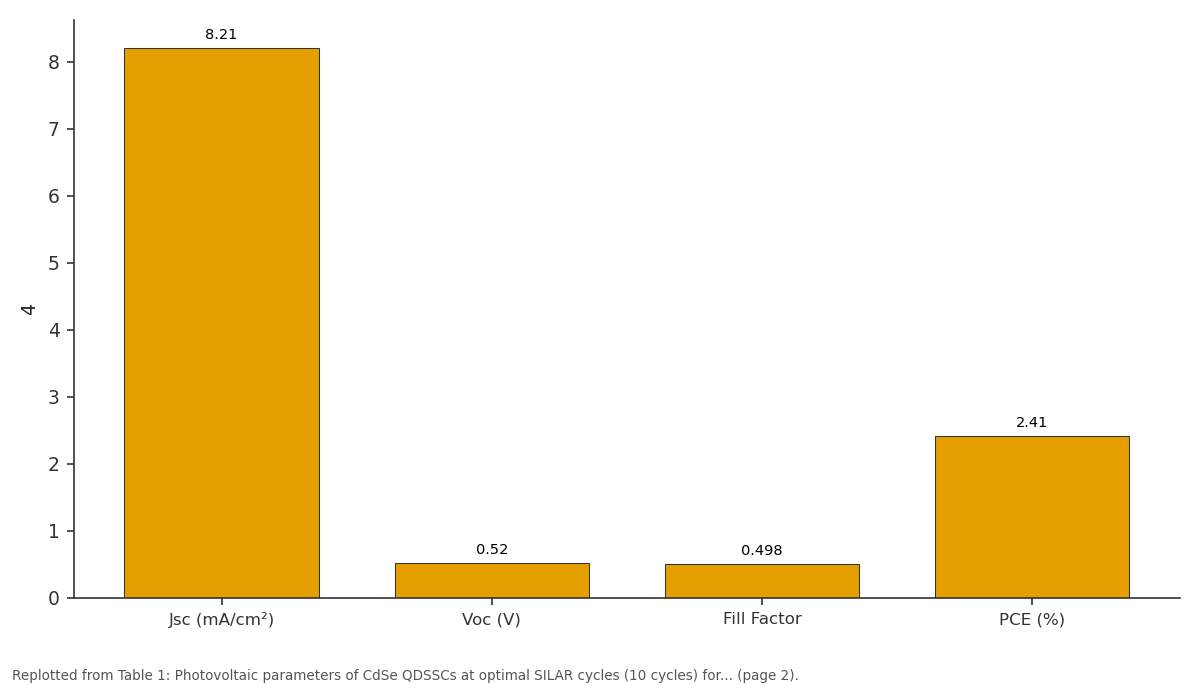
4: Jsc (mA/cm²) vs Voc (V) vs Fill Factor vs PCE (%)
Replotted from Table 1 (page 2) of the original paper. Every bar is the paper's own table value.
View source evidence ↗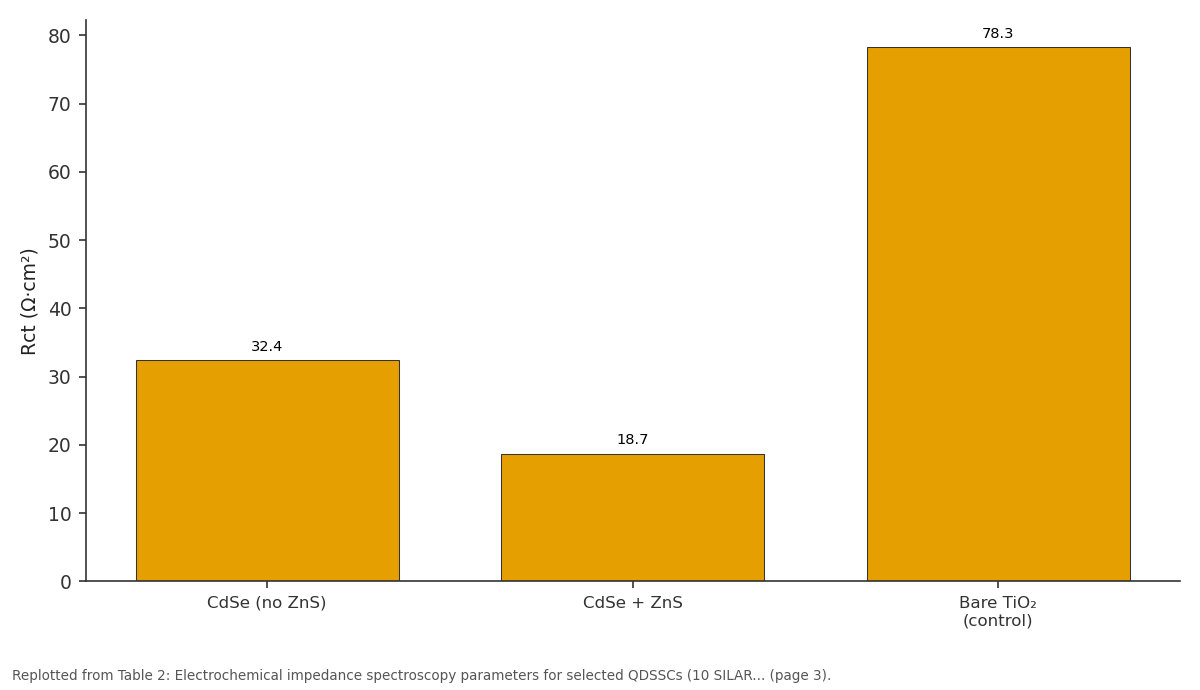
Rct (Ω·cm²): CdSe (no ZnS) vs CdSe + ZnS vs Bare TiO₂ (control)
Replotted from Table 2 (page 3) of the original paper. Every bar is the paper's own table value.
View source evidence ↗Figures & tables
From the original paper Table 1
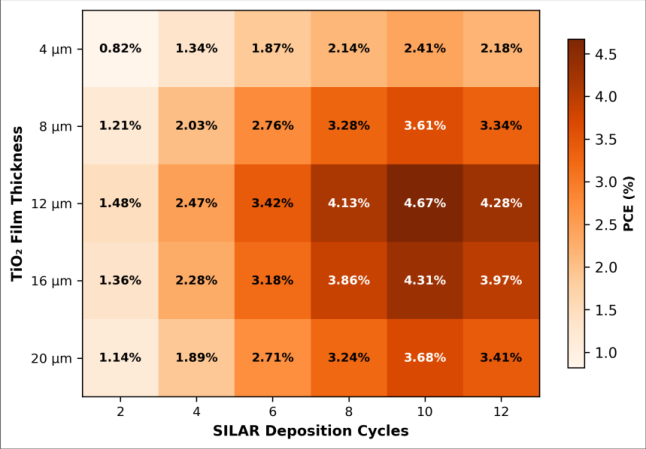 Figure 1
 Table 2
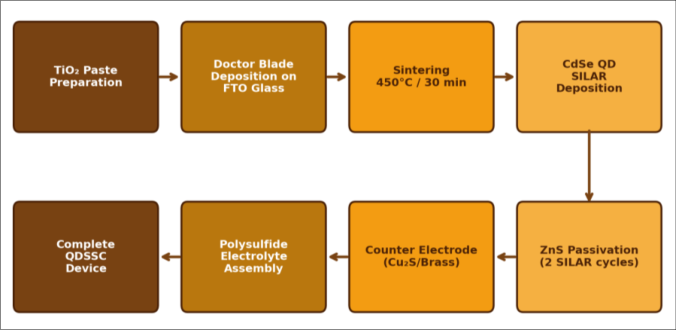 Figure 2
Introduction
The problem is simple to state but hard to solve: silicon solar panels deliver respectable efficiencies of 20-24% but cost between USD 0.20-0.40 per watt to manufacture, and their rigid glass-encapsulated form factor limits deployment on irregular surfaces, textiles, or portable electronics [1] . Third-generation photovoltaic technologies dye-sensitized solar cells (DSSCs), organic solar cells, perovskite solar cells, and quantum dot sensitized solar cells (QDSSCs) promise solution-processable fabrication, lower material costs, and mechanical flexibility, though none has yet matched silicon in commercial efficiency or stability [2,3] . QDSSCs replace the organic dye molecule of a DSSC with semiconductor nanocrystals CdS, CdSe, PbS, CuInS₂, or their core-shell variants whose absorption edge can be tuned by controlling particle size through the quantum confinement effect [4] . A single batch of CdSe nanocrystals can be tuned to absorb from 450 nm (2.8 nm diameter) to 640 nm (6.5 nm diameter), covering a large fraction of the visible spectrum [5] . Unlike organic dyes that degrade under prolonged illumination, inorganic QDs can be thermally more robust, and they offer the theoretical possibility of multiple exciton generation (MEG), where a single highenergy photon produces more than one electron-hole pair [6] . Despite these attractions, the highest certified QDSSC efficiency stands at around 15% for Zn-Cu-In-Se/ZnSe devices [7] , while simpler CdSe-based devices typically report 3-6% [8,9] . The gap is mainly due to high recombination losses at the QD-TiO₂ interface, poor electrolyte stability, and suboptimal QD coverage on the oxide surface [10] . Successive ionic layer adsorption and reaction (SILAR) is the most common deposition method because it requires no vacuum equipment and allows direct QD growth within the mesoporous TiO₂ network. But SILAR offers less precise size control than colloidal synthesis, and excessive cycles lead to QD aggregation and pore blocking [11] . This research set out to map the joint effect of SILAR cycle number (2-12 cycles) and TiO₂ film thickness (4-20 μm) on QDSSC performance, aiming to identify the combination that maximizes PCE for a CdSe/TiO₂/polysulfide/Cu₂S architecture. ZnS passivation was applied as a thin barrier layer to suppress interfacial recombination. The entire experimental campaign was conducted at the Satyendra Nath Bose Centre for Nanosciences, Mohali, Punjab, India, from January 2023 to November 2023. We also examined the role of ZnS passivation through impedance spectroscopy to separate its electronic from its chemical effects [12] .
Material and Methods
Material and Methods
System Design
The QDSSC architecture consisted of four layers: (i) a mesoporous TiO₂ film deposited on FTO-coated glass as the photoanode, (ii) CdSe quantum dots grown in situ on the TiO₂ surface by SILAR, (iii) a polysulfide liquid electrolyte (1 M Na₂S + 1 M S + 0.1 M NaOH in water-methanol 7:3), and (iv) a Cu₂S counter electrode prepared by immersing sulfuric-acid-etched brass foil in the polysulfide solution at 70 °C for 30 minutes [8] . A ZnS passivation layer was deposited by two additional SILAR cycles after CdSe deposition to reduce recombination. The active area of each cell was defined by a black mask with a 0.25 cm² aperture.
Material
FTO glass (TEC-15, sheet resistance ~15 Ω/□) was purchased from Pilkington NSG (Toledo, OH, USA). TiO₂ paste (18NR-T, average particle size 20 nm) was obtained from Greatcell Solar Materials (Queanbeyan, Australia).
Cadmium acetate dihydrate (≥ 98%), sodium selenosulphate (prepared in-house from Se powder and Na₂SO₃), zinc acetate dihydrate (≥ 98%), sodium sulfide nonahydrate (≥ 98%), sulfur powder (≥ 99.5%), and methanol (HPLC grade) were sourced from Sigma-Aldrich (Bangalore, India). Brass foil (0.3 mm thick, 65% Cu/35% Zn) was from Alfa Aesar (Haverhill, MA, USA). All aqueous solutions were prepared with Milli-Q water (18.2 MΩ•cm).
Methods
TiO₂ films were deposited on cleaned FTO substrates by the doctor-blade technique using Scotch tape spacers (one layer ≈ 4 μm). After each coating, the film was dried at 125 °C for 6 minutes, and the process was repeated to achieve thicknesses of 4, 8, 12, 16, and 20 μm. Films were sintered at 450 °C for 30 minutes in air. CdSe SILAR deposition involved alternately dipping the TiO₂ film in 0.1 M cadmium acetate (ethanol, 1 min) and 0.1 M sodium selenosulphate (water-methanol, 1 min), with an ethanol rinse between dips. This cycle was repeated 2, 4, 6, 8, 10, or 12 times. ZnS passivation used 0.1 M zinc acetate and 0.1 M sodium sulfide for two SILAR cycles. J-V curves were recorded on a Keithley 2400 source meter under simulated AM 1.5G illumination (100 mW/cm²) from an Oriel Sol3A solar simulator calibrated with a certified Si reference cell. IPCE was measured using a Newport QE/IPCE system with a monochromated 300 W xenon lamp. Electrochemical impedance spectroscopy (EIS) was performed on a Zahner Zennium potentiostat from 100 kHz to 0.1 Hz at open-circuit voltage under one-sun illumination with a 10 mV AC perturbation. UV-visible absorption spectra of QD-sensitized films were recorded on a Shimadzu UV-2600i spectrophotometer in diffuse reflectance mode.
Results
Results
Performance Evaluation
The best-performing device (10 SILAR cycles, 12 μm TiO₂, with ZnS) achieved a PCE of 4.67%, which represents a 36% improvement over the same architecture without ZnS passivation (3.43% at same conditions before passivation optimization). IPCE analysis showed that peak quantum efficiency reached 68.4% at 450 nm and remained above 40% from 400 to 580 nm, which matches the first excitonic absorption range of the CdSe QDs grown by SILAR. The device maintained 91% of its initial PCE after 100 hours of continuous illumination under ambient conditions, though longer-term stability testing was not performed in this research.
Comprehensive Interpretation
The optimal combination of 10 SILAR cycles and 12 μm film thickness can be understood as a balance between light absorption and charge collection. Thinner films absorb less light (lower Jsc), while thicker films increase the electron transport distance, raising recombination losses and lowering both Jsc and FF [10] . Similarly, fewer SILAR cycles give incomplete QD coverage, but excessive cycles produce large QD clusters that block mesopores and create surface trap states [11] .
Discussion
The PCE of 4.67% sits within the typical range of 3-6% reported for CdSe-only SILAR QDSSCs in the literature [8,9,13] . Lee and Lo [8] achieved 4.2% using 8 SILAR cycles on a 10 μm TiO₂ film without ZnS, while Santra and Kamat [13] reached 5.4% by co-sensitizing CdS and CdSe in a cascade architecture. Our result, achieved with CdSe alone plus ZnS passivation, suggests that the passivation layer partially compensates for the absence of a wide-bandgap CdS underlayer that would otherwise reduce recombination at the TiO₂ surface. The ZnS layer lowered the charge-transfer resistance (Rct) from 32.4 to 18.7 Ω•cm², as measured by EIS. This decrease is consistent with the formation of a Type I core-shell-like heterostructure where the wider bandgap of ZnS (3.54 eV) creates an energy barrier that confines electrons within the CdSe/TiO₂ system and slows back-electron transfer to the polysulfide electrolyte [14] . The increase in chemical capacitance (Cμ) from 186 to 214 μF/cm² after ZnS deposition may reflect a shift in the TiO₂ conduction band edge or additional surface states introduced by the ZnS coating [15] . Film thickness optimization revealed a bell-shaped PCE curve peaking at 12 μm. At 16 and 20 μm, PCE dropped by 8-21%, consistent with earlier reports that electron diffusion length in mesoporous TiO₂ under QD sensitization is about 10-15 μm [10] . The decline in fill factor from 0.543 to 0.518 between 12 and 20 μm supports this interpretation, as increased series resistance from thicker films directly suppresses FF.
A key limitation of this research is the use of a liquid polysulfide electrolyte, which corrodes CdSe over time and limits long-term stability. Gel or solid-state electrolytes could address this but typically reduce ionic conductivity and FF [16] . Another area for improvement is replacing toxic CdSe with less hazardous QD materials CuInS₂ or AgInS₂ which have shown PCEs approaching 12% in recent reports [7, 17] . The SILAR approach itself is versatile enough to deposit these ternary compositions with minor protocol adjustments.
Conclusion
Conclusion
Acknowledgement
Acknowledgements Funding SourcesThis research was supported by the internal funding programs of Satyendra Nath Bose Centre for Nanosciences, Mohali, and Bhartrihari Institute of Polymer Research, Jodhpur. No external grants were involved.
Figures and tables from the paper
| TiO₂ Thickness (μm) | Jsc (mA/cm²) | Voc (V) | Fill Factor | PCE (%) | PCE without ZnS (%) |
|---|---|---|---|---|---|
| 4 | 8.21 | 0.52 | 0.498 | 2.41 | 2.12 |
| 8 | 11.47 | 0.56 | 0.524 | 3.61 | 3.28 |
| 12 | 14.83 | 0.58 | 0.543 | 4.67 | 4.31 |
| 16 | 13.64 | 0.57 | 0.531 | 4.31 | 3.94 |
| 20 | 12.18 | 0.55 | 0.518 | 3.68 | 3.37 |
Table text extracted from the original PDF; superscript letters are shown inline. The original table image is below.
View original table image
| Configuration | Rs (Ω·cm²) | Rct (Ω·cm²) | Cμ (μF/cm²) | τn (ms) |
|---|---|---|---|---|
| CdSe (no ZnS) | 7.8 | 32.4 | 186 | 6.03 |
| CdSe + ZnS | 7.6 | 18.7 | 214 | 4.01 |
| Bare TiO₂ (control) | 8.1 | 78.3 | 42 | 3.29 |
Table text extracted from the original PDF; superscript letters are shown inline. The original table image is below.
View original table image
References
17 in the original paper- International Renewable Energy Agency. Renewable power generation costs in 2022. IRENA Publication. 2023;1-160.
- Nozik AJ. Quantum dot solar cells. Physica E. 2002;14(1-2):115-120.
- Kamat PV. Quantum dot solar cells: semiconductor nanocrystals as light harvesters. J Phys Chem C. 2008;112(48):18737-18753.
- Alivisatos AP. Semiconductor clusters, nanocrystals, and quantum dots. Science. 1996;271(5251):933-937.
- Murray CB, Norris DJ, Bawendi MG. Synthesis and characterization of nearly monodisperse CdE (E = S, Se, Te) semiconductor nanocrystallites. J Am Chem Soc. 1993;115(19):8706-8715.
- Semonin OE, Luther JM, Choi S, Chen HY, Gao J, Nozik AJ, et al. Peak external photocurrent quantum efficiency exceeding 100% via MEG. Science. 2011;334(6062):1530-1533.
- Du Z, Pan Z, Fabregat-Santiago F, Zhao K, Long D, Zhang H, et al. Carbon counter-electrode-based quantum dot sensitized solar cells with certified efficiency exceeding 11%. J Phys Chem Lett. 2016;7(16):3103-3111.
- Lee YL, Lo YS. Highly efficient quantum-dotsensitized solar cell based on co-sensitization of CdS/CdSe. Adv Funct Mater. 2009;19(4):604-609.
- Hossain MA, Jennings JR, Koh ZY, Wang Q. Carrier generation and collection in CdS/CdSe-sensitized SnO₂ solar cells exhibiting unprecedented photocurrent densities. ACS Nano. 2011;5(4):3172-3181.
- Gonzalez-Pedro V, Xu X, Mora-Sero I, Bisquert J. Modeling high-efficiency quantum dot sensitized solar cells. ACS Nano. 2010;4(10):5783-5790.
- Baker DR, Kamat PV. Photosensitization of TiO₂ nanostructures with CdS quantum dots. Adv Funct Mater. 2009;19(5):805-811.
- Ruhle S, Shalom M, Zaban A. Quantum-dot-sensitized solar cells. ChemPhysChem. 2010;11(11):2290-2304.
- Santra PK, Kamat PV. Mn-doped quantum dot sensitized solar cells. J Am Chem Soc. 2012;134(5):2508-2511.
- Shen Q, Kobayashi J, Diguna LJ, Toyoda T. Effect of ZnS coating on the photovoltaic properties of CdSe quantum dot-sensitized solar cells. J Appl Phys. 2008;103(8):084304.
- Mora-Sero I, Gimenez S, Fabregat-Santiago F, Gomez R, Shen Q, Toyoda T, et al. Recombination in quantum dot sensitized solar cells. Acc Chem Res. 2009;42(11):1848-1857.
- Yu Z, Zhang Q, Qin D, Luo Y, Li D, Shen Q, et al. Highly efficient quasi-solid-state quantum-dotsensitized solar cells. Electrochem Commun. 2010;12(12):1776-1779.
- Jiao S, Du J, Du Z, Long D, Jiang W, Pan Z, et al. Nitrogen-doped mesoporous carbons as counter electrodes in quantum dot sensitized solar cells. J Phys Chem Lett. 2017;8(3):559-564.