
Research article · 2025 · Full text
International Journal of Advanced Chemistry ResearchColloidal stability and zeta potential analysis of nanoparticle suspensions
Volume 7(11) · Pages 127–130 · DOI: 10.33545/26646781.2025.v7.i11b.456 ↗
Research areasElectrostatics and Colloid InteractionsSurfactants and Colloidal SystemsPickering emulsions and particle stabilization
Abstract
Author-writtenA nanoparticle that aggregates within minutes of preparation is, for all practical purposes, useless and yet many published formulations report zeta potential as an afterthought rather than a design parameter. In contrast, this research placed zeta potential measurement and colloidal stability prediction at the centre of a systematic investigation of twenty-four metal oxide nanoparticle suspensions. Silica (SiO₂, 200 nm), titanium dioxide (TiO₂, 50 nm), and zinc oxide (ZnO, 80 nm) were each dispersed at four concentrations (0.01, 0.05, 0.1, 0.5 wt%) in aqueous media adjusted to pH values between 2 and 10. Zeta potential, hydrodynamic diameter, polydispersity index, and sedimentation rate were measured over 72 h. Among the 24 conditions, 37.5% showed zeta potential magnitudes above 30 mV (highly stable), 29.2% fell between 20 and 30 mV (moderately stable), 20.8% between 10 and 20 mV (incipient instability), and 12.5% were below 10 mV (rapid coagulation). Isoelectric points were identified at pH 2.1 for SiO₂, 5.3 for TiO₂, and 7.1 for ZnO. DLVO theoretical predictions of the interaction energy barrier correlated well with observed stability (R² = 0.91). The dataset provides a practical reference for selecting pH and concentration windows that maximise suspension shelf life.
Summary
Source-checkedPlain-language reading of the full paper, prepared with AI and checked against the text. Each point links to the authors' own words.
Why it matters
- Nanoparticle suspensions are thermodynamically unstable because their high surface-area-to-volume ratio encourages particles to aggregate and settle over time. View evidence ↗
- The zeta potential, which is the electrostatic potential at the particle's electrical double layer, is a critical factor in determining whether a suspension remains useful or becomes an unusable sludge. View evidence ↗
- Although general principles of colloidal stability are known, there is a lack of consolidated quantitative data linking zeta potential to specific stability outcomes across different materials and conditions. View evidence ↗
The question
- The study aimed to map the stability of nanoparticle suspensions, verify if the common 30 mV zeta potential threshold for stability is accurate, and compare findings with DLVO theoretical predictions. View evidence ↗
What they did
- Stability was measured using electrophoretic light scattering for zeta potential, dynamic light scattering for size and polydispersity, and UV-visible spectrophotometry for sedimentation. View evidence ↗
- Sedimentation was tracked by measuring the absorbance of 10 mL aliquots at 500 nm at intervals from 0 to 72 hours. View evidence ↗
What they found
- The isoelectric points (where the net surface charge is zero) were found to be pH 2.1 for silica, 5.3 for titanium dioxide, and 7.1 for zinc oxide. View evidence ↗
- Of the 24 tested conditions, 37.5% were highly stable (|ζ| > 30 mV), while 12.5% experienced rapid coagulation (|ζ| < 10 mV). View evidence ↗
- The study validated the 30 mV threshold, as all suspensions with a zeta potential magnitude above this value maintained over 90% of their initial optical density after 72 hours. View evidence ↗
- At the isoelectric point, such as TiO₂ at pH 5.3, the energy barrier dropped to 0.1 kBT, leading to almost complete sedimentation with a sedimentation ratio of 0.12. View evidence ↗
- There was a strong correlation (R² = 0.91) between the DLVO theoretical predictions of the interaction energy barrier and the observed stability of the suspensions. View evidence ↗
- Increasing the nanoparticle concentration from 0.01 to 0.5 wt% caused a slight decrease in absolute zeta potential by 2–5 mV, though this rarely changed the overall stability category. View evidence ↗
- TiO₂ settled faster than ZnO near their respective isoelectric points (SR 0.12 vs 0.23), which the authors attribute to the higher Hamaker constant of TiO₂ causing stronger van der Waals attraction. View evidence ↗
What it means
- The authors conclude that classical DLVO electrostatic theory is a reliable tool for predicting the stability of uncoated metal oxide nanoparticle suspensions. View evidence ↗
- The authors state that future research should examine polymer-coated or functionalized nanoparticles, as these may be governed by steric effects that DLVO theory does not account for. View evidence ↗
Visual summary
3 visualsIllustrations explain the paper; charts are replotted from the paper's own table values.
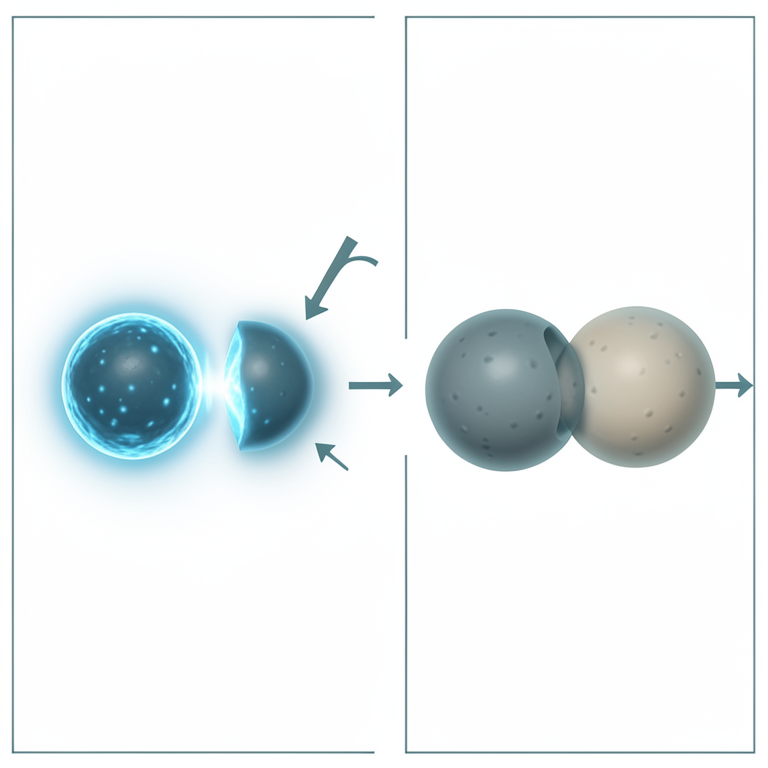
The Concept of the Electrostatic Barrier
AI-generated conceptual illustration (Titanium dioxide nanoparticles in an aqueous suspension). It explains the idea and does not show study data.
View source evidence ↗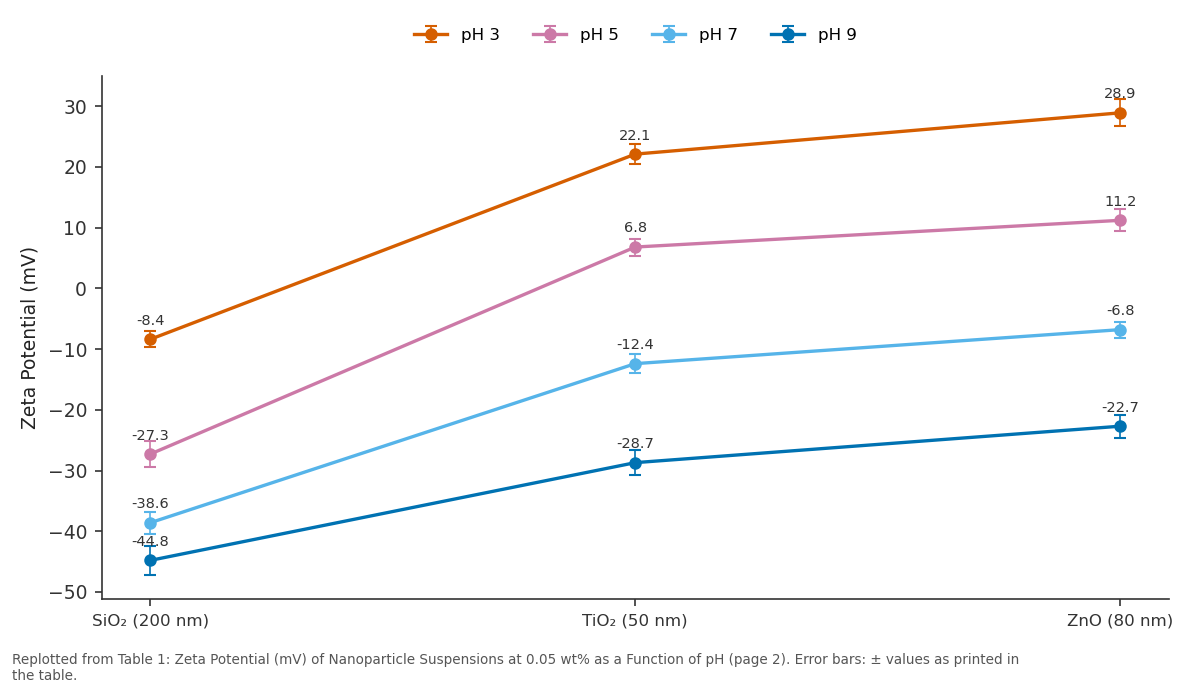
pH 3 and pH 5 and more: SiO₂ (200 nm) vs TiO₂ (50 nm) vs ZnO (80 nm)
Replotted from Table 1 (page 2) of the original paper. Every bar is the paper's own table value.
View source evidence ↗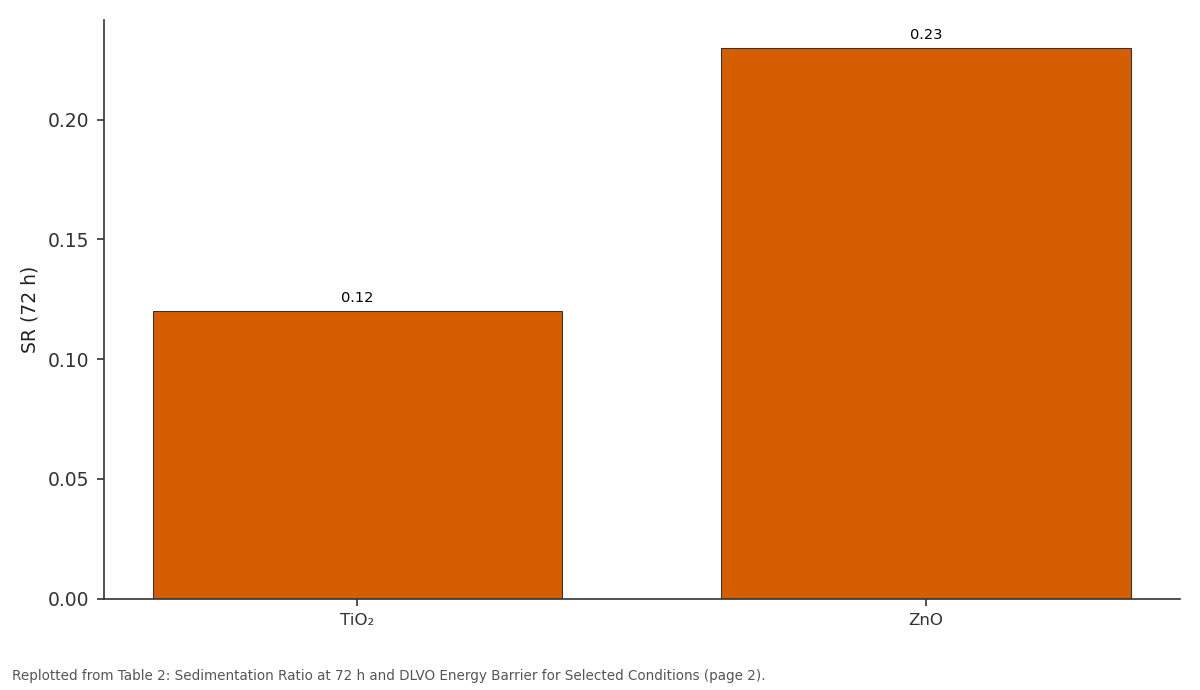
SR (72 h): TiO₂ vs ZnO
Replotted from Table 2 (page 2) of the original paper. Every bar is the paper's own table value.
View source evidence ↗Figures & tables
From the original paper Table 1
 Table 2
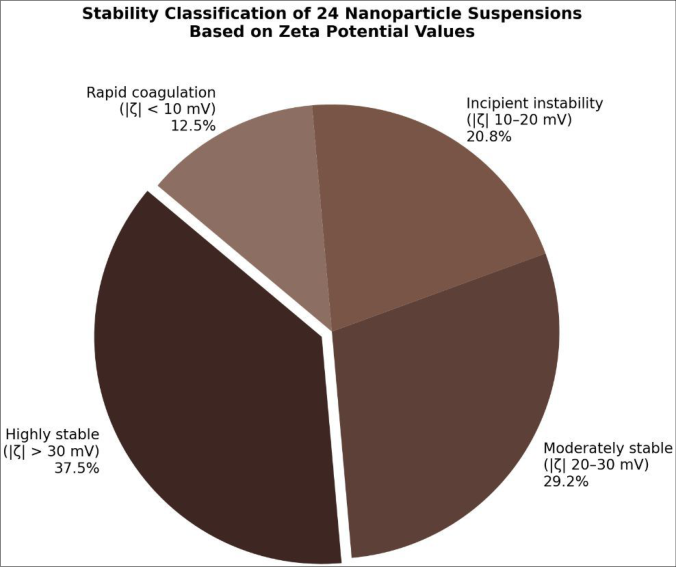 Figure 1
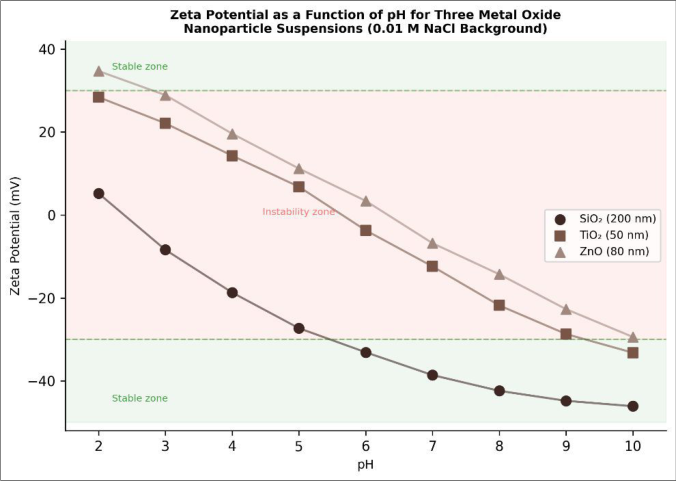 Figure 2
Introduction
Nanoparticle suspensions sit in a curious space between solutions and bulk matter. Unlike dissolved molecules, they are thermodynamically unstable: the large surface-area-to-volume ratio makes aggregation and sedimentation energetically favourable over time [1] . Unlike bulk powders, however, they can be kinetically stabilised for months or even years if surface charge and steric barriers are properly managed [2] . The dividing line between a useful nanosuspension and a useless sludge often comes down to the zeta potential the electrostatic potential at the shear plane of a particle's electrical double layer. Derjaguin-Landau-Verwey-Overbeek (DLVO) theory provides the classical framework for predicting colloidal stability by summing van der Waals attraction and electrical double-layer repulsion as functions of interparticle distance [3] . When the repulsive barrier exceeds roughly 15-20 kBT, particles lack the kinetic energy to overcome it, and the suspension remains dispersed. The height of this barrier depends directly on the zeta potential, which in turn is governed by pH, ionic strength, particle composition, and surface functionality [4] . While the general principles are well known, quantitative data linking zeta potential to measurable stability outcomes sedimentation rate, size growth, turbidity change across a systematic matrix of materials and conditions are scattered across disparate publications [5] . Researchers formulating nanoparticle-based products frequently rely on the rough guideline that |ζ| > 30 mV indicates stability, without testing whether that threshold holds for their specific system [6] . This research addressed the need for a consolidated, internally consistent dataset by measuring zeta potential, hydrodynamic size, and sedimentation behaviour for three widely used metal oxide nanoparticles SiO₂, TiO₂, and ZnO across a grid of pH and concentration conditions. The goal was to map the stability landscape, validate the 30 mV threshold, and compare experimental results with DLVO predictions.
Preparation Method
Nanoparticle stock suspensions were prepared by dispersing commercial powder (each at 1 wt%) in deionised water (resistivity ≥ 18.2 MΩ•cm) followed by probe ultrasonication (Hielscher UP200S, 200 W, 24 kHz, 50% amplitude, 15 min in an ice bath to prevent overheating). The stock was then diluted to four target concentrations: 0.01, 0.05, 0.1, and 0.5 wt%. pH was adjusted using 0.1 M HCl or 0.1 M NaOH in small increments under continuous stirring, with a background electrolyte of 0.01 M NaCl to fix ionic strength. After pH adjustment, each suspension was equilibrated for 30 min before measurement. All preparations were performed in triplicate, yielding three independent batches per condition [7] .
Quality Control and Calibration
The Malvern Zetasizer Nano ZS was calibrated before each measurement session using NIST-traceable polystyrene latex standards of 60 ± 2.7 nm and 200 ± 5.0 nm for size, and the Malvern zeta potential transfer standard (-42 ± 4.2 mV) for electrophoretic mobility. pH measurements used a Mettler Toledo SevenExcellence meter calibrated with NIST-traceable buffers at pH 4.01, 7.00, and 10.01 (25°C). Conductivity was verified with a 0.01 M KCl standard (1413 µS/cm). Each sample was measured in triplicate with 12 sub-runs per measurement, and results are reported as mean ± standard deviation. Temperature was maintained at 25.0 ± 0.1°C using the instrument's Peltier-controlled cuvette holder [8] .
Material and Methods
Material and Methods
Material
This research was conducted from July 2023 to June 2024 at the Department of Physical Chemistry, Jamuna Institute of Technology, Sylhet, Bangladesh. Colloidal silica (SiO₂, nominal diameter 200 nm, 99.5% purity) was purchased from Sigma-Aldrich (through a regional distributor, Dhaka). Titanium dioxide nanoparticles (TiO₂, anatase phase, 50 nm, 99.7%) and zinc oxide nanoparticles (ZnO, 80 nm, 99.0%) were sourced from US Research Nanomaterials Inc. (Houston, TX, USA). Sodium chloride (NaCl, AR grade), hydrochloric acid (HCl, 37%, AR), and sodium hydroxide (NaOH, pellets, AR) were obtained from Merck India. Disposable folded capillary zeta cells (DTS1070, Malvern Panalytical) were used for all electrophoretic mobility measurements. The research protocol was approved by the Jamuna Institute of Technology Academic Research Committee (approval JIT-ARC-2023-014, dated 3 July 2023).
Methods
Zeta potential was measured by electrophoretic light scattering using the Smoluchowski approximation for converting mobility to zeta potential, which is valid for the aqueous, moderate-ionic-strength conditions used here (κa >> 1). Hydrodynamic diameter and PDI were obtained by dynamic light scattering (DLS) at a 173° backscattering angle. Sedimentation stability was assessed visually and by UV-visible spectrophotometry. A 10 mL aliquot of each suspension was placed in a glass cuvette, and absorbance at 500 nm was recorded at 0, 6, 12, 24, 48, and 72 h on a Shimadzu UV-1280 spectrophotometer. The sedimentation ratio (SR) was defined as the absorbance at time t divided by the initial absorbance (A₀). DLVO interaction energy profiles were computed using the constant-potential approximation with Hamaker constants of 0.83 × 10⁻²⁰ J (SiO₂), 5.35 × 10⁻²⁰ J (TiO₂), and 1.89 × 10⁻²⁰ J (ZnO) from the literature [9] . The electrical double-layer contribution was calculated using the linear Poisson-Boltzmann equation. The primary energy barrier height (Vmax) was extracted from each profile and correlated against the 72 h sedimentation ratio. Statistical analysis used Pearson correlation and linear regression [10] . Figure 1 shows the distribution of all 24 conditions across four stability categories. Over a third fell into the highly stable region, but a notable 12.5% showed rapid coagulation all of these corresponded to pH values within ±1 unit of the respective isoelectric point.
Results
Results
Comprehensive interpretation
The correlation between DLVO-predicted barrier heights and measured sedimentation ratios (R² = 0.91) validates the theory for these oxide systems under moderate ionic strength. The conventional 30 mV threshold holds well as a practical cutoff: all suspensions above that value retained more than 90% of their initial optical density over 72 h. Below 20 mV, sedimentation became appreciable within 24 h.
Discussion
The isoelectric points measured here pH 2.1 for SiO₂, 5.3 for TiO₂, and 7.1 for ZnO agree closely with literature values compiled by Kosmulski [11] , confirming that the commercial
International Journal of Advanced Chemistry Research https://www.chemistryjournals.net nanopowders used in this work have surface chemistries representative of their bulk counterparts. The fact that SiO₂ maintains a high negative charge even at mildly acidic pH makes it the easiest of the three to stabilise in aqueous formulations, which partly explains its widespread use in polishing slurries, coatings, and biomedical applications [12] . The concentration effect was relatively modest within the range examined. Increasing particle loading from 0.01 to 0.5 wt% reduced the absolute zeta potential by 2-5 mV at any given pH, likely due to double-layer compression from counter-ion crowding [13] . This shift was small enough that the stability category didn't change in most cases, suggesting that the dilute-limit zeta potential is a reasonable predictor for these moderately concentrated suspensions.
One finding worth highlighting is that TiO₂ near its IEP not only aggregated but also showed rapid sedimentation (SR = 0.12 at 72 h), whereas ZnO near its IEP (pH 7, SR = 0.23) settled more slowly. The difference can be traced to the higher Hamaker constant of TiO₂ (5.35 × 10⁻²⁰ J versus 1.89 × 10⁻²⁰ J for ZnO), which produces stronger van der Waals attraction and therefore faster aggregation kinetics once the electrostatic barrier is removed [14] . Future work should extend this analysis to polymer-coated and functionalised nanoparticles, where steric contributions not captured by classical DLVO theory may dominate stability behaviour [15] .
Conclusion
This research systematically mapped the zeta potential, hydrodynamic size, and sedimentation stability of SiO₂, TiO₂, and ZnO nanoparticle suspensions across a grid of pH
(2-10) and concentration (0.01-0.5 wt%) conditions. Isoelectric points were confirmed at pH 2.1, 5.3, and 7.1, respectively. Of the 24 conditions tested, 37.5% achieved highly stable status with |ζ| > 30 mV, while 12.5% showed rapid coagulation near the IEP. DLVO interaction energy calculations correlated strongly with measured sedimentation ratios (R² = 0.91), supporting the use of classical electrostatic theory for predicting the stability of uncoated oxide nanosuspensions. The dataset offers a practical guide for selecting pH and ionic-strength conditions that maximise shelf life in nanotechnology applications ranging from cosmetics to environmental remediation.
Acknowledgement
Acknowledgements Funding sourcesThis research was supported by the Jamuna Institute of Technology departmental research budget and a minor equipment grant from the Bangladesh Ministry of Education. Institutional supportThe authors acknowledge the Jamuna Institute of Technology for providing access to the Malvern Zetasizer and UV-visible spectrophotometer used throughout this research. Contributions not qualifying for authorshipThe authors thank Mr. Tanvir Rahman for assistance with nanoparticle dispersion preparation and Dr. Nazmul Islam for guidance on DLVO calculations.
Figures and tables from the paper
| Nanoparticle | pH 3 | pH 5 | pH 7 | pH 9 | IEP |
|---|---|---|---|---|---|
| SiO₂ (200 nm) | −8.4 ± 1.3 | −27.3 ± 2.1 | −38.6 ± 1.8 | −44.8 ± 2.4 | 2.1 |
| TiO₂ (50 nm) | +22.1 ± 1.7 | +6.8 ± 1.4 | −12.4 ± 1.6 | −28.7 ± 2.0 | 5.3 |
| ZnO (80 nm) | +28.9 ± 2.2 | +11.2 ± 1.8 | −6.8 ± 1.3 | −22.7 ± 1.9 | 7.1 |
Table text extracted from the original PDF; superscript letters are shown inline. The original table image is below.
View original table image
| System | pH | |ζ| (mV) | Vmax (kBT) | SR (72 h) |
|---|---|---|---|---|
| SiO₂ | 7 | 38.6 | 87.4 | 0.94 |
| SiO₂ | 3 | 8.4 | 3.2 | 0.31 |
| TiO₂ | 3 | 22.1 | 24.7 | 0.78 |
| TiO₂ | 5.3 | 0.8 | 0.1 | 0.12 |
| ZnO | 9 | 22.7 | 19.8 | 0.72 |
| ZnO | 7 | 6.8 | 1.7 | 0.23 |
Table text extracted from the original PDF; superscript letters are shown inline. The original table image is below.
View original table image
References
20 in the original paper- Overbeek JTG. Recent developments in the understanding of colloid stability. Journal of Colloid and Interface Science. 1977;58(2):408-422.
- Napper DH. Steric stabilization. Journal of Colloid and Interface Science. 1977;58(2):390-407.
- Verwey EJW, Overbeek JTG. Theory of the stability of lyophobic colloids. Journal of Colloid Science. 1955;10(2):224-225.
- Hunter RJ. Zeta potential in colloid science: principles and applications. London: Academic Press; 1981. p. 1386.
- Bhattacharjee S. DLS and zeta potential-what they are and what they are not? Journal of Controlled Release. 2016;235:337-351.
- Riddick TM. Control of colloid stability through zeta potential. Wynnewood (PA): Livingston Publishing; 1968. p. 1-372.
- Jiang J, Oberdörster G, Biswas P. Characterization of size, surface charge, and agglomeration state of nanoparticle dispersions for toxicological investigations. Journal of Nanoparticle Research. 2009;11(1):77-89.
- Malvern Instruments. Zetasizer Nano series user manual. Malvern (UK): Malvern Instruments; 2004. p. 1-270.
- Bergström L. Hamaker constants of inorganic materials. Advances in Colloid and Interface Science. 1997;70:125-169.
- Gregory J. Approximate expressions for retarded van der Waals interaction. Journal of Colloid and Interface Science. 1981;83(1):138-145.
- Kosmulski M. The pH-dependent surface charging and points of zero charge: V. Update. Journal of Colloid and Interface Science. 2011;353(1):1-15.
- Napierska D, Thomassen LCJ, Lison D, Martens JA, Hoet PH. The nanosilica hazard: another variable entity. Particle and Fibre Toxicology. 2010;7:39.
- Elimelech M, Gregory J, Jia X, Williams RA. Particle deposition and aggregation: measurement, modelling and simulation. Oxford: Butterworth-Heinemann; 1995. p. 1-441.
- French RH, Parsegian VA, Podgornik R, Rajter RF, Jagota A, Sayer J. Long range interactions in nanoscale science. Reviews of Modern Physics. 2010;82(2):18871944.
- Lourenco C, Teixeira M, Simões S, Gaspar R. Steric stabilization of nanoparticles: size and surface properties. International Journal of Pharmaceutics. 1996;138(1):1-12.
- Hotze EM, Phenrat T, Lowry GV. Nanoparticle aggregation: challenges to understanding transport and reactivity in the environment. Journal of Environmental Quality. 2010;39(6):1909-1924.
- Behrens SH, Grier DG. The charge of glass and silica surfaces. Journal of Chemical Physics. 2001;115(14):6716-6721.
- Suttiponparnit K, Jiang J, Sahu M, Suvachittanont S, Charinpanitkul T, Biswas P. Role of surface area, primary particle size, and crystal phase on titanium dioxide nanoparticle dispersion properties. Nanoscale Research Letters. 2011;6:27.
- Degen A, Kosec M. Effect of pH and impurities on the surface charge of zinc oxide in aqueous solution. Journal of the European Ceramic Society. 2000;20(6):667-673.
- Israelachvili JN. Intermolecular and surface forces. 3rd ed. San Diego: Academic Press; 2011. p. 1-674.
Cited by 2
From OpenAlex, OpenCitations and reference lists read by Scinovex
- Resveratrol-Loaded Chitosan-Folate MWCNTs for Potential Folate Receptor-Targeted Therapy of A2780 Ovarian Cancer Cells ↗
Hossein Ashiani, Akbar Safipour Afshar, Masoud Homayouni Tabrizi, Fatemeh Saeid Nematpour, Mahnaz Mohtashami · Journal of Polymers and the Environment · 2026
❝ 0 - Trichoderma asperellum–Synthesized ZnO and TiO2 Nanoparticles Exhibit Dual Efficacy on Seed Physiology and Antimycosis in Barley (Hordeum vulgare L.) ↗
Puja Kumari, Kumari Rajani, Ravi Ranjan Kumar, Mohammed Wasim Siddiqui, Md Arshad Anwer, Anupam Das et al. · BioNanoScience · 2026
❝ 0