
Research article · 2021 · Full text
International Journal of Biology SciencesSocioeconomic status and livelihood dependency of inland fisherfolk communities along the gomti river basin: A multidimensional analysis
Volume 3(2) · Pages 73–77 · DOI: 10.33545/26649926.2021.v3.i2a.620 ↗
Research areasFisheries and Aquaculture StudiesSocial and Economic Development in IndiaAgricultural Innovations and Practices
Abstract
Author-writtenLivelihood dependency among inland fisherfolk remains poorly quantified in Indian river systems despite its direct bearing on rural poverty alleviation and food security. This research examined the socioeconomic conditions and livelihood patterns of fishing communities settled along the Gomti River basin in Uttar Pradesh, India. A structured household survey was administered to 284 fisherfolk households drawn from eight landing centres between March 2019 and February 2020, covering four districts Lucknow, Sultanpur, Jaunpur, and Barabanki. A Multidimensional Livelihood Dependency Index (MLDI) was constructed from 23 indicators grouped under five dimensions: economic capital, human capital, natural resource access, social networks, and institutional support. Results showed that 67.3% of sampled households depended on fishing as their main income source, earning a median monthly income of INR 8,740 from capture fisheries alone. The MLDI score ranged from 0.21 to 0.87, with a mean of 0.54, indicating moderate to high dependence on river-based resources. Households closer to urban centres displayed greater livelihood diversification and lower MLDI scores (mean 0.39) than those in remote stretches (mean 0.68). Educational attainment was low: 41.2% of household heads had no formal schooling, and only 12.7% completed secondary education. Credit access was limited, with 58.4% relying on informal moneylenders at interest rates between 36% and 60% per annum. Seasonal migration for wage labour affected 29.8% of families during the monsoon fishing ban. The findings point to an urgent need for targeted skill-building programmes, cooperative credit facilities, and seasonal safety-net schemes to reduce vulnerability among Gomti River fisherfolk.
Summary
Source-checkedPlain-language reading of the full paper, prepared with AI and checked against the text. Each point links to the authors' own words.
Why it matters
- Quantifying livelihood dependency among inland fisherfolk is critical because it directly impacts food security and the alleviation of rural poverty in India. View evidence ↗
- The Gomti River is a significant tributary of the Ganga, stretching approximately 960 kilometres and supporting fishing communities throughout several districts in Uttar Pradesh. View evidence ↗
- Previous studies on inland fisheries often relied solely on income, which fails to capture the complex, multidimensional nature of poverty and vulnerability. View evidence ↗
The question
- The study aimed to characterize the socioeconomic profile of fisherfolk, quantify their livelihood dependency via a composite index, and identify the factors driving variations in these scores. View evidence ↗
What they did
- Researchers surveyed 284 fisherfolk households across eight landing centres in the districts of Lucknow, Sultanpur, Jaunpur, and Barabanki from March 2019 to February 2020. View evidence ↗
- The study used descriptive statistics, Kruskal-Wallis H tests for district comparisons, and binary logistic regression to identify predictors of high dependency (defined as an MLDI score ≥ 0.60). View evidence ↗
What they found
- Fishing served as the primary income source for 67.3% of the sampled households, with a median monthly income of INR 8,740 from capture fisheries. View evidence ↗
- The overall mean MLDI score was 0.54 (ranging from 0.21 to 0.87), indicating that the communities have a moderate to high dependency on river resources. View evidence ↗
- Livelihood dependency varied by location: households near urban centers had lower MLDI scores (mean 0.39) compared to those in remote areas (mean 0.68). View evidence ↗
- Education levels were low among household heads, with 41.2% having no formal schooling and only 12.7% completing secondary education. View evidence ↗
- Limited access to formal credit led 58.4% of households to rely on informal moneylenders charging annual interest rates between 36% and 60%. View evidence ↗
- During the monsoon fishing ban, 29.8% of families were forced to migrate seasonally for wage labor. View evidence ↗
- Logistic regression showed that for every kilometer of distance from the nearest urban center, the odds of high livelihood dependency increased by 3.9%. View evidence ↗
- Higher education, ownership of crafts, membership in cooperatives, and access to formal credit were all factors that reduced the likelihood of high livelihood dependency. View evidence ↗
What it means
- The authors recommend that fisheries departments prioritize vocational training and skill-building in Sultanpur and Jaunpur, where dependency is highest. View evidence ↗
- To break the cycle of debt from informal moneylenders, the authors suggest strengthening or establishing cooperative credit societies at all sampled landing centers. View evidence ↗
- A limitation of the study is that it only included registered fisherfolk, excluding unregistered migrant fishers who might be more vulnerable. View evidence ↗
- The use of self-reported income data over a 12-month period may have introduced recall bias, especially regarding irregular earnings. View evidence ↗
Visual summary
1 visualsIllustrations explain the paper; charts are replotted from the paper's own table values.
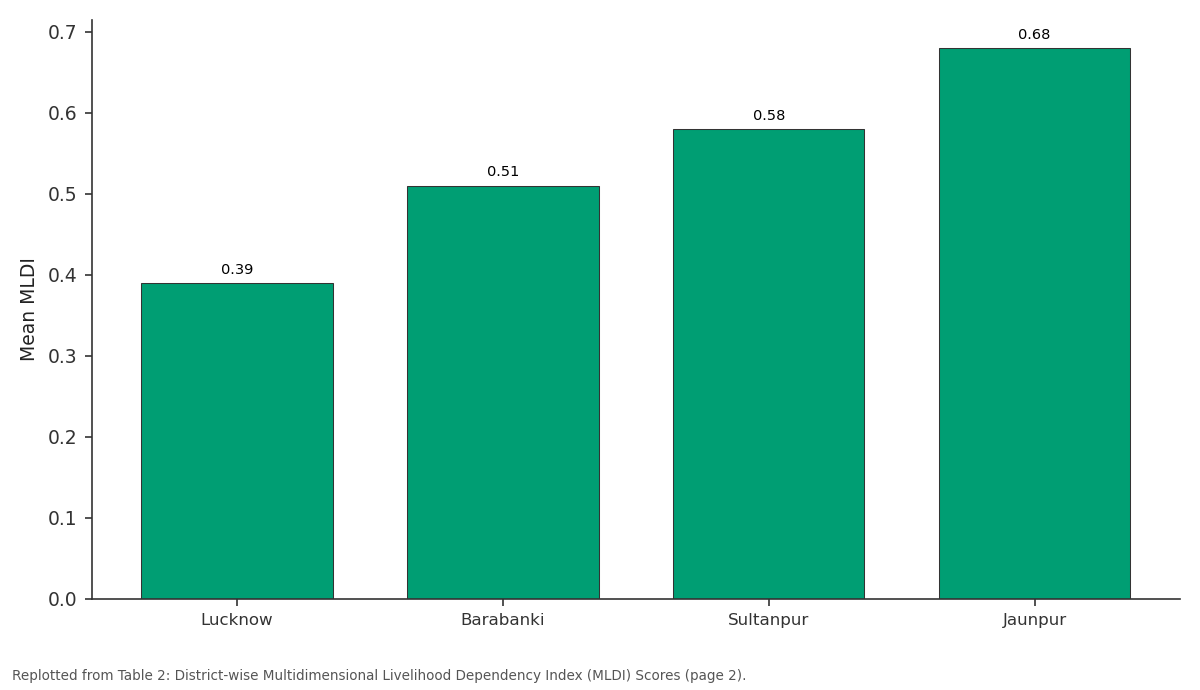
Mean MLDI: Lucknow vs Barabanki vs Sultanpur vs Jaunpur
Replotted from Table 2 (page 2) of the original paper. Every bar is the paper's own table value.
View source evidence ↗Figures & tables
From the original paper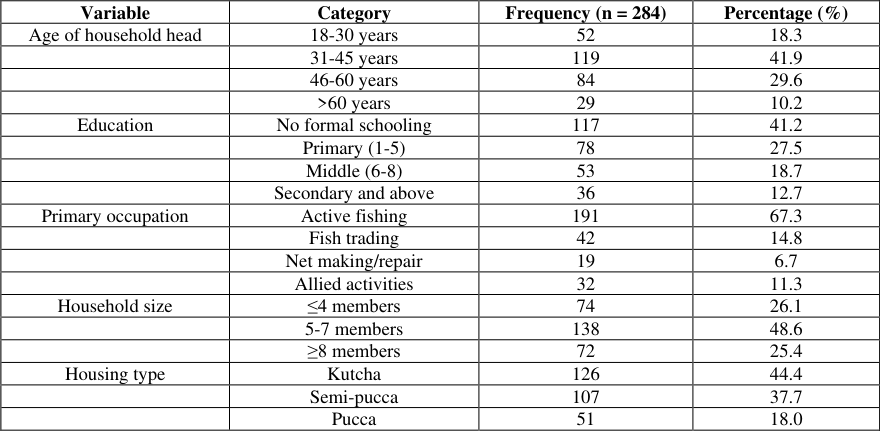 Table 1
 Table 2
 Table 3
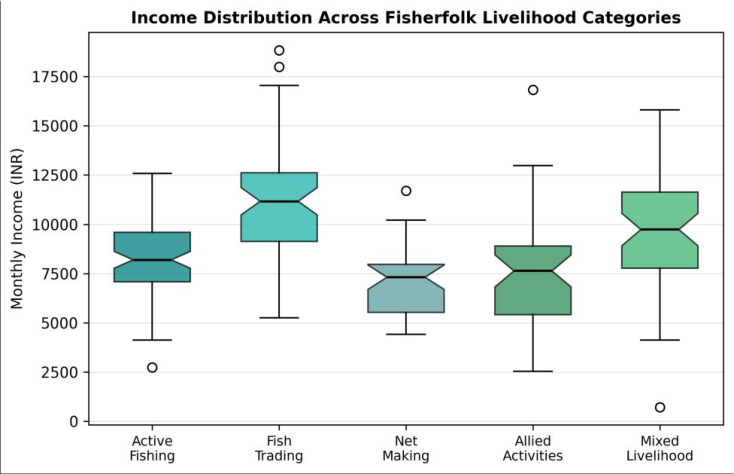 Figure 1
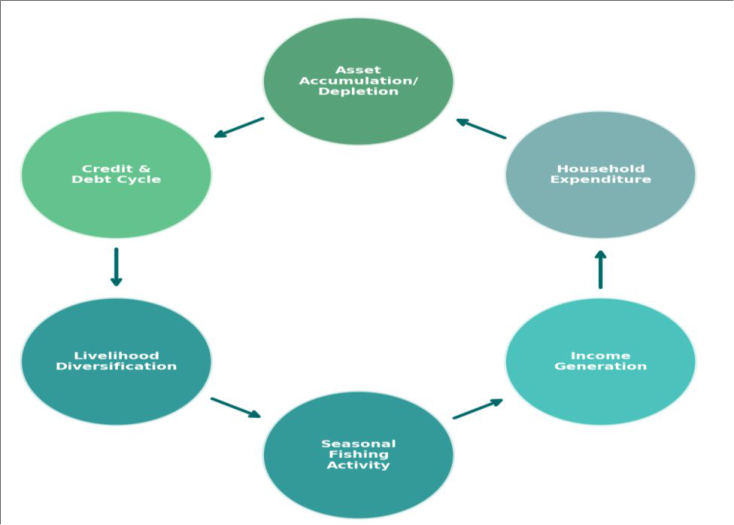 Figure 2
Introduction
Livelihood dependency, in the context of small-scale fisheries, refers to the degree to which a household's survival, income, nutrition, and social identity are tied to the harvesting and sale of aquatic resources. When that dependence is high and alternatives are few, even a modest decline in fish catch can push families below the poverty line. Along India's inland waterways, millions of artisanal fishers find themselves in exactly this position, yet the empirical evidence needed to design effective support programmes remains thin for many river basins. The Gomti River, a tributary of the Ganga, flows roughly 960 kilometres through Uttar Pradesh and sustains fishing communities across several districts. Earlier surveys by the Central Inland Fisheries Research Institute (CIFRI) and state fisheries departments documented declining catch per unit effort in middle and lower Gomti stretches during the early 2010s, attributed to rising pollution loads, sand mining, and altered flow regimes from upstream barrages. But those assessments concentrated on biological productivity and paid little attention to the human dimension how fishing households organise their labour, manage seasonal income gaps, or cope with external shocks. Socioeconomic profiling of fisherfolk has a long tradition in coastal fisheries research. Researchers like Kurien (1995) [8] and Salagrama (2006) [10] mapped asset ownership, debt burdens, and occupational mobility among marine fishing villages of Kerala and Andhra Pradesh. For inland fisheries, comparable work exists for the Ganga mainstem, Chilika Lake, and selected reservoirs in Madhya Pradesh and Rajasthan, but the Gomti basin has received far less scrutiny despite supporting an estimated 18,000 active fishers.
Two gaps stand out. First, most earlier inland studies relied on a single indicator usually income to classify livelihood status, which obscures the multidimensional nature of poverty and vulnerability. Second, spatial heterogeneity along a river's course is seldom factored in; upstream fishing hamlets near Lucknow face different market access, pollution exposure, and governance conditions than downstream hamlets near Jaunpur. This research addressed both gaps. It constructed a Multidimensional Livelihood Dependency Index (MLDI) covering economic, human, natural, social, and institutional dimensions, and applied it across four districts representing different segments of the Gomti basin. The objectives were threefold: (a) to characterise the socioeconomic profile of fisherfolk households, (b) to quantify livelihood dependency using a composite index, and (c) to identify spatial and demographic factors that explain variation in dependency scores.
Research area description
The Gomti River originates near Madho Tanda in the Pilibhit district of Uttar Pradesh and merges with the Ganga near Kaithi in Ghazipur district. The research covered four districts along the middle and lower Gomti: Lucknow (urban-proximate), Barabanki (semi-urban), Sultanpur (semi-rural), and Jaunpur (predominantly rural). Two landing centres were selected per district, yielding eight sampling sites spread over roughly 380 river-kilometres. The region experiences a subtropical monsoon climate with mean annual rainfall of 950-1,050 mm concentrated between June and September. Historically, the Gomti supported a diverse ichthyofauna of over 80 species, though recent ecological surveys have reported localised declines in commercially valued species such as Labeo rohita, Catla catla, and Wallago attu, particularly in stretches downstream of Lucknow city.
Materials and Methods
Materials and Methods
Materials
Primary data were gathered through face-to-face interviews using a pre-tested, semi-structured household questionnaire administered in Hindi. The questionnaire contained 74 items organised under six modules: household demographics, asset ownership, fishing effort and catch, income and expenditure, credit and debt, and institutional engagement. Secondary data on river hydrology, fish production statistics, and poverty indicators were sourced from the Uttar Pradesh Directorate of Fisheries, CIFRI annual reports (2015-2019), and district statistical handbooks. A pilot test was conducted with 30 households in Lucknow in January 2019 to refine question wording and skip patterns. Data collection ran from March 2019 to February 2020, ensuring coverage of all three fishing seasons pre-monsoon, monsoon ban period, and post-monsoon.
Methods
A multistage sampling procedure was adopted. In the first stage, four districts were purposively selected to represent an urbanrural gradient along the Gomti. In the second stage, two fish-landing centres per district were chosen based on active fisher population registers maintained by district fisheries officers. In the third stage, households were selected by systematic random sampling from those registers, yielding a total sample of 284 households (36 ± 2 per landing centre). The Multidimensional Livelihood Dependency Index (MLDI) was constructed following Alkire and Foster's (2011) [2] counting approach adapted for fisheries livelihoods. Twenty-three binary or normalised indicators were grouped under five equally weighted dimensions: economic capital (5 indicators), human capital (5), natural resource access (4), social networks (5), and institutional support (4). A household was classified as 'deprived' on an indicator if its value fell below a dimensionspecific threshold derived from the sample median. The aggregate MLDI score ranged from 0 (no deprivation on any indicator) to 1 (deprived on all). Data were analysed in SPSS 23.0 and R 3.6. [1,4] . A clear spatial gradient in livelihood dependency emerged (Table 2). Jaunpur recorded the highest mean MLDI (0.68), while Lucknow had the lowest (0.39). The Kruskal-Wallis test confirmed that inter-district differences were statistically significant (H = 74.3, df = 3, p<0.001). Post-hoc pairwise comparisons showed that all district pairs differed significantly except Barabanki-Sultanpur (p = 0.062). The logistic regression model (Nagelkerke R² = 0.41, Hosmer-Lemeshow p = 0.38) identified six significant predictors of high dependency (Table 3). Distance from the nearest urban centre increased the odds of high MLDI by 3.9% per kilometre.
| Predictor Variable | B | SE | Wald χ² | Odds Ratio | p-value |
|---|---|---|---|---|---|
| Distance from urban centre (km) | 0.038 | 0.011 | 11.94 | 1.039 | 0.001 |
| Education (years of schooling) | −0.214 | 0.065 | 10.84 | 0.807 | 0.001 |
| Household size | 0.187 | 0.078 | 5.75 | 1.206 | 0.017 |
| Craft ownership (yes = 1) | −0.624 | 0.241 | 6.71 | 0.536 | 0.010 |
| Cooperative membership (yes = 1) | −0.893 | 0.298 | 8.98 | 0.410 | 0.003 |
| Access to formal credit (yes = 1) | −0.712 | 0.274 | 6.75 | 0.491 | 0.009 |
| Constant | 1.247 | 0.483 | 6.66 | 0.010 |
Table text extracted from the original PDF; superscript letters are shown inline. The original table image is below.
View original table image
| District | n | Mean MLDI | Median | SD | Range |
|---|---|---|---|---|---|
| Lucknow | 74 | 0.39 | 0.37 | 0.12 | 0.21-0.64 |
| Barabanki | 68 | 0.51 | 0.49 | 0.14 | 0.24-0.79 |
| Sultanpur | 72 | 0.58 | 0.57 | 0.13 | 0.29-0.83 |
| Jaunpur | 70 | 0.68 | 0.69 | 0.11 | 0.38-0.87 |
| Overall | 284 | 0.54 | 0.53 | 0.16 | 0.21-0.87 |
Table text extracted from the original PDF; superscript letters are shown inline. The original table image is below.
View original table image
Education, craft ownership, cooperative membership, and access to formal credit each reduced the odds of falling into the high-dependency category. The cyclical relationship depicted in Figure 2 traces how seasonal fishing drives income, which funds household consumption, shapes asset trajectories, feeds into debt obligations, and ultimately pushes or pulls households toward diversification. For high-MLDI households, the cycle tends to reinforce dependency: low catches during the monsoon ban compress income, force borrowing at usurious rates, erode assets, and leave little surplus for investment in alternative skills.
Comprehensive interpretation
Taken together, the quantitative evidence paints a picture of fishing communities trapped in a low-income, low-asset equilibrium. The MLDI captured dimensions that a single income measure would miss access to cooperatives, children's school attendance, and distance to extension services all contributed independently to the composite score. Spatial analysis confirmed that proximity to urban markets and government offices correlates with lower dependency, a finding with direct implications for the placement of welfare infrastructure.
Discussion
The mean MLDI of 0.54 observed in this research indicates that Gomti basin fisherfolk experience moderate to high livelihood dependency on river resources, a finding broadly consistent with assessments from comparable Indian river systems. Sharma and Singh (2017) [11] reported mean composite vulnerability scores of 0.49-0.61 among Ganga fishers in Bihar, while Dey et al. (2016) [16] documented similar patterns in the Mahanadi delta where income diversification was limited by low educational attainment. The sharp urban-rural gradient Lucknow's mean MLDI was nearly half that of Jaunpur deserves attention. Urban proximity provides fisherfolk with access to wholesale fish markets, coldstorage facilities, micro-finance institutions, and government extension counters that are absent or weakly functional in remote stretches. This echoes Béné's (2003) [3] observation that the 'geography of poverty' in small-scale fisheries is shaped as much by institutional access as by natural resource abundance. Educational deprivation emerged as both a symptom and a driver of high dependency. Households where the head had no schooling were 2.4 times more likely to fall into the high-MLDI category than those where the head finished secondary school. Similar education-livelihood linkages have been documented by Allison and Horemans (2006) [1] for African inland fisheries and by Salagrama (2006) [10] for Indian coastal communities.
Acknowledgement
AcknowledgementsWe gratefully acknowledge the support provided by the authorities for this research.
Figures and tables from the paper
| Variable | Category | Frequency (n = 284) | Percentage (%) |
|---|---|---|---|
| Age of household head | 18-30 years | 52 | 18.3 |
| 31-45 years | 119 | 41.9 | |
| 46-60 years | 84 | 29.6 | |
| >60 years | 29 | 10.2 | |
| Education | No formal schooling | 117 | 41.2 |
| Primary (1-5) | 78 | 27.5 | |
| Middle (6-8) | 53 | 18.7 | |
| Secondary and above | 36 | 12.7 | |
| Primary occupation | Active fishing | 191 | 67.3 |
| Fish trading | 42 | 14.8 | |
| Net making/repair | 19 | 6.7 | |
| Allied activities | 32 | 11.3 | |
| Household size | ≤4 members | 74 | 26.1 |
| 5-7 members | 138 | 48.6 | |
| ≥8 members | 72 | 25.4 | |
| Housing type | Kutcha | 126 | 44.4 |
| Semi-pucca | 107 | 37.7 | |
| Pucca | 51 | 18.0 |
Table text extracted from the original PDF; superscript letters are shown inline. The original table image is below.
View original table image
References
16 in the original paper- Allison EH, Horemans B. Putting the principles of the sustainable livelihoods approach into fisheries development policy and practice. Marine Policy. 2006;30(6):757-766.
- Alkire S, Foster J. Counting and multidimensional poverty measurement. Journal of Public Economics. 2011;95(78):476-487.
- Béné C. When fishery rhymes with poverty: A first step beyond the old paradigm on poverty in small-scale fisheries. World Development. 2003;31(6):949-975.
- Das MK, Sharma AP, Vass KK, Tyagi RK, Suresh VR, Naskar M, Akolkar AB. Fish diversity, community structure and ecological integrity of the tropical River Ganges, India. Aquatic Ecosystem Health and Management. 2013;16(4):395-407.
- Dey MM, Rab MA, Paraguas FJ, Piumsombun S, Bhatta R, Alam MF, Ahmed M. Fish consumption and food security: a disaggregated analysis by types of fish and classes of consumers in selected Asian countries. Aquaculture Economics and Management. 2005;9(1-2):89-111.
- Jentoft S, Chuenpagdee R. Fisheries and coastal governance as a wicked problem. Marine Policy. 2009;33(4):553-560.
- Katiha PK, Jena JK, Pillai NGK, Chakraborty C, Dey MM. Inland aquaculture in India: past trend, present status and future prospects. Aquaculture Economics and Management. 2005;9(1-2):237-264.
- Kurien J. The Kerala model: its central tendency and the outlier. Social Scientist. 1995;23(1-3):70-90.
- Neiland AE, Béné C. Poverty and small-scale fisheries in West Africa. FAO Fisheries and Aquaculture Technical Paper. 2004;481:1-108.
- Salagrama V. Trends in poverty and livelihoods in coastal fishing communities of Orissa State, India. FAO Fisheries Technical Paper. 2006;490:1-111.
- Sharma L, Singh SP. Socio-economic status of fish farmers and fishers of Bihar, India. Journal of Applied and Natural Science. 2017;9(3):1489-1494.
- Srinath M, Kuriakose S, Mini KG. Methodology for estimation of marine fish landings in India. Central Marine Fisheries Research Institute Special Publication. 2005;86:157.
- Das MK, Vass KK, Srivastava PK, Dey S. Assessing the impact of climate change on inland fisheries in River Ganga and its plains in India. Aquatic Ecosystem Health and Management. 2009;12(2):138-151.
- Welcomme RL. Inland fisheries: ecology and management. Oxford: Blackwell Science; 2001. p. 1-358.
- WorldFish Center. The threat to fisheries and aquaculture from climate change. WorldFish Center Policy Brief. 2007;1654:1-8.
- Dey S, Thiede RC, Schildgen TF, Wittmann H, Bookhagen B, Scherler D, Strecker MR. Holocene internal shortening within the northwest Sub-Himalaya: Out-of-sequence faulting of the Jwalamukhi Thrust, India. Tectonics. 2016 Nov;35(11):2677-97.