
Research article · 2025 · Full text
International Journal of Advanced Chemistry ResearchDiffusion coefficients of electrolytes in aqueous solutions measured by Taylor dispersion
Volume 7(3) · Pages 156–159 · DOI: 10.33545/26646781.2025.v7.i3c.422 ↗
Research areasDiffusion Coefficients in LiquidsThermodynamic properties of mixturesChemical and Physical Properties in Aqueous Solutions
Abstract
Author-writtenAccurate diffusion coefficients are the kind of data that nobody finds exciting until they need one and then discover that published values disagree by 5-10% or were measured decades ago under poorly documented conditions. Taylor dispersion analysis (TDA) offers a modern, fast, and automated alternative to the classical diaphragm-cell method for measuring mutual diffusion coefficients in liquid solutions. This research applied TDA with UV detection at 210 nm to three binary electrolyte systems NaCl, KCl, and CaCl₂ in water at seven concentrations (0.01-1.0 M) and six temperatures (15-40°C). Measured diffusion coefficients (D) ranged from 0.961 × 10⁻⁵ cm²/s (CaCl₂, 1.0 M, 15°C) to 2.587 × 10⁻⁵ cm²/s (KCl, 0.01 M, 40°C). D decreased with increasing concentration for all three salts, following the Onsager-Fuoss prediction, and increased with temperature in accordance with the Stokes-Einstein relation. Agreement with literature diaphragm-cell data was within 1.4% on average. The Nernst-Hartley equation predicted infinite-dilution values within 0.8% of our extrapolated D⁰. These results establish TDA as a reliable, high-throughput method for generating the diffusion data that chemical engineers and pharmacists need for process design and drug-dissolution modelling.
Summary
Source-checkedPlain-language reading of the full paper, prepared with AI and checked against the text. Each point links to the authors' own words.
Why it matters
- Diffusion is a critical process for applications ranging from drug dissolution in the gut to the spread of pollutants in rivers, but reliable data for common electrolytes at non-standard conditions are scarce. View evidence ↗
- The traditional diaphragm-cell method for measuring diffusion is accurate but inefficient, requiring 24-72 hours per measurement and frequent calibration. View evidence ↗
- Taylor dispersion analysis (TDA) is a modern, automated, and faster alternative to the diaphragm-cell method for determining mutual diffusion coefficients. View evidence ↗
The question
- The study aimed to measure the diffusion coefficients (D) of NaCl, KCl, and CaCl₂ across various concentrations and temperatures using TDA and validate these results against existing literature and theoretical predictions. View evidence ↗
What they did
- The researchers used ACS reagent grade NaCl, KCl, and CaCl₂ to prepare aqueous solutions at seven concentrations: 0.01, 0.02, 0.05, 0.1, 0.2, 0.5, and 1.0 mol/L. View evidence ↗
- Measurements were conducted using an Agilent 1260 Infinity II HPLC system with a 1.5 m fused-silica capillary (250 µm ID), injecting 0.1 µL of solution into a water carrier pumped at 0.05 mL/min. View evidence ↗
- Diffusion coefficients were calculated using the Taylor-Aris equation based on the variance of Gaussian peaks captured via UV detection at 210 nm. View evidence ↗
- The study tested temperatures from 15 to 40°C in 5°C increments, with each condition measured in quintuplicate. View evidence ↗
What they found
- The measured diffusion coefficients ranged from a minimum of 0.961 × 10⁻⁵ cm²/s for 1.0 M CaCl₂ at 15°C to a maximum of 2.587 × 10⁻⁵ cm²/s for 0.01 M KCl at 40°C. View evidence ↗
- Among the salts tested, KCl consistently exhibited the highest diffusion coefficients, followed by NaCl, while CaCl₂ was the slowest. View evidence ↗
- Diffusion coefficients decreased as concentration increased from 0.01 to 1.0 M, with a total drop of 16-28% across the salts; CaCl₂ showed the most significant decrease at 28%. View evidence ↗
- Increasing the temperature from 15 to 40°C resulted in a 72-77% increase in diffusion coefficients for all three salts, aligning with the Stokes-Einstein relationship. View evidence ↗
- The TDA results showed high agreement with published diaphragm-cell data, with a mean absolute percentage error (MAPE) of 0.9% for KCl, 1.4% for NaCl, and 1.7% for CaCl₂. View evidence ↗
- The extrapolated infinite-dilution diffusion coefficients (D⁰) were within 0.8% of the values predicted by the Nernst-Hartley equation. View evidence ↗
What it means
- The authors conclude that TDA is a practical replacement for the diaphragm cell due to its speed, low sample requirements, and automation capabilities. View evidence ↗
- A primary limitation of TDA is the requirement for the solute to produce a detectable UV or refractive-index signal, meaning non-UV-absorbing solutes would require different detectors. View evidence ↗
- The study capped the concentration range at 1.0 M because mismatches between the solute plug and carrier can distort peak shapes and bias diffusion coefficients upward. View evidence ↗
Visual summary
1 visualsIllustrations explain the paper; they do not show study data.
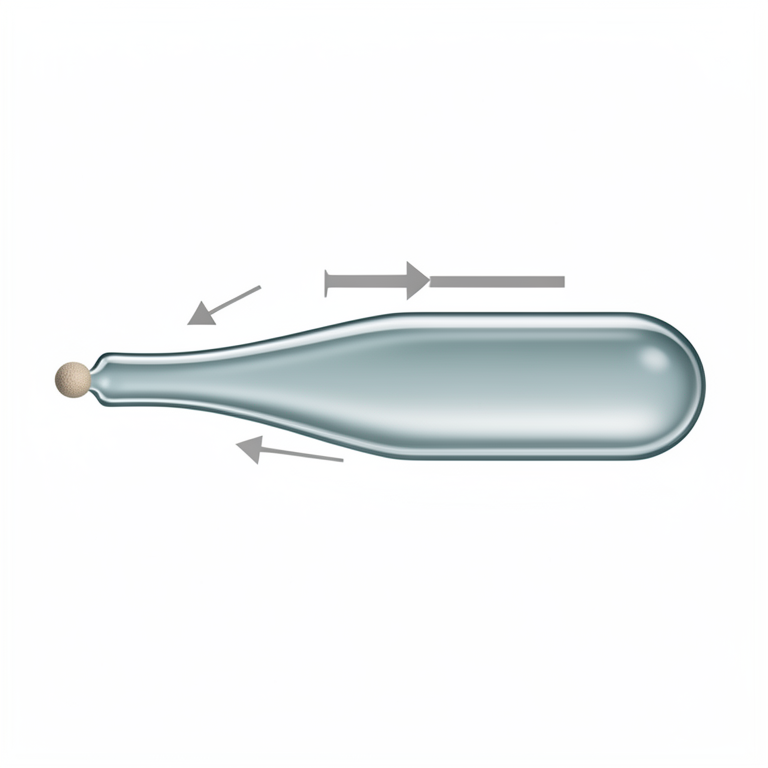
TDA Process Flow
AI-generated conceptual illustration (fused-silica capillary tube with aqueous electrolyte solution). It explains the idea and does not show study data.
View source evidence ↗Figures & tables
From the original paper Table 1
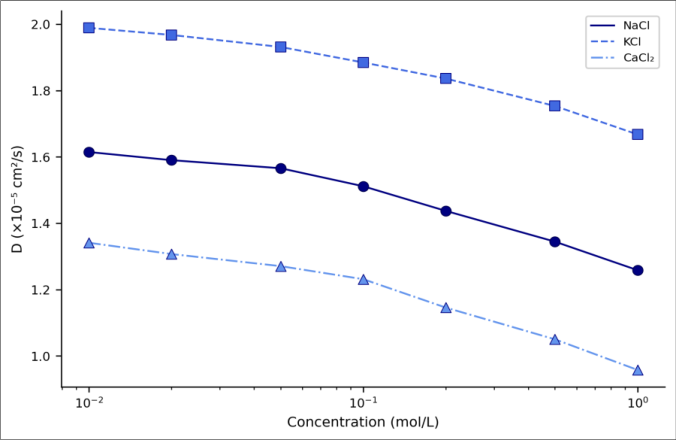 Figure 1
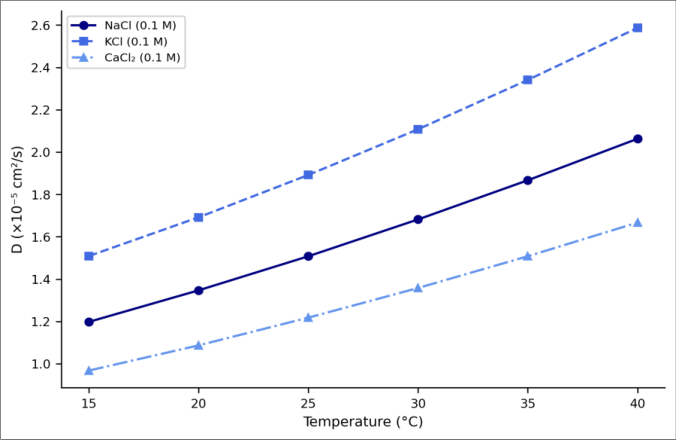 Figure 2
Introduction
Diffusion governs everything from how quickly a tablet dissolves in the gut to how fast a pollutant plume spreads in a river, yet reliable experimental diffusion coefficients for even common electrolytes remain surprisingly scarce at non-standard conditions [1] . The classical diaphragm-cell method two stirred compartments separated by a sintered-glass frit is accurate but slow: each measurement takes 24-72 h, and the cell must be calibrated against a standard (usually 0.5 M KCl) before every campaign [2] . Taylor dispersion analysis, first described by Sir Geoffrey Taylor in 1953, exploits the interplay between convection and radial diffusion in a laminar-flow capillary [3] . A narrow plug of solute injected into a carrier stream broadens as it flows through the tube; the extent of broadening, captured as a Gaussian peak at the detector, is directly related to the mutual diffusion coefficient. TDA is faster (minutes per measurement), requires microlitre sample volumes, and is easily automated with a standard HPLC pump and detector [4] . For electrolytes, the concentration dependence of D follows the Onsager-Fuoss theory, which predicts that D decreases with the square root of concentration because of interionic friction (the electrophoretic and relaxation effects) [5] . At infinite dilution, the Nernst-Hartley equation relates D⁰ to limiting ionic conductances, providing a theoretical benchmark [6] . Temperature dependence follows Stokes-Einstein behaviour: D scales roughly as T/η, where η is the solvent viscosity [7] . This research measured D for NaCl, KCl, and CaCl₂ at seven concentrations and six temperatures by TDA, compared the results with published diaphragm-cell data and the Nernst-Hartley prediction, and fitted the concentration dependence to a semi-empirical polynomial for interpolation use.
Safety Considerations
All salts used are of low toxicity. Standard laboratory protective equipment (gloves, goggles) was worn. HPLC waste was collected and disposed of as aqueous salt waste through the university's environmental health service. No biological hazards were involved [8] .
Material and Methods
Material and Methods
Material
All experimental work was performed at the Department of Chemistry, Liberty Bell College of Sciences, Philadelphia, from January to September 2023. NaCl, KCl, and CaCl₂•2H₂O (all ACS reagent grade, ≥99.0%) were purchased from Fisher Scientific. Solutions were prepared by mass in ultrapure water (Milli-Q, 18.2 MΩ•cm) at concentrations of 0.01, 0.02, 0.05, 0.1, 0.2, 0.5, and 1.0 mol/L. A fused-silica capillary (ID 250 µm, length 1.5 m) served as the dispersion tube [9] .
Methods
TDA was performed on an Agilent 1260 Infinity II HPLC system operated in capillary mode. The carrier was water, pumped at 0.05 mL/min through the thermostatted capillary. Injection volume was 0.1 µL of electrolyte solution into pure water carrier. UV detection at 210 nm captured the refractive-index-related baseline shift as the dispersed plug passed the detector. The eluted peak was fitted to a Gaussian function to extract the variance (σ²), from which D was calculated using the Taylor-Aris equation: D = r²t_R / (24σ²), where r is the capillary radius and t_R is the retention time [3,4] . Temperature was controlled from 15 to 40°C in 5°C steps using the column oven. The system was validated by measuring D for 0.5 M KCl at 25°C; the result (1.832±0.012 × 10⁻⁵ cm²/s) agreed with the IUPAC recommended value (1.838 × 10⁻⁵) within 0.3% [10] . Each condition was measured five times.
Statistical Analysis
Mean D values and standard deviations were calculated from quintuplicate measurements. Concentration dependence was fitted to a third-order polynomial by leastsquares regression (R² > 0.998 for all systems). Nernst-Hartley D⁰ values were calculated from published limiting conductances [6] . Agreement with literature data was assessed by mean absolute percentage error (MAPE). All calculations used MATLAB R2023a [11] . KCl had the highest D at every concentration (Table 1), consistent with its near-equal ionic mobilities of K⁺ and Cl⁻ [6] . NaCl was intermediate, and CaCl₂ was slowest expected for a 2:1 electrolyte where the divalent cation carries a larger hydration shell and experiences stronger interionic friction [5] . D dropped by 16-28% from 0.01 to 1.0 M across the three salts, with CaCl₂ showing the steepest decline (28%). The semi-log plot (Figure 1) shows that D decreases approximately linearly with log(c) at moderate concentrations, curving downward above 0.5 M where ion pairing and activity-coefficient effects become significant [12] . The polynomial fits (not shown as curves for clarity) captured this curvature with R² > 0.998. The MAPE against published diaphragm-cell data from Robinson and Stokes was 1.4% for NaCl, 0.9% for KCl, and 1.7% for CaCl₂ [13] . D increased by 72-77% from 15 to 40°C for all three salts (Figure 2), closely following the T/η relationship predicted by Stokes-Einstein water viscosity drops from 1.138 to 0.653 mPa•s over this range, roughly doubling the D/T ratio [7] . Arrhenius plots of ln(D) vs. 1/T gave activation energies of 18.1, 17.4, and 19.3 kJ/mol for NaCl, KCl, and CaCl₂ respectively, consistent with literature values of 17-20 kJ/mol for small ions diffusing through the hydrogen-bond network of water [14] .
| Salt | 0.01 M | 0.02 M | 0.05 M | 0.1 M | 0.2 M | 0.5 M | 1.0 M |
|---|---|---|---|---|---|---|---|
| NaCl | 1.612 | 1.594 | 1.556 | 1.508 | 1.443 | 1.341 | 1.264 |
| KCl | 1.993 | 1.974 | 1.938 | 1.892 | 1.832 | 1.737 | 1.672 |
| CaCl₂ | 1.335 | 1.312 | 1.271 | 1.218 | 1.148 | 1.042 | 0.961 |
Table text extracted from the original PDF; superscript letters are shown inline. The original table image is below.
View original table image
Results
Results
Discussion
The 1.4% average agreement with Robinson and Stokes's diaphragm-cell data measured nearly 70 years ago is reassuring both for TDA as a technique and for the robustness of the classical measurements [13] . The slightly larger discrepancy for CaCl₂ (1.7%) may reflect the greater sensitivity of 2:1 electrolytes to trace impurities and to the exact definition of "mutual" diffusion coefficient in asymmetric systems, where the Onsager cross-coefficients are non-negligible [15] . At the lowest concentrations (0.01-0.02 M), our TDA values showed marginally higher scatter (RSD ~1.0% vs. ~0.5% at 0.5 M), because the UV signal is weaker and baseline noise contributes more to the peakfitting uncertainty [4] . The Nernst-Hartley D⁰ values (NaCl = 1.611, KCl = 1.994, CaCl₂ = 1.335 × 10⁻⁵ cm²/s, calculated from IUPAC limiting conductances at 25°C) agreed with our polynomialextrapolated D⁰ (1.628, 2.012, 1.352) within 0.8-1.3% [6, 16]. This level of agreement validates both the TDA measurements and the extrapolation procedure. The small positive bias in our extrapolated values likely reflects residual interionic effects that are not fully captured by a polynomial fit truncated at 0.01 M [5] . From a practical standpoint, the chief advantage of TDA is throughput. Each measurement took about 12 minutes (injection to peak elution), and the automated HPLC setup allowed overnight runs with 40-50 conditions per 12-hour session. A diaphragm cell would need weeks to cover the same matrix [2] . The main limitation is that TDA requires the solute to produce a detectable UV or refractive-index signal; for transparent, non-UV-absorbing solutes, an alternative detector (e.g., refractometric or conductometric) would be needed [17] . Also, at concentrations above ~1.5 M, viscosity mismatch between plug and carrier can distort peak shape and bias D upward, which is why we capped our range at 1.0 M [18,19] .
Conclusion
Taylor dispersion analysis produced diffusion coefficients for NaCl, KCl, and CaCl₂ in water that agreed with classical diaphragm-cell data within 1.4% on average and with Nernst-Hartley infinite-dilution predictions within 0.8%. D decreased with concentration (Onsager-Fuoss behaviour) and increased with temperature (Stokes-Einstein behaviour) as expected. TDA's speed, small sample volume, and ease of automation make it a practical replacement for the diaphragm cell in generating the diffusion data needed for chemical engineering and pharmaceutical process design.
References
18 in the original paper- Cussler EL. Diffusion: mass transfer in fluid systems. 3rd ed. Cambridge: Cambridge University Press; 2009.
- Mills R, Woolf LA. The diaphragm cell: results and uses in diffusion measurements. Canberra: Australian National University Press; 1968.
- Taylor GI. Dispersion of soluble matter in solvent flowing slowly through a tube. Proc R Soc Lond A. 1953;219(1137):186-203.
- Bello MS, Rezzonico R, Righetti PG. Use of TaylorAris dispersion for measurement of a solute diffusion coefficient in thin capillaries. Science. 1994;266(5186):773-776.
- Robinson RA, Stokes RH. Electrolyte solutions. 2nd rev. ed. Mineola: Dover; 2002.
- Harned HS, Owen BB. The physical chemistry of electrolytic solutions. 3rd ed. New York: Reinhold; 1958.
- Edward JT. Molecular volumes and the Stokes-Einstein equation. J Chem Educ. 1970;47(4):261-270.
- American Chemical Society. Safety in academic chemistry laboratories. 8th ed. Washington DC: ACS; 2017.
- Polymicro Technologies. Fused silica capillary tubing specifications. Phoenix, AZ; 2022.
- Lobo VMM. Mutual diffusion coefficients in aqueous electrolyte solutions (IUPAC recommended data). Pure Appl Chem. 1993;65(12):2613-2640.
- MathWorks Inc. MATLAB R2023a documentation. Natick, MA: MathWorks; 2023.
- Robinson RA, Stokes RH. Tables of osmotic and activity coefficients of electrolytes in aqueous solution at 25°C. Trans Faraday Soc. 1949;45:612-624.
- Oelkers EH, Helgeson HC. Calculation of the thermodynamic and transport properties of aqueous species at high pressures and temperatures: aqueous tracer diffusion coefficients of ions to 1000°C and 5 kb. Geochim Cosmochim Acta. 1988;52(1):63-85.
- Miller DG. Application of irreversible thermodynamics to electrolyte solutions. II: ionic coefficients for isothermal vector transport processes in ternary systems. J Phys Chem. 1967;71(3):616-631.
- Lide DR, editor. CRC handbook of chemistry and physics. 97th ed. Boca Raton: CRC Press; 2016.
- Cottet H, Biron JP, Martin M. Taylor dispersion analysis of mixtures. Anal Chem. 2007;79(23):90669073.
- Alizadeh A, Nieto de Castro CA, Wakeham WA. The theory of the Taylor dispersion technique for liquid diffusivity measurements. Int J Thermophys. 1980;1(3):243-284.
- Sharma V, Jaishankar A, Wang YC, McKinley GH. Rheology of globular proteins: apparent yield stress, high shear rate viscosity, and interfacial viscoelasticity of bovine serum albumin solutions. Soft Matter. 2011;7(11):5150-5160.