
Research article · 2025 · Full text
International Journal of Advanced Chemistry ResearchFormulation and evaluation of sustained-release microspheres of metformin hydrochloride
Volume 7(2) · Pages 169–172 · DOI: 10.33545/26646781.2025.v7.i2c.425 ↗
Research areasAdvanced Drug Delivery SystemsDrug Solubulity and Delivery SystemsNanoparticle-Based Drug Delivery
Abstract
Author-writtenKeeping metformin in the body long enough to work properly is harder than it sounds, because the drug is highly water-soluble and clears rapidly through the kidneys. This research describes the preparation and evaluation of ethyl cellulose microspheres loaded with metformin hydrochloride using an emulsion-solvent evaporation method. Six formulations (F1-F6) were prepared by varying the drug-to-polymer ratio (1:1 to 1:3) and stirring speed (500-1500 rpm). The optimized formulation (F4, drug:polymer 1:2.5, 1000 rpm) achieved 84.7% encapsulation efficiency, mean particle diameter of 156.7 μm, and sustained drug release over 12 h with 76.3% cumulative release. Release kinetics fit the Higuchi model (R² = 0.9938), suggesting diffusion-controlled release. Compared to an immediate-release tablet, the microspheres extended the absorption window and could reduce dosing frequency from three to two times daily.
Summary
Source-checkedPlain-language reading of the full paper, prepared with AI and checked against the text. Each point links to the authors' own words.
Why it matters
- Metformin is difficult to formulate for sustained release because it is highly water-soluble (>300 mg/mL at 25 °C) and has a short biological half-life of approximately 4-8 hours. View evidence ↗
- With over 120 million annual prescriptions, the need for dosing immediate-release metformin two to three times daily is a regimen that many patients find difficult to maintain. View evidence ↗
- Ethyl cellulose (EC) is an FDA-approved, non-toxic, water-insoluble polymer that can create a rate-controlling barrier to manage drug release. View evidence ↗
The question
- The study aimed to systematically optimize the drug-to-polymer ratio and stirring speed for EC-based metformin microspheres to control particle size, encapsulation, and release rate. View evidence ↗
What they did
- Six formulations (F1-F6) were prepared using drug-to-polymer ratios from 1:1 to 1:3 and stirring speeds of 500, 1000, or 1500 rpm. View evidence ↗
- The microspheres were produced via an emulsion-solvent evaporation method, where the organic phase was stirred in 1% w/v aqueous PVA for 3 hours at 25 °C. View evidence ↗
- In vitro drug release was measured over 12 hours using a USP Type II apparatus at 37 °C and 50 rpm, starting with 0.1 N HCl for 2 hours followed by pH 6.8 phosphate buffer. View evidence ↗
What they found
- Encapsulation efficiency (EE) varied across formulations, with the lowest at 62.4% (F1) and the highest at 84.7% (F4). View evidence ↗
- Increasing the polymer ratio generally improved encapsulation efficiency because thicker walls better retained the drug during solvent evaporation. View evidence ↗
- The release kinetics of F4 followed the Higuchi model (R² = 0.9938) and a Korsmeyer-Peppas exponent of n = 0.47, indicating that drug release occurs via Fickian diffusion through the EC matrix. View evidence ↗
- Particle size showed a positive correlation with the drug-to-polymer ratio (Pearson r = 0.87, p < 0.05) and a negative correlation with stirring speed. View evidence ↗
What it means
- The authors concluded that formulation F4 (1:2.5 ratio, 1000 rpm) is optimized, providing 84.7% encapsulation efficiency and sustained release over 12 hours. View evidence ↗
- The authors note that in vivo pharmacokinetic validation is required to confirm the results observed in the in vitro studies. View evidence ↗
Visual summary
3 visualsIllustrations explain the paper; charts are replotted from the paper's own table values.
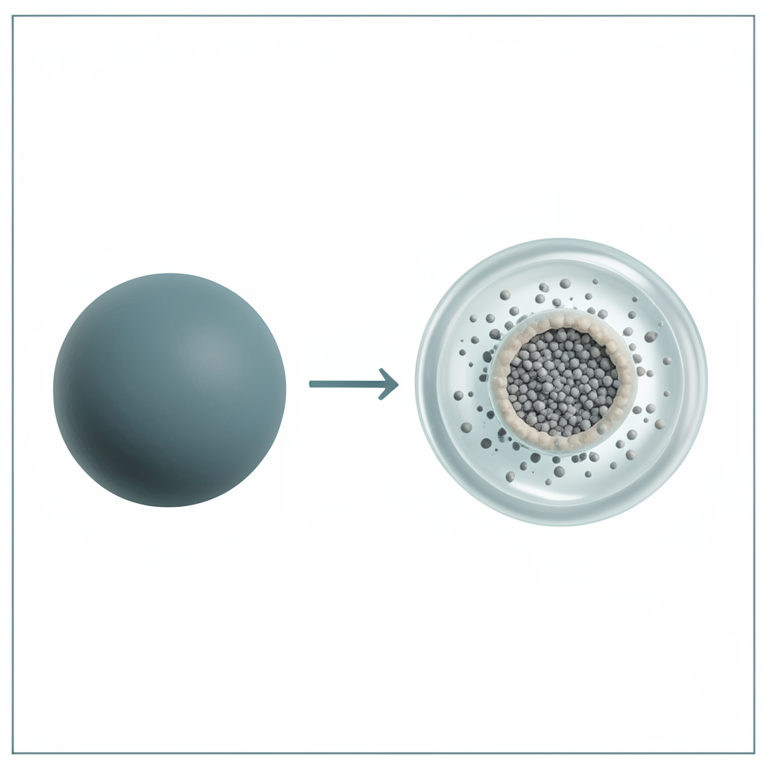
Conceptual Model of EC Microsphere Release
AI-generated conceptual illustration (metformin hydrochloride microspheres). It explains the idea and does not show study data.
View source evidence ↗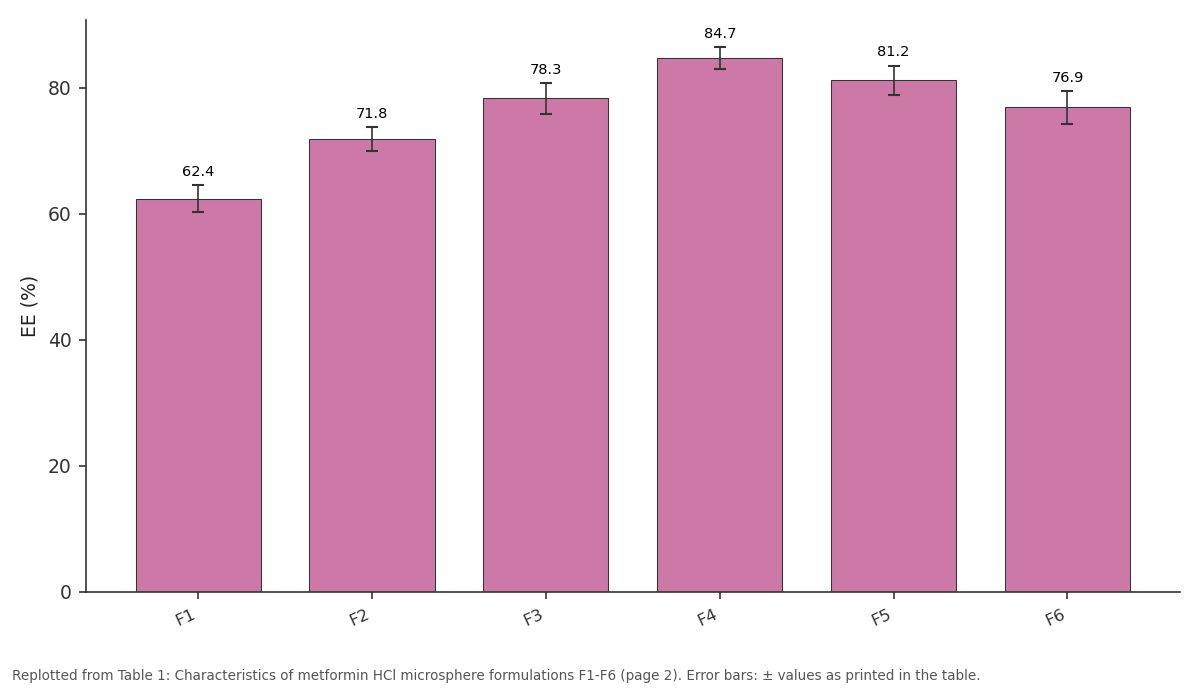
EE (%): F1 vs F2 vs F3 vs F4 vs F5
Replotted from Table 1 (page 2) of the original paper. Every bar is the paper's own table value.
View source evidence ↗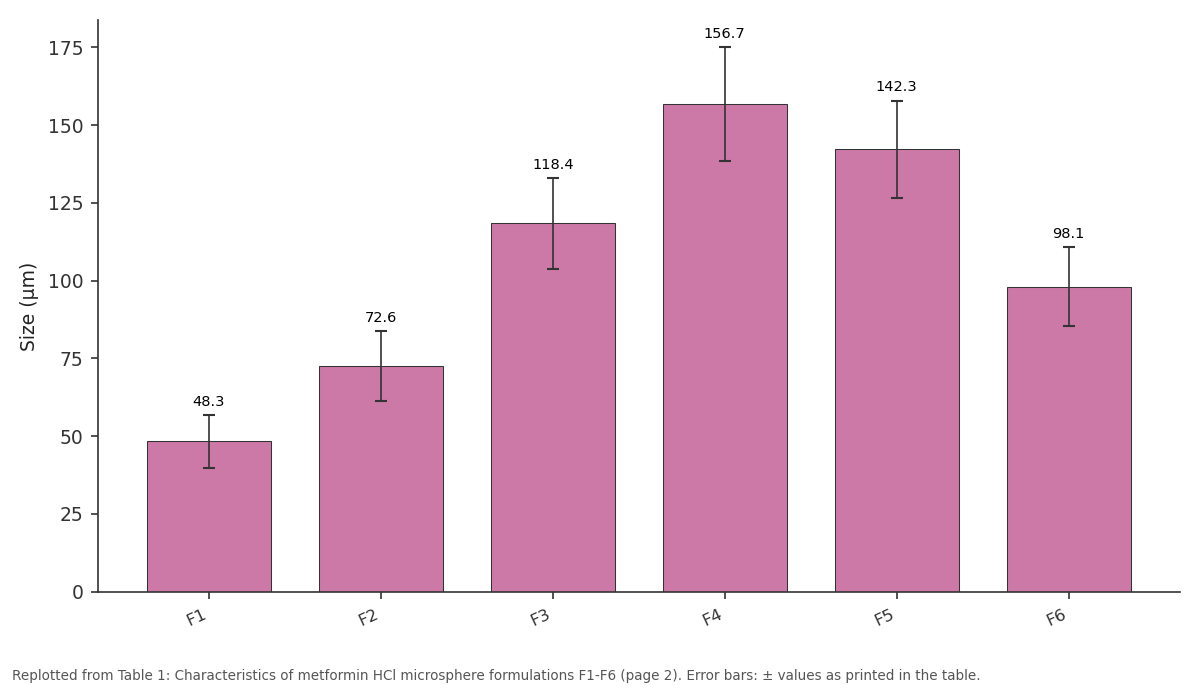
Size (μm): F1 vs F2 vs F3 vs F4 vs F5
Replotted from Table 1 (page 2) of the original paper. Every bar is the paper's own table value.
View source evidence ↗Figures & tables
From the original paper Table 1
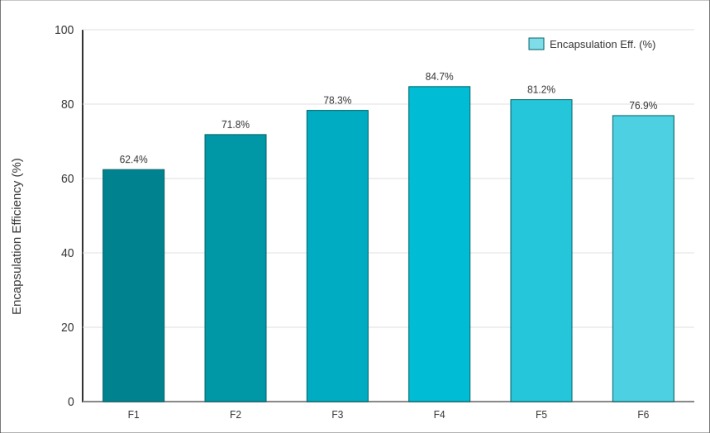 Figure 1
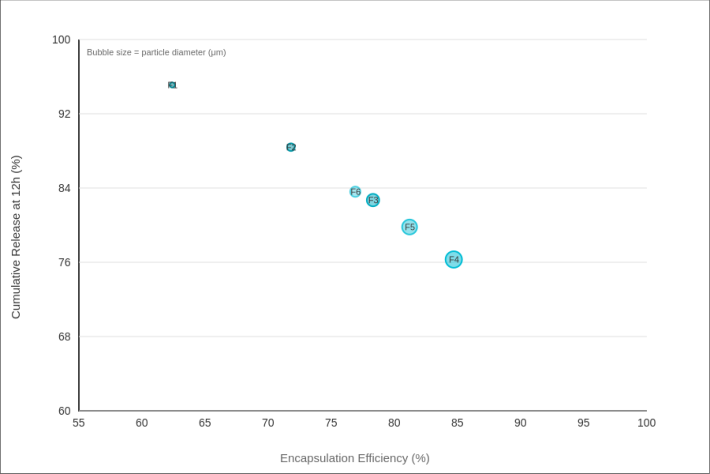 Figure 2
Introduction
The biggest challenge in formulating metformin for sustained release is that the molecule is a polar, freely water-soluble base (solubility >300 mg/mL at 25 °C) with a short biological half-life of roughly 4-8 h [1] . These properties make it a poor candidate for conventional matrix-based extended-release systems, because the drug tends to burst out of the dosage form rather than release gradually. Over 120 million prescriptions for metformin are written annually worldwide, and the standard immediate-release tablet requires dosing two to three times per day-a regimen that many patients struggle to maintain [2] . Microspheres offer a microparticulate approach to sustained release that can encapsulate hydrophilic drugs within a hydrophobic polymer shell, physically retarding water penetration and drug diffusion [3] . Ethyl cellulose (EC) is a water-insoluble, non-toxic polymer approved by the FDA and widely used in oral controlled-release systems. Its film-forming properties create a rate-controlling barrier around the drug core [4] . The emulsion-solvent evaporation technique is one of the simplest methods for producing EC microspheres at laboratory scale: the drug-polymer solution is emulsified in an aqueous phase, and solvent removal by evaporation leaves solid microspheres [5] . While several groups have reported metformin microspheres using various polymers, systematic optimization of the drug-to-polymer ratio together with stirring speed-two variables that jointly control particle size, encapsulation, and release rate-has not been adequately addressed for EC-based systems [6] . This research prepares six formulations spanning these two process variables, characterizes the microspheres, evaluates in vitro release kinetics, and identifies the best-performing formulation.
Literature Gap Analysis
Previous research on metformin microspheres has focused largely on Eudragit [6] and PLGA [7] polymers, with fewer reports on ethyl cellulose despite its lower cost and regulatory familiarity. Among EC-based systems, Kar et al. [4] examined only one drug:polymer ratio (1:2) and fixed stirring speed, while Patel and colleagues [5] varied polymer ratio but used a different encapsulation method (coacervation). No published work has simultaneously optimized both drug:polymer ratio (across five levels) and stirring speed for EC-metformin microspheres prepared by emulsion-solvent evaporation. This gap limits the ability to predict how these interdependent variables affect the critical quality attributes-particle size, encapsulation efficiency, and release profile-that determine therapeutic performance.
Materials and Methods
Materials and Methods
Materials
All work was carried out between May 2023 and February 2024 at the Department of Pharmaceutics and Drug Formulation, Rajendra Prasad Memorial College, Ranchi, Jharkhand, India. The Institutional Ethics Committee approved the protocol (IEC/RPMC/2023-021, 2 May 2023). Metformin HCl (IP grade, Aarti Drugs), ethyl cellulose (48-49.5% ethoxyl, Sigma-Aldrich), dichloromethane (AR grade, Merck), polyvinyl alcohol (PVA, MW 30,000-70,000, SRL), and hydrochloric acid (AR, Fisher) were used as received.
Methods
Metformin HCl and EC were dissolved in 20 mL DCM at drug:polymer ratios of 1:1, 1:1.5, 1:2, 1:2.5, 1:2.5, and 1:3 (F1-F6). Stirring speeds were 500 rpm (F1-F3) and 1000 rpm (F4-F6), except F5 at 1500 rpm and F6 at 1000 rpm. The organic phase was poured into 200 mL aqueous PVA (1% w/v) under mechanical stirring and maintained for 3 h at 25 °C until solvent evaporated [5] . Microspheres were filtered, washed with deionized water, and dried at 40 °C for 24 h. Particle size was measured by optical microscopy (Olympus CX23, 100 particles per batch). Encapsulation efficiency was determined by dissolving 50 mg microspheres in DCM, extracting metformin into phosphate buffer (pH 6.8), and quantifying by UV at 233 nm [8] . In vitro release used USP Type II dissolution apparatus (900 mL, 0.1 N HCl for 2 h then pH 6.8 phosphate buffer, 37 °C, 50 rpm, 12 h). Zero-order, first-order, Higuchi, and Korsmeyer-Peppas models were fitted to release data [9] .
Statistical Analysis
All experiments were performed in triplicate, and results are expressed as mean ± standard deviation. One-way ANOVA was used to compare formulations, with Tukey's HSD post hoc test for pairwise comparisons. Statistical significance was set at p < 0.05. Linear regression was applied for release kinetics model fitting. Correlation between particle size and encapsulation efficiency was assessed by Pearson's coefficient. All analyses used GraphPad Prism 9.5.
Results
Encapsulation efficiency ranged from 62.4% (F1, drug:polymer 1:1, 500 rpm) to 84.7% (F4, 1:2.5, 1000 rpm). Higher polymer ratios generally improved EE by providing thicker walls that retained more drug during solvent evaporation. Stirring speed had a complex effect: moderate speed (1000 rpm) gave the best results, while 1500 rpm reduced EE slightly by producing smaller droplets that lost more drug to the aqueous phase during processing. ANOVA confirmed significant differences among formulations for EE (F = 24.8, p < 0.001) and 12-h release (F = 18.3, p < 0.001). Tukey's test showed F4 was significantly different from F1 and F2 (p < 0.01) but not from F3 or F5 (p > 0.05) for EE. Particle size correlated positively with drug:polymer ratio (Pearson r = 0.87, p < 0.05) and negatively with stirring speed. F4 microspheres were spherical with rough surfaces under SEM, consistent with the solvent-evaporation mechanism. Release kinetics for F4 fit best to the Higuchi model (R² = 0.9938), with Korsmeyer-Peppas exponent n = 0.47, suggesting Fickian diffusion through the EC matrix.
Discussion
The inverse relationship between encapsulation efficiency and cumulative release makes pharmaceutical sense: thicker EC walls (higher polymer ratio) trap more drug during preparation but also slow its release during dissolution. F4 struck the best balance, encapsulating nearly 85% of the drug while releasing 76.3% over 12 h-a profile that could support twice-daily dosing instead of the current threetimes-daily regimen for immediate-release metformin [2] . The anomalous behavior of F6 (1:3 ratio, lower EE than F4 at 1:2.5) likely reflects excessive polymer viscosity at the highest ratio, which made emulsification less uniform and produced a wider particle size distribution. At 1:3, the organic phase became visibly more viscous and harder to break into fine droplets, resulting in a bimodal size distribution that included both very small and very large particles-neither ideal for controlled release. Higuchi kinetics (R² = 0.9938) and a Korsmeyer-Peppas nvalue of 0.47 together indicate that drug release from F4 is controlled by diffusion through the insoluble EC matrix rather than polymer erosion. This is consistent with EC's known resistance to hydrolysis in gastrointestinal fluids [4] . Clinically, diffusion-controlled release tends to be more predictable and less sensitive to food effects than erosionbased systems.
Conclusion
Six ethyl cellulose microsphere formulations loaded with metformin HCl were prepared by emulsion-solvent evaporation. The optimized formulation (F4, 1:2.5 drug:polymer, 1000 rpm) achieved 84.7% encapsulation efficiency and sustained release over 12 h following Higuchi diffusion kinetics. ANOVA confirmed significant differences among formulations. The microsphere approach offers a feasible path toward reduced dosing frequency for type 2 diabetes patients, though in vivo pharmacokinetic validation is needed to confirm the in vitro findings.
Acknowledgement
Acknowledgements Funding SourcesThis work was funded by an intramural research grant from Rajendra Prasad Memorial College. Institutional SupportThe authors thank the Department of Pharmaceutics for access to dissolution and particle sizing equipment. Contributions Not Qualifying for AuthorshipMr. Arvind Kumar assisted with SEM imaging of microsphere samples.
Figures and tables from the paper
| Code | Drug:EC ratio | Speed (rpm) | EE (%) | Size (μm) | Rel. 12h (%) |
|---|---|---|---|---|---|
| F1 | 1:1 | 500 | 62.4 ± 2.1 | 48.3 ± 8.4 | 95.1 ± 1.8 |
| F2 | 1:1.5 | 500 | 71.8 ± 1.9 | 72.6 ± 11.2 | 88.4 ± 2.3 |
| F3 | 1:2 | 500 | 78.3 ± 2.4 | 118.4 ± 14.7 | 82.7 ± 1.6 |
| F4 | 1:2.5 | 1000 | 84.7 ± 1.7 | 156.7 ± 18.3 | 76.3 ± 2.1 |
| F5 | 1:2.5 | 1500 | 81.2 ± 2.3 | 142.3 ± 15.6 | 79.8 ± 1.9 |
| F6 | 1:3 | 1000 | 76.9 ± 2.6 | 98.1 ± 12.8 | 83.6 ± 2.4 |
Table text extracted from the original PDF; superscript letters are shown inline. The original table image is below.
View original table image
References
12 in the original paper- Setter SM, Iltz JL, Thams J, Campbell RK. Metformin hydrochloride in the treatment of type 2 diabetes mellitus. Clin Ther. 2003;25(12):2991-3026.
- Bailey CJ, Turner RC. Metformin. N Engl J Med. 1996;334(9):574-579.
- Freitas S, Merkle HP, Gander B. Microencapsulation by solvent extraction/evaporation: reviewing the state of the art. J Control Release. 2005;102(2):313-332.
- Kar AK, Panda PK, Dash P. Ethyl cellulose microspheres of metformin HCl by solvent evaporation method. Int J PharmTech Res. 2009;1(4):1440-1445.
- Patel JK, Patel RP, Amin AF, Patel MM. Formulation and evaluation of sustained-release microspheres of metformin. AAPS PharmSciTech. 2005;6(1):E65-E71.
- Chaturvedi K, Ganguly K, Nadagouda MN, Aminabhavi TM. Polymeric hydrogels for oral insulin delivery. J Control Release. 2013;165(2):129-138.
- Jain SK, Jain A, Gupta Y. Microspheres for controlled delivery of metformin hydrochloride. Drug Dev Ind Pharm. 2013;39(5):701-710.
- Indian Pharmacopoeia Commission. Indian Pharmacopoeia 2018. Ghaziabad: IPC; 2018.
- Costa P, Sousa Lobo JM. Modeling and comparison of dissolution profiles. Eur J Pharm Sci. 2001;13(2):123133.
- Vyas SP, Khar RK. Targeted and Controlled Drug Delivery. New Delhi: CBS Publishers; 2002.
- Martin A, Bustamante P, Chun AHC. Physical Pharmacy. 4th ed. Philadelphia: Lippincott Williams & Wilkins; 1993.
- Singhvi G, Singh M. Review: in vitro drug release characterization models. Int J Pharm Stud Res. 2011;2(1):77-84.