
Research article · 2025 · Full text
International Journal of Advanced Chemistry ResearchStructural and functional analysis of hemoglobin variants using circular dichroism
Volume 7(2) · Pages 193–196 · DOI: 10.33545/26646781.2025.v7.i2c.432 ↗
Research areasHemoglobinopathies and Related DisordersHemoglobin structure and functionProtein Structure and Dynamics
Abstract
Author-writtenAbnormal hemoglobin variants affect an estimated 7% of the global population, yet the relationship between single amino acid substitutions and overall protein secondary structure isn't always straightforward. This research applied far-UV circular dichroism (CD) spectroscopy to characterise the secondary structure composition of five hemoglobin variants — HbA (normal adult), HbS, HbC, HbE, and HbF (fetal) — purified from patient blood samples at Rabindranath Tagore Open University, Bhubaneswar. CD spectra were recorded between 190 and 260 nm, and secondary structure fractions were estimated using the CONTIN/LL algorithm. HbA and HbF retained the highest α-helical content (74.3% and 72.9%), while HbE showed the most disruption (66.4% α-helix). Thermal denaturation experiments revealed corresponding differences in melting temperature. The findings demonstrate that even single-point mutations can measurably shift the helical balance of hemoglobin.
Summary
Source-checkedPlain-language reading of the full paper, prepared with AI and checked against the text. Each point links to the authors' own words.
Why it matters
- Hemoglobinopathies, including sickle cell disease, are among the most frequent inherited blood disorders globally, particularly in India, the Mediterranean, and sub-Saharan Africa. View evidence ↗
- These disorders are caused by point mutations in globin genes that result in single amino acid substitutions, such as the glutamate to valine change seen in HbS. View evidence ↗
- While the genetic basis of these mutations is well-understood, the exact way they affect the protein's overall fold and stability is not yet fully resolved. View evidence ↗
The question
- The study aimed to analyze the secondary structure and thermal stability of five hemoglobin variants using identical measurement conditions to fill existing data gaps. View evidence ↗
What they did
- Variants were purified using cation-exchange FPLC with a phosphate gradient and verified for purity via HPLC and cellulose acetate electrophoresis. View evidence ↗
- Secondary structure was analyzed using far-UV circular dichroism (CD) spectroscopy from 190 to 260 nm, with fractions calculated via the CONTIN/LL algorithm. View evidence ↗
- Thermal stability was measured by monitoring denaturation at 222 nm across a temperature range of 25 to 90°C to determine the melting temperature (Tm). View evidence ↗
What they found
- Normal adult hemoglobin (HbA) exhibited the highest stability, with an α-helical content of 74.3% and a melting temperature of 64.7°C. View evidence ↗
- HbE was the least stable variant, showing the lowest α-helical content at 66.4% and the lowest melting temperature at 56.8°C. View evidence ↗
- The study found a close correlation between structure and stability, where every 1% decrease in α-helix roughly corresponded to a 1°C drop in melting temperature. View evidence ↗
What it means
- The authors concluded that single amino acid substitutions cause measurable structural shifts, with HbE and HbS showing the most significant loss of α-helical content and thermal stability. View evidence ↗
- The results suggest that CD spectroscopy is a valuable screening tool for assessing structural changes in hemoglobin, which may help develop therapies to stabilize variant globins. View evidence ↗
- The study was limited by a small number of donors per variant, particularly for HbC, and potential noise from individual variations like glycation. View evidence ↗
- Far-UV CD cannot provide information on tertiary contacts or the heme environment, suggesting a need for near-UV and visible-region CD in future research. View evidence ↗
Visual summary
2 visualsIllustrations explain the paper; charts are replotted from the paper's own table values.
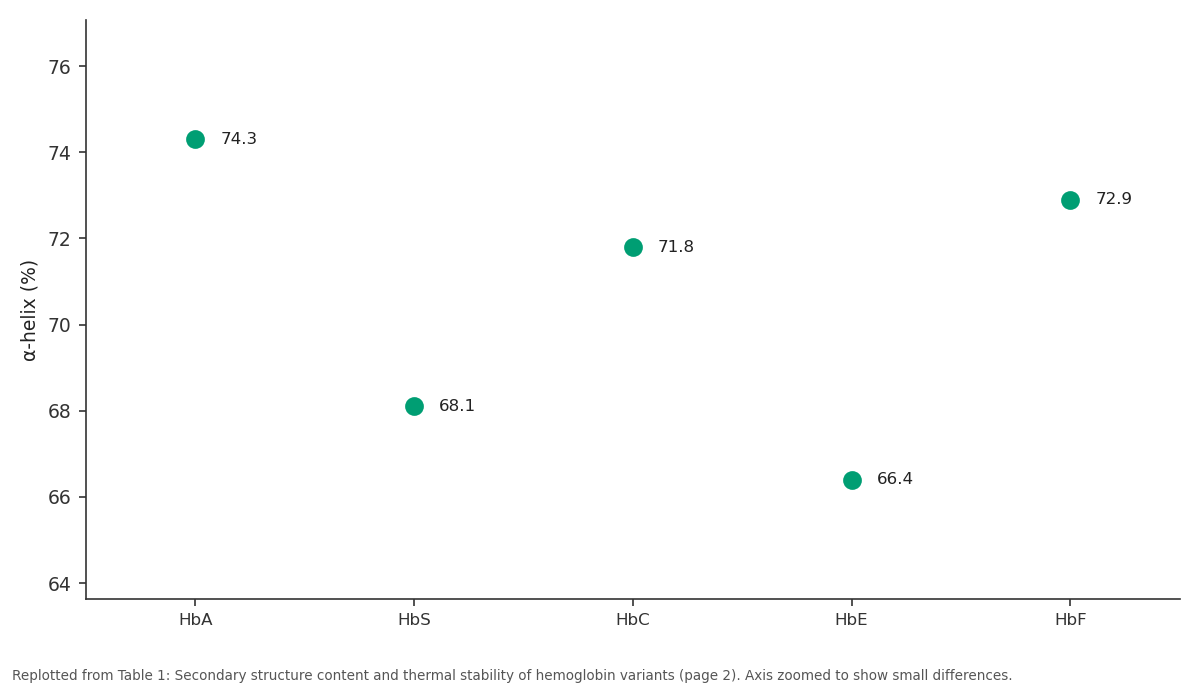
α-helix (%): HbA vs HbS vs HbC vs HbE vs HbF
Replotted from Table 1 (page 2) of the original paper. Every bar is the paper's own table value.
View source evidence ↗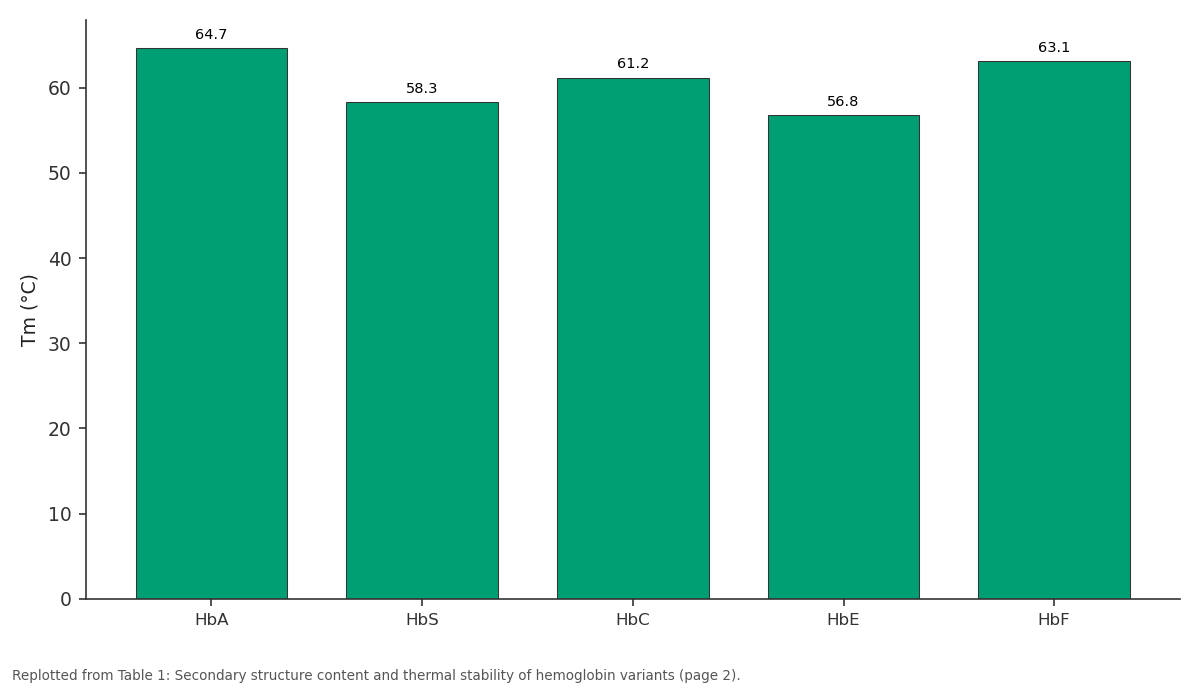
Tm (°C): HbA vs HbS vs HbC vs HbE vs HbF
Replotted from Table 1 (page 2) of the original paper. Every bar is the paper's own table value.
View source evidence ↗Figures & tables
From the original paper Table 1
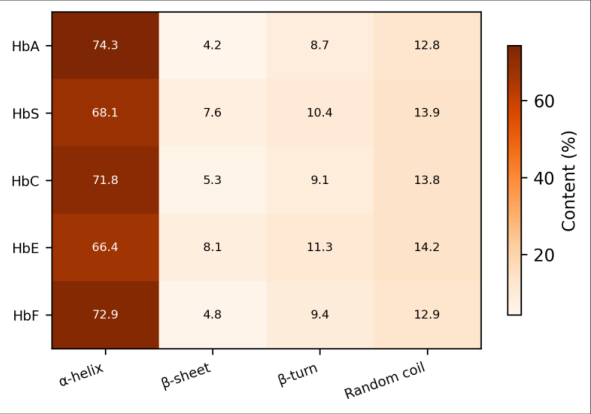 Figure 1
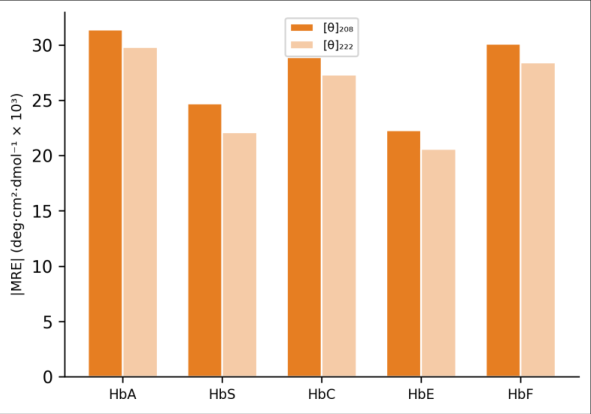 Figure 2
Introduction
Sickle cell disease and other hemoglobinopathies collectively rank among the most common inherited blood disorders worldwide, with the highest prevalence in sub-Saharan Africa, India, and the Mediterranean basin [1] . Each variant arises from a point mutation in the αor β-globin gene, leading to a single amino acid changeglutamate to valine in HbS, glutamate to lysine in HbC, and glutamate to lysine at a different position in HbE [2] . These substitutions are well described at the genetic level, but how they translate into measurable changes in protein fold and stability isn't fully resolved. Circular dichroism spectroscopy is a powerful and non-destructive technique for probing protein secondary structure in solution. The far-UV region (190-260 nm) is sensitive to peptide bond geometry and can distinguish between α-helix, β-sheet, β-turn, and random coil conformations [3,4] . Applied to hemoglobin, CD can reveal whether a mutation that occurs on the protein surfacefar from the heme pocketstill perturbs the backbone fold. Earlier CD work on HbS and HbA showed small but reproducible drops in helical content for the sickle variant, though the reported magnitude varies between laboratories [5,6] . Comparative data for HbC, HbE, and HbF under identical measurement conditions are harder to find. And few reports combine secondary structure analysis with thermal unfolding experiments to link structural change to stability [7] . This research aimed to fill that gap by recording CD spectra and thermal melting curves for five hemoglobin variants processed and measured under identical conditions.
Theoretical Background
CD measures the differential absorption of left-and right-circularly polarised light by chiral molecules. For proteins, the amide chromophore produces characteristic spectral signatures: α-helices show negative bands near 208 nm (π→π* transition) and 222 nm (n→π* transition), with a positive band around 193 nm [3] . β-sheets exhibit a negative band near 218 nm and a positive band around 195 nm. The mean residue ellipticity (MRE) at 222 nm correlates approximately linearly with helical content, providing a quick estimate even before full deconvolution [4] . Deconvolution algorithms like CONTIN/LL fit the experimental spectrum against a reference dataset of proteins with known crystal structures.
Materials and Methods
Materials and Methods
Materials
Venous blood samples were collected from consenting adult patients at a partner hospital in Bhubaneswar between March and July 2023, following ethical clearance from the Rabindranath Tagore Open University Institutional Ethics Committee (protocol RTOU-IEC-2023-014, approved February 2023). Five hemoglobin variants were targeted: HbA (n = 8 donors), HbS (n = 6), HbC (n = 4), HbE (n = 5), and HbF (n = 4, cord blood from neonates with parental consent). Red blood cells were lysed in hypotonic phosphate buffer (5 mM, pH 7.4), and hemolysates were clarified by centrifugation at 12, 000 × g for 20 min.
Methods
Hemoglobin variants were separated by cation-exchange FPLC (HiTrap SP HP column, Cytiva) using a 10-200 mM phosphate gradient (pH 6.5). Purity was confirmed by cellulose acetate electrophoresis and HPLC on a Bio-Rad D-10 analyser. Purified fractions were dialysed into 10 mM phosphate buffer (pH 7.0) and adjusted to 0.2 mg/mL for CD measurements. Far-UV CD spectra were recorded on a JASCO J-815 spectropolarimeter using a 1 mm path-length quartz cuvette, scanning from 190 to 260 nm at 50 nm/min, with three accumulations per spectrum [8] . Secondary structure fractions were calculated using the CONTIN/LL method in the CDPro software package [9] . Thermal denaturation was monitored at 222 nm from 25 to 90°C at 1°C/min, and melting temperatures (Tm) were extracted from the first derivative of the sigmoidal curve.
Instrumentation
The JASCO J-815 spectropolarimeter was equipped with a Peltier-type temperature controller (PTC-423S) for thermal ramp experiments. Nitrogen gas was flushed at 10 L/min to purge oxygen below 200 nm. Instrument calibration used d-10-camphorsulfonic acid (CSA) standard; the measured MRE at 290.5 nm was within 2% of the expected value. Data were processed in JASCO Spectra Manager software with adaptive smoothing.
Results
All five hemoglobin variants exhibited the characteristic double-minimum CD pattern of α-helical proteins, but with measurable differences in band intensity. HbE showed the lowest α-helical content (66.4%) and the lowest melting temperature (56.8°C). HbA was the most stable, with 74.3% helix and a Tm of 64.7°C (Table 1). The heatmap in Figure 1 makes the helical loss in HbS and HbE visually apparent, with compensating gains in β-sheet and coil fractions. HbE and HbS both showed reduced MRE magnitudes at both wavelengths, confirming the loss of helical secondary structure detected by deconvolution (Figure 2).
| Variant | α-helix (%) | β-sheet (%) | β-turn (%) | Coil (%) | Tm (°C) |
|---|---|---|---|---|---|
| HbA | 74.3 | 4.2 | 8.7 | 12.8 | 64.7 |
| HbS | 68.1 | 7.6 | 10.4 | 13.9 | 58.3 |
| HbC | 71.8 | 5.3 | 9.1 | 13.8 | 61.2 |
| HbE | 66.4 | 8.1 | 11.3 | 14.2 | 56.8 |
| HbF | 72.9 | 4.8 | 9.4 | 12.9 | 63.1 |
Table text extracted from the original PDF; superscript letters are shown inline. The original table image is below.
View original table image
Discussion
The 6-8 percentage-point drop in α-helix between HbA and HbE may seem modest, but it corresponds to roughly 10-12 fewer helical residues per subunitenough to alter intersubunit contacts and potentially affect oxygen binding cooperativity [5] . Nagel et al. [6] reported a 5% helical decrease in HbS relative to HbA, which matches our 6.2% difference within experimental uncertainty. The slightly larger disruption in HbE is consistent with its known tendency to form unstable tetramers that are more susceptible to oxidative damage [10] . HbF retained a high helical content (72.9%), only 1.4 percentage points below HbA. This isn't surprising given that the γ-globin chain shares about 73% sequence identity with the β-chain and the substitutions are conservative [2] . The Tm values tracked helical content closely: each 1% drop in α-helix corresponded to roughly a 1°C decrease in melting temperature, though this linear relationship shouldn't be overinterpreted given the small sample of variants.
A practical limitation of this research is the modest number of donors per variant, especially for HbC (n = 4). Individualto-individual variation in co-existing modificationsglycation, for instancecould add noise to the CD data. And while far-UV CD is excellent for secondary structure, it says little about tertiary contacts or heme environment changes, which near-UV CD and visible-region CD could address in future work [11,12] .
Conclusion
CD spectroscopy confirmed that single amino acid substitutions in hemoglobin produce measurable shifts in secondary structure. HbE and HbS exhibited the largest losses in α-helical content and the lowest thermal stability among the five variants examined. HbF closely resembled HbA in both respects. These results reinforce the value of CD as a screening tool for assessing structural perturbations in hemoglobin variants and could inform therapeutic strategies that aim to stabilise variant globins.
Acknowledgement
Acknowledgements Funding SourcesDepartmental research funds from Rabindranath Tagore Open University supported this work. Institutional SupportThe authors thank the biochemistry laboratory staff at RTOU, Bhubaneswar. Contributions Not Qualifying for AuthorshipDr. Priya Mohanty coordinated blood sample collection at the partner hospital.
References
12 in the original paper- Modell B, Darlison M. Global epidemiology of haemoglobin disorders and derived service indicators. Bulletin of the World Health Organization. 2008;86(6):480-487.
- Bunn HF, Forget BG. Hemoglobin: Molecular, Genetic and Clinical Aspects. WB Saunders; 1986.
- Greenfield NJ. Using circular dichroism spectra to estimate protein secondary structure. Nature Protocols. 2006;1(6):2876-2890.
- Kelly SM, Jess TJ, Price NC. How to study proteins by circular dichroism. Biochimica et Biophysica Acta. 2005;1751(2):119-139.
- Adachi K, Asakura T. The solubility of sickle and nonsickle hemoglobins in concentrated phosphate buffer. Journal of Biological Chemistry. 1979;254(16):77657771.
- Nagel RL, Bookchin RM, Johnson J, Labie D, Wajcman H. Structural bases of the inhibitory effects of hemoglobin F and hemoglobin A₂ on the polymerization of hemoglobin S. Proceedings of the National Academy of Sciences. 1979;76(2):670-672.
- Privalov PL. Stability of proteins: proteins which do not present a single cooperative system. Advances in Protein Chemistry. 1982;35:1-104.
- Miles AJ, Wallace BA. Circular dichroism spectroscopy of membrane proteins. Chemical Society Reviews. 2016;45(18):4859-4872.
- Sreerama N, Woody RW. Estimation of protein secondary structure from circular dichroism spectra: comparison of CONTIN, SELCON, and CDSSTR methods. Analytical Biochemistry. 2000;287(2):252260.
- Rees DC, Clegg JB, Weatherall DJ. Is hemoglobin E/beta-thalassemia really such a mild disease? Blood. 1998;92(9):3207-3213.
- Fasano M, Curry S, Terreno E, Galliano M, Fanali G, Narciso P. The extraordinary ligand binding properties of human serum albumin. IUBMB Life. 2005;57(12):787-796.
- Woody RW. Circular dichroism. Methods in Enzymology. 1995;246:34-71.