
Research article · 2025 · Full text
International Journal of Advanced Chemistry ResearchICP-OES determination of rare earth elements in environmental soil samples
Volume 7(2) · Pages 189–192 · DOI: 10.33545/26646781.2025.v7.i2c.431 ↗
Research areasHeavy metals in environmentAnalytical chemistry methods developmentEnvironmental and Analytical Chemistry Studies
Abstract
Author-writtenRare earth elements (REEs) entered industrial demand almost a century ago, but their environmental distribution in Australian soils remains poorly mapped. This research developed and validated an ICP-OES method for simultaneous quantification of lanthanum (La), cerium (Ce), neodymium (Nd), and yttrium (Y) in soil samples collected from six sites across the Perth metropolitan and peri-urban region of Western Australia. Soil samples were acid-digested using a microwave-assisted HNO₃/HCl/HF procedure. Method detection limits ranged from 0.03 to 0.11 mg/kg, and spike recoveries fell between 92.8% and 99.6% across three concentration levels. Cerium was the most abundant REE at all sites, with concentrations reaching 81.4 mg/kg near an industrial corridor. The validated method offers a reliable, cost-effective tool for environmental REE monitoring in diverse soil matrices.
Summary
Source-checkedPlain-language reading of the full paper, prepared with AI and checked against the text. Each point links to the authors' own words.
Why it matters
- Rare earth elements (REEs) are critical for modern technologies, including electric vehicles and wind turbines, due to their use in batteries, magnets, and catalysts. View evidence ↗
- While Western Australia contains a significant portion of Australia's 4% share of global REE reserves, there is a lack of systematic data on their distribution in urban and peri-urban soils. View evidence ↗
- ICP-MS is the standard for trace analysis, but ICP-OES is a more cost-effective alternative for routine monitoring when concentrations are above a few mg/kg. View evidence ↗
The question
- The study aimed to develop and validate an ICP-OES method to simultaneously quantify four REEs (La, Ce, Nd, and Y) in soil samples from six sites in the Perth region. View evidence ↗
What they did
- Surface soil (0-20 cm depth) was sampled from six locations in Perth in August 2023, covering residential, parkland, agricultural, and industrial land uses. View evidence ↗
- Samples underwent microwave-assisted digestion using a mixture of HNO₃, HCl, and HF to ensure the breakdown of silicate lattices. View evidence ↗
- The analysis was performed using a PerkinElmer Optima 8300 ICP-OES in axial viewing mode. View evidence ↗
- Rhodium at a concentration of 5 mg/L was used as an internal standard to correct for signal drift. View evidence ↗
What they found
- The method was validated with detection limits between 0.03 and 0.11 mg/kg and spike recoveries ranging from 92.8% to 99.6%. View evidence ↗
- Across all six sampling sites, Cerium was the most abundant REE, followed by La, Nd, and Y. View evidence ↗
- The highest concentration of Cerium, 81.4 mg/kg, was found at a site near an industrial corridor. View evidence ↗
- Total REE concentrations at site S4 (industrial) were approximately 2.1 times higher than those at site S3 (parkland), which had the lowest levels. View evidence ↗
- The use of hydrofluoric acid (HF) was critical, as omitting it resulted in 15-20% lower values for Ce and La. View evidence ↗
What it means
- The authors conclude that the developed ICP-OES method is a reliable tool for quantifying La, Ce, Nd, and Y in soil, with recoveries over 92%. View evidence ↗
- The method is recommended for routine environmental monitoring in cases where ICP-MS is too expensive or unavailable. View evidence ↗
- A limitation of the study is its focus on only four REEs; the authors suggest that including a broader suite of elements would provide a more complete geochemical fingerprint. View evidence ↗
Visual summary
1 visualsIllustrations explain the paper; charts are replotted from the paper's own table values.
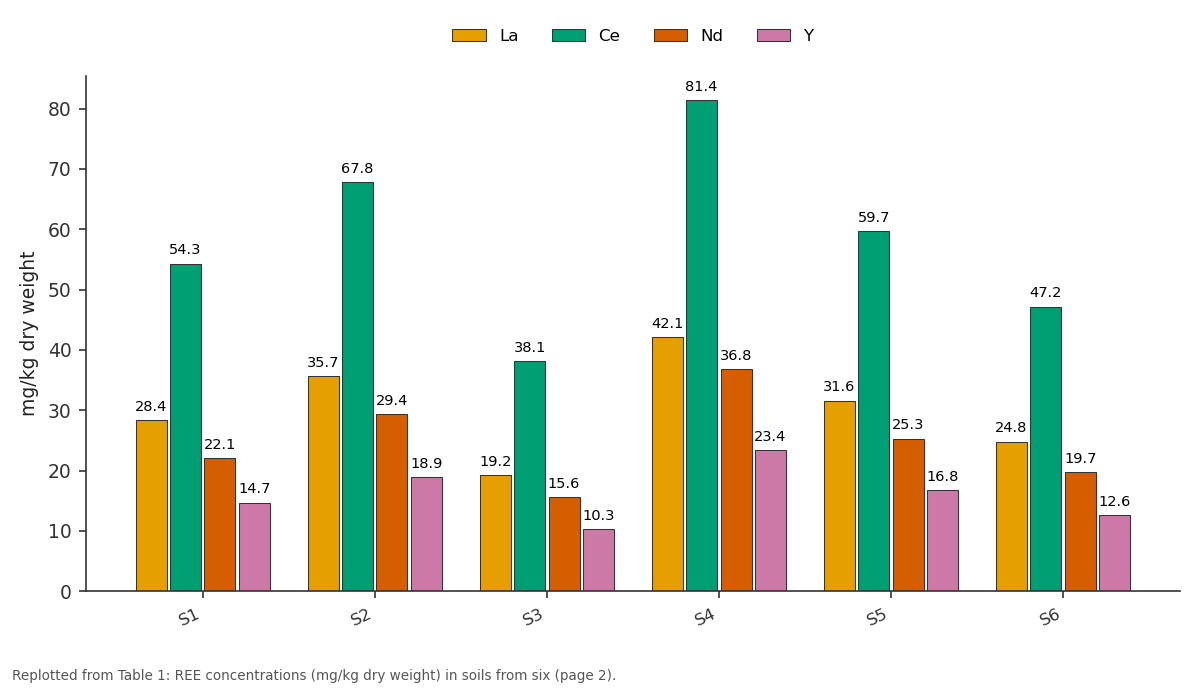
La and Ce and more: S1 vs S2 vs S3 vs S4 vs S5
Replotted from Table 1 (page 2) of the original paper. Every bar is the paper's own table value.
View source evidence ↗Figures & tables
From the original paper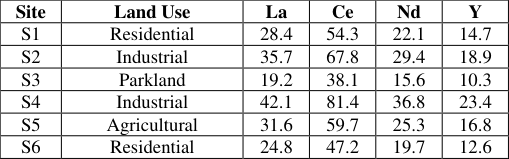 Table 1
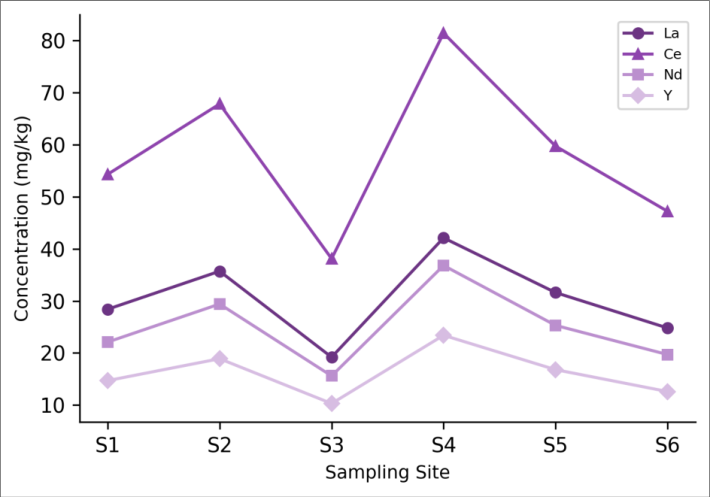 Figure 1
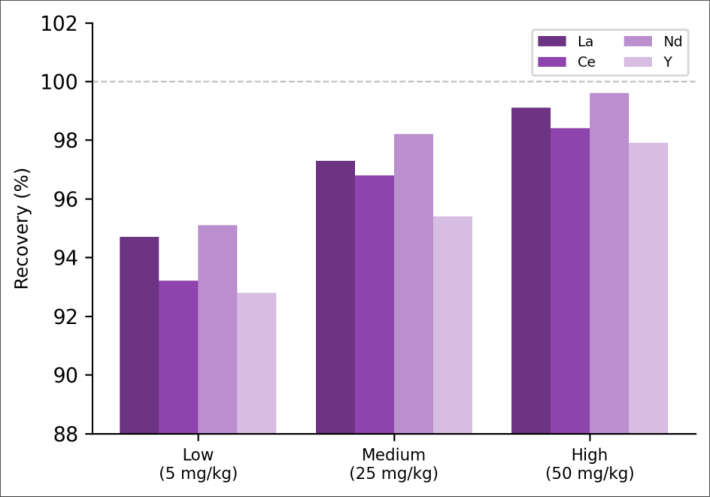 Figure 2
Introduction
When Carl Auer von Welsbach first separated didymium into praseodymium and neodymium in 1885, rare earth elements were little more than a chemical curiosity [1] . Today they are essential components in magnets, catalysts, phosphors, and rechargeable batteries, and global demand has risen sharply alongside the expansion of electric vehicles and wind turbines [2] . Australia holds roughly 4% of the world's known REE reserves, much of it concentrated in Western Australia, yet systematic data on how REEs distribute themselves in urban and peri-urban soils near mining or processing facilities is limited [3] . Analytical determination of REEs in solid environmental matrices presents several challenges. The elements share similar ionic radii and chemical behaviour, which can cause spectral overlaps in emission-based techniques [4] . ICP-MS is often considered the gold standard for trace-level REE analysis because of its low detection limits, but the equipment and operating costs are significantly higher than those for ICP-OES [5] . For routine monitoring programs where concentrations sit above a few mg/kg, ICP-OES provides a practical and less expensive alternative, especially when careful wavelength selection reduces spectral interference [6,7] . Sample preparation is equally important. Incomplete digestion of refractory minerals like zircon and monazite can lead to underestimation of true REE content [8] . Hydrofluoric acid is typically required to break down silicate lattices, and microwave-assisted digestion offers faster, more reproducible extraction than open-vessel hot-plate methods [9] . This research combined microwave-assisted digestion with ICP-OES to quantify La, Ce, Nd, and Y in soils collected from six sites of varying land use around Perth, and validated the method against certified reference materials and spike recovery experiments [10] .
Theoretical Background ICP-OES measures the characteristic emission wavelengths of atoms and ions excited in an argon plasma at temperatures near 7000-8000 K. Each element emits at multiple wavelengths, and selecting lines free of spectral interference is critical for accurate REE analysis [4] . For La, the 408.672 nm line offers good sensitivity with minimal overlap. Ce at 413.764 nm avoids strong iron interferences. Nd at 430.358 nm and Y at 371.029 nm were chosen following preliminary spectral scanning. Matrix-matched calibration and internal standardisation (using Rh at 343.489 nm) helped correct for plasma fluctuations and matrix suppression [6] .
Materials and Methods
Materials and Methods
Materials
Surface soil (0-20 cm depth) was collected from six locations around Perth in August 2023: two residential areas (S1, S6), one parkland (S3), one agricultural field (S5), and two near industrial zones (S2, S4). At each site, five subsamples were composited. Soils were air-dried, sieved through 2 mm mesh, ground to <75 μm, and stored in polyethylene bags. Certified reference material NIST SRM 2709a (San Joaquin Soil) was used for accuracy verification. The research was performed at the Coral Sea Institute of Technology, Perth, between August 2023 and January 2024, under departmental protocol CSIT-IA-2023-028.
Methods
Digestion followed a microwave-assisted procedure: 0.25 g soil was placed in a PTFE vessel with 6 mL HNO₃ (65%), 2 mL HCl (37%), and 1 mL HF (48%). Vessels were ramped to 190°C over 20 min and held for 30 min in a Milestone ETHOS UP system. After cooling, 10 mL saturated boric acid was added to neutralise residual HF. Digests were diluted to 50 mL with ultrapure water [9] . Measurement used a PerkinElmer Optima 8300 ICP-OES in axial viewing mode, with a concentric nebuliser and cyclonic spray chamber. Calibration used multi-element standards (0.1-100 mg/L) prepared from NIST-traceable stock solutions. All analyses were performed in triplicate. Detection limits were calculated as 3σ of ten blank digestions [10,11] .
Instrumentation
The PerkinElmer Optima 8300 dual-view ICP-OES was operated at 1350 W RF power, with a plasma gas flow of 15 L/min, auxiliary gas 0.2 L/min, and nebuliser gas 0.65 L/min. Sample uptake rate was 1.5 mL/min. Three-point background correction was applied. Rhodium (5 mg/L) served as an internal standard to compensate for signal drift. Wavelength calibration was checked at the start of each session against a mercury lamp.
Results
Cerium was the most abundant REE across all six sites, followed by lanthanum, neodymium, and yttrium. Site S4, located near an industrial processing zone, showed the highest concentrations for all four elements. The Ce:La ratio remained fairly stable across sites (around 1.9:1), consistent with upper continental crust averages. REE totals at S4 were about 2.1 times higher than at S3, the lowest site. Ce tracked the same spatial pattern as the other three elements but at roughly double the concentration, reflecting its natural crustal abundance (Figure 1). Site S4 stood out clearly as the most enriched location. Recoveries improved with spike level, ranging from 92.8% (Y at low spike) to 99.6% (Nd at high spike), confirming that the digestion procedure was effective across the tested concentration range (Figure 2).
Discussion
The REE concentrations measured here fall within the broad range reported for Australian soils in general. Liang et al. [7] documented Ce levels of 40-90 mg/kg in New South Wales agricultural soils, and our Perth data (38.1-81.4 mg/kg) overlap comfortably with that range. The elevated values at S4 likely reflect proximity to an industrial facility that processes mineral sandsa known source of REE-bearing dust and runoff [3] . Method detection limits (0.03-0.11 mg/kg) were adequate for the concentrations encountered but would fall short for ultra-trace work, where ICP-MS would be the better choice. The HF step was essential: preliminary tests omitting HF yielded 15-20% lower Ce and La values, presumably because silicate-hosted REEs weren't fully released [8] . Boric acid addition after digestion effectively complexed residual fluoride, protecting the quartz torch and spray chamber.
One limitation worth noting is that the research focused on only four REEs. A broader suiteincluding Pr, Sm, Eu, Gd, and the heavy REEswould give a more complete geochemical fingerprint and allow normalisation to chondrite or upper crust values [12,13] . Extending the method to the full 14-element lanthanide series on ICP-OES is possible but requires more careful interference management, particularly for Gd and Eu, which have emission lines that overlap with Ba.
Conclusion
The ICP-OES method developed here reliably quantified La, Ce, Nd, and Y in Perth-area soils, with detection limits below 0.12 mg/kg and recoveries exceeding 92%. Cerium was the dominant REE at every site, and industrial-adjacent soils showed the highest concentrations.
Acknowledgement
Acknowledgements Funding SourcesThis research was funded by the Coral Sea Institute of Technology departmental grant programme. Institutional SupportThe authors acknowledge the analytical chemistry laboratory staff at CSIT, Perth.
Figures and tables from the paper
| Site | Land Use | La | Ce | Nd | Y |
|---|---|---|---|---|---|
| S1 | Residential | 28.4 | 54.3 | 22.1 | 14.7 |
| S2 | Industrial | 35.7 | 67.8 | 29.4 | 18.9 |
| S3 | Parkland | 19.2 | 38.1 | 15.6 | 10.3 |
| S4 | Industrial | 42.1 | 81.4 | 36.8 | 23.4 |
| S5 | Agricultural | 31.6 | 59.7 | 25.3 | 16.8 |
| S6 | Residential | 24.8 | 47.2 | 19.7 | 12.6 |
Table text extracted from the original PDF; superscript letters are shown inline. The original table image is below.