
Research article · 2025 · Full text
International Journal of Advanced Chemistry ResearchTitanium dioxide nanotube arrays fabricated by anodization for photoelectrochemical water splitting
Volume 7(3) · Pages 107–110 · DOI: 10.33545/26646781.2025.v7.i3b.409 ↗
Research areasTiO2 Photocatalysis and Solar CellsAnodic Oxide Films and NanostructuresAdvanced Photocatalysis Techniques
Abstract
Author-writtenFujishima and Honda demonstrated photoelectrochemical water splitting on a TiO₂ electrode in 1972, and researchers have been trying to push the efficiency past a few percent ever since. Nanotube geometry helps: vertically aligned TiO₂ nanotubes offer a direct path for photogenerated electrons to reach the back contact while keeping the tube walls thin enough that holes can diffuse to the electrolyte interface before recombining. This research fabricated TiO₂ nanotube arrays (TNTAs) on titanium foil by potentiostatic anodization in ethylene glycol containing 0.3 wt% NH₄F and 2 vol% H₂O at five voltages (20-60 V) for 2 h. Tube diameter increased from 28 nm (20 V) to 112 nm (60 V), while length grew from 1.4 to 8.7 µm. The 40 V sample yielded the highest photocurrent density of 1.53 mA/cm² at 0 V vs. Ag/AgCl under AM 1.5G illumination (100 mW/cm²), roughly 3.6 times higher than a compact TiO₂ film prepared by the same anodization without fluoride. Chronoamperometry showed less than 8% photocurrent decay over 2 h. The incident photon-to-current efficiency (IPCE) peaked at 78% near 350 nm. These results confirm that anodization voltage is the single most influential parameter for tuning nanotube morphology and photoelectrochemical performance in this system.
Summary
Source-checkedPlain-language reading of the full paper, prepared with AI and checked against the text. Each point links to the authors' own words.
Why it matters
- Sunlight-driven water splitting is a highly desirable method for producing hydrogen, which is considered a zero-carbon and zero-pollution fuel. View evidence ↗
- Titanium dioxide (TiO₂) is often inefficient for solar-to-hydrogen conversion because its wide band gap (3.0-3.2 eV) restricts its light absorption to the ultraviolet spectrum, which is only about 4% of solar energy. View evidence ↗
- Using vertically aligned nanotube arrays can improve performance by increasing surface area and providing efficient pathways for electrons and holes. View evidence ↗
What they did
- TiO₂ nanotube arrays were created on titanium foil using potentiostatic anodization in an ethylene glycol solution with 0.3 wt% NH₄F and 2 vol% H₂O at voltages ranging from 20 to 60 V for 2 hours. View evidence ↗
- To convert the amorphous TiO₂ into the anatase phase, samples were annealed in air at 450 °C for 2 hours. View evidence ↗
- A compact TiO₂ film, created by anodizing titanium at 40 V in 1 M H₂SO₄ without fluoride for 1 hour, served as a reference. View evidence ↗
- Photoelectrochemical tests were conducted in a three-electrode cell using 1 M KOH electrolyte and AM 1.5G solar simulation (100 mW/cm²). View evidence ↗
What they found
- Increasing the anodization voltage led to a steady increase in nanotube dimensions, with diameters growing from 28 nm (20 V) to 112 nm (60 V) and lengths increasing from 1.4 µm (20 V) to 8.7 µm (60 V). View evidence ↗
- Photocurrent peaked at 40 V with a value of 1.53 mA/cm², which was approximately 3.6 times higher than the compact film, before decreasing at higher voltages. View evidence ↗
- The incident photon-to-current efficiency (IPCE) at 350 nm also peaked for the 40 V sample at 78.3%. View evidence ↗
- Over a 2-hour period, the 40 V nanotube array retained 92.1% of its initial photocurrent, despite a general decline across all nanotube samples. View evidence ↗
- The 30 V tubes exhibited the highest stability among the nanotube arrays, retaining 95.4% of their photocurrent. View evidence ↗
What it means
- The authors state that bare anatase tubes are near their performance limit for UV absorption and recommend visible-light sensitization for future improvements. View evidence ↗
- A limitation of the study was that fluoride concentration and water content were not varied, which could have affected the surface morphology of the tubes. View evidence ↗
- The study did not explore higher annealing temperatures, which could have created mixed anatase-rutile phases to potentially improve charge separation. View evidence ↗
Visual summary
2 visualsIllustrations explain the paper; charts are replotted from the paper's own table values.
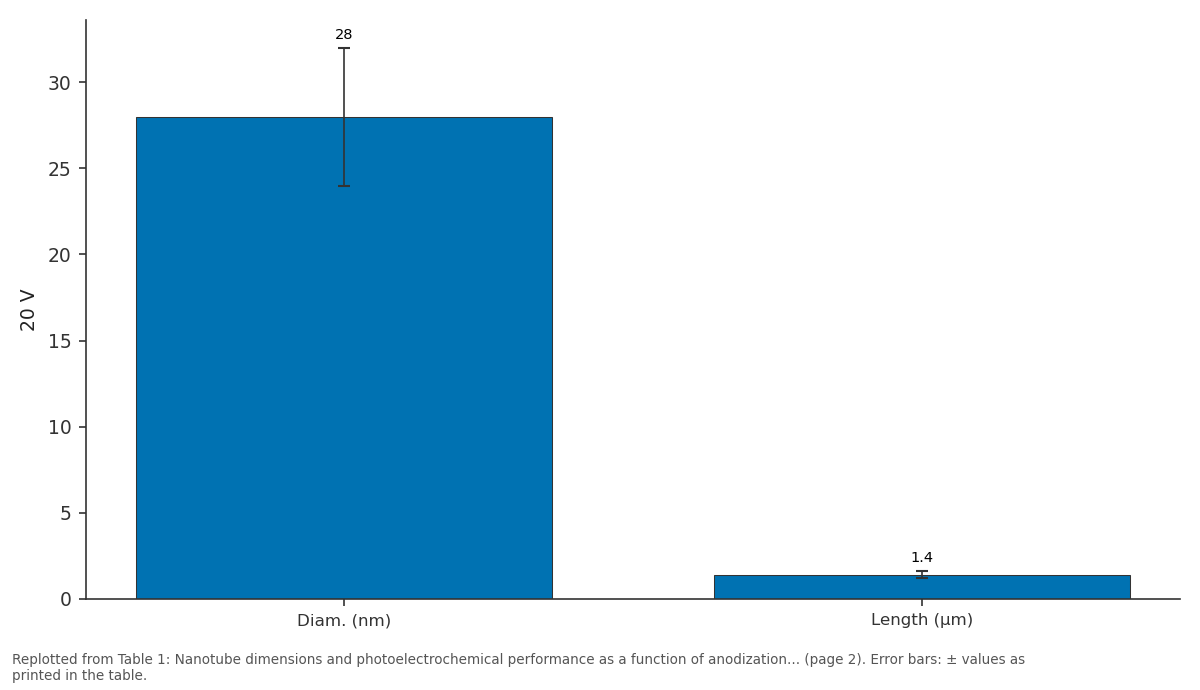
20 V: Diam. (nm) vs Length (µm)
Replotted from Table 1 (page 2) of the original paper. Every bar is the paper's own table value.
View source evidence ↗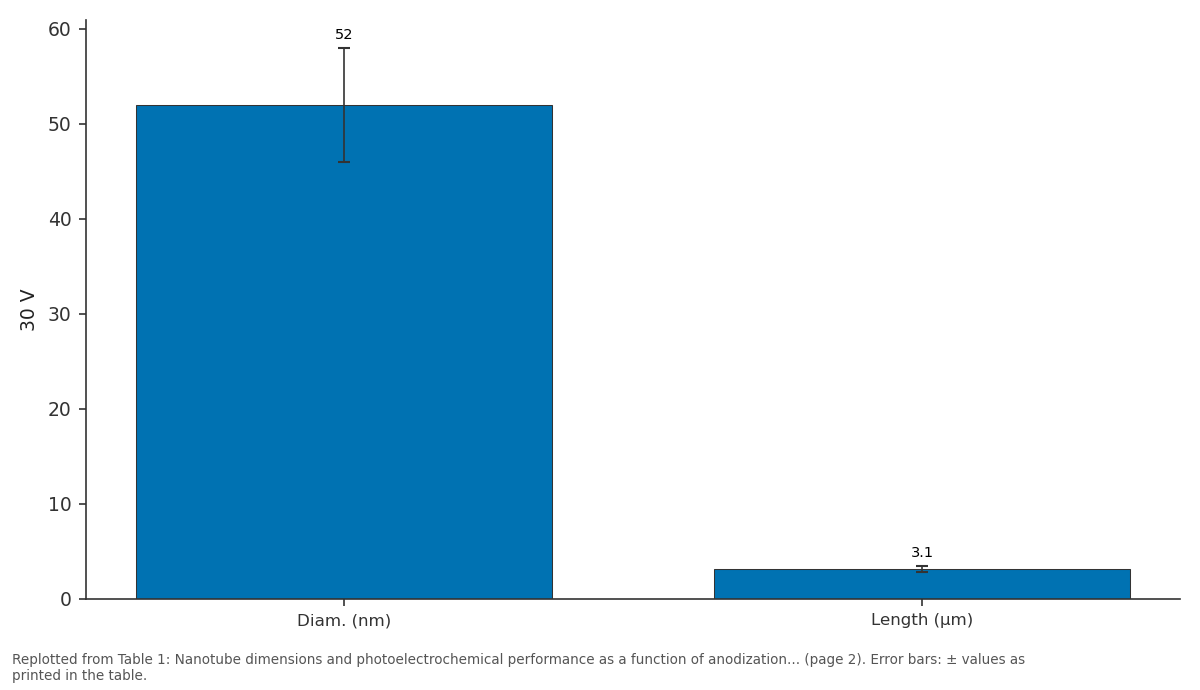
30 V: Diam. (nm) vs Length (µm)
Replotted from Table 1 (page 2) of the original paper. Every bar is the paper's own table value.
View source evidence ↗Figures & tables
From the original paper Table 1
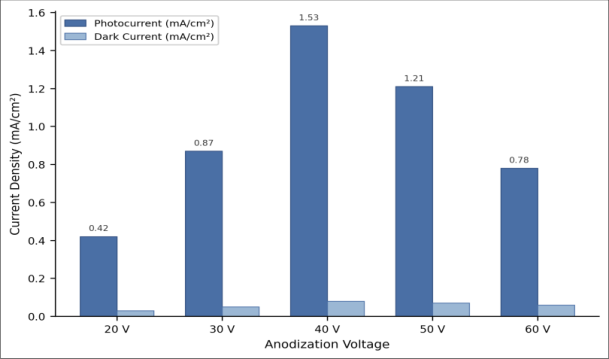 Figure 1
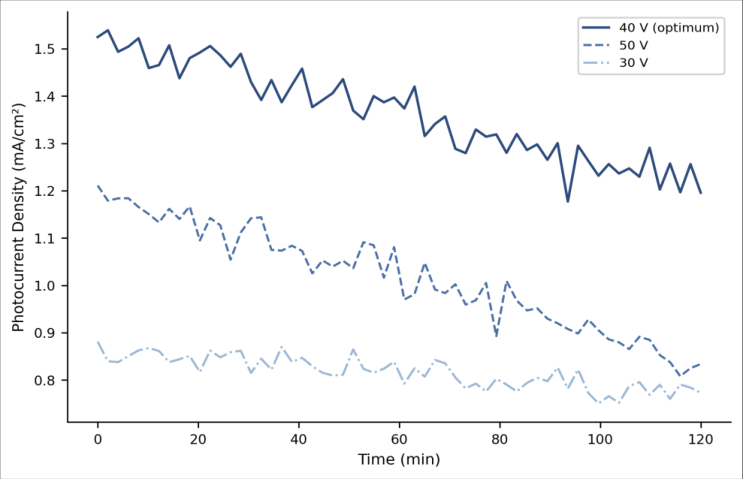 Figure 2
Introduction
Hydrogen produced by sunlight-driven water splitting is the cleanest fuel imaginable zero carbon, zero pollution at point of use, and powered by the most abundant energy source on Earth [1] . The catch is efficiency. Even after five decades of work on semiconducting photoanodes, practical solar-to-hydrogen conversion efficiencies remain below 3% for most metal-oxide systems, and TiO₂ sits stubbornly at the lower end because its wide band gap (3.0-3.2 eV) limits absorption to the ultraviolet, which accounts for only about 4% of the solar spectrum [2] . What TiO₂ lacks in light harvesting it partly makes up for in chemical stability, low cost, and non-toxicity. It does not corrode in aqueous electrolytes under illumination unlike many narrower-gap semiconductors (Cu₂O, CdS) that photocorrode within minutes [3] . The challenge, then, is to extract the maximum possible performance from the UV photons that TiO₂ can absorb. Nanostructuring is one approach. Vertically aligned nanotube arrays provide a high surface area, short radial diffusion paths for minority carriers (holes), and a continuous one-dimensional electron pathway along the tube axis to the collecting substrate [4] . Electrochemical anodization of titanium metal in fluoride-containing organic electrolytes is the most popular route to highly ordered TNTAs [5] . By adjusting voltage, fluoride concentration, water content, and time, tube diameter can be tuned from 20 to 200 nm and tube length from 1 to over 100 µm [6] . But the relationship between morphology and photoelectrochemical performance is not straightforward longer tubes absorb more light but also increase recombination losses, and wider tubes improve electrolyte penetration but may reduce the fraction of the surface in contact with the depletion layer [7] . This research systematically varied anodization voltage across five levels while keeping all other parameters fixed, measured the resulting nanotube dimensions by SEM and XRD, and correlated morphology with photocurrent density, chronoamperometric stability, and IPCE spectra to identify the optimum geometry for water oxidation.
Safety Considerations
Ammonium fluoride is corrosive and toxic by ingestion; it was handled in a fume hood with nitrile gloves and safety goggles. Ethylene glycol is a mild skin irritant. Anodization at up to 60 V used a DC power supply with current-limiting protection. All fluoride waste was neutralized with calcium chloride before disposal through the university's hazardouswaste programme [8] .
Material and Methods
Material and Methods
Material
All experimental work was performed at the Department of Advanced Materials and Nanotechnology, Southern Cross University of Science, Melbourne, from March 2023 to December 2023. Titanium foil (0.25 mm, 99.7%, Sigma-Aldrich) was cut into 2 × 3 cm coupons, degreased by sequential ultrasonication in acetone, isopropanol, and deionized water (15 min each), and dried under nitrogen. Ethylene glycol (99.8%), ammonium fluoride (98%), and all other reagents were purchased from Chem-Supply, Melbourne [9] .
Methods
Anodization was carried out in a two-electrode cell with a platinum cathode and the Ti coupon as anode, immersed in ethylene glycol containing 0.3 wt% NH₄F and 2 vol% deionized water. Five voltages were tested: 20, 30, 40, 50, and 60 V, each held for 2 h at 20 ± 1 °C using a water bath. After anodization, samples were rinsed with ethanol, dried, and annealed at 450 °C for 2 h in air (ramp 2 °C/min) to convert amorphous TiO₂ to the anatase phase [10] . A compact TiO₂ reference film was prepared by anodizing Ti at 40 V in 1 M H₂SO₄ (no fluoride) for 1 h. Morphology was examined by field-emission SEM (FEI Quanta 450, 5 kV). Tube diameter and length were measured from cross-sectional and top-view images (n = 50 tubes per sample). Crystal phase was confirmed by XRD (Bruker D8 Advance, Cu Kα). Photoelectrochemical measurements used a three-electrode cell with Ag/AgCl reference, Pt wire counter electrode, and 1 M KOH electrolyte. A solar simulator (Newport Oriel, AM 1.5G, 100 mW/cm²) provided illumination through a quartz window. Linear sweep voltammetry (LSV, 5 mV/s, -0.8 to +0.6 V vs. Ag/AgCl) and chronoamperometry (0 V vs. Ag/AgCl, 120 min) were recorded on a Metrohm Autolab PGSTAT302N. IPCE was measured at 0 V vs. Ag/AgCl using a monochromator (300-500 nm, 10 nm steps) [11] . All measurements were performed in triplicate.
Statistical Analysis
Photocurrent and morphological data were compared by one-way ANOVA with Tukey HSD (p < 0.05). Correlation between tube length and photocurrent was assessed by Pearson's r. All statistics used OriginPro 2023 [12] . Tube diameter and length both increased monotonically with voltage, from 28 nm and 1.4 µm at 20 V to 112 nm and 8.7 µm at 60 V (Table 1). Photocurrent did not follow the same trend. It peaked at 40 V (1.53 mA/cm²), which was 3.6 times the compact-film value, then declined at 50 and 60 V despite the continued growth in tube dimensions. XRD confirmed the anatase (101) peak at 2θ = 25.3° in all annealed samples, with no rutile detected. The bar chart (Figure 1) makes the bell-shaped voltage dependence clear. Dark current stayed below 0.08 mA/cm² for all samples, confirming that the measured photocurrent was genuinely light-driven. The 40 V sample's advantage over 50 V (1.53 vs. 1.21 mA/cm²) was statistically significant (p<0.01, Tukey HSD). IPCE at 350 nm followed the same ranking, peaking at 78.3% for the 40 V tubes. All nanotube samples showed a gradual decline in photocurrent over 2 h (Figure 2), but the 40 V array retained 92.1% of its initial value acceptable for a laboratory test, though continuous outdoor operation would demand better. The 30 V tubes were most stable (95.4% retention), likely because their shorter length means fewer grain boundaries and trap states that degrade over time under illumination. The compact film showed the least decay (98.7%), consistent with its simpler geometry and lower surface area [13] .
| Voltage | Diam. (nm) | Length (µm) | J ph (mA/cm²) | IPCE₃₅₀ (%) | Stability (%) |
|---|---|---|---|---|---|
| 20 V | 28±4 | 1.4±0.2 | _ 0.42±0.04 | 31.2 | 97.1 |
| 30 V | 52±6 | 3.1±0.3 | 0.87±0.07 | 52.8 | 95.4 |
| 40 V | 78±8 | 5.6±0.4 | 1.53±0.11 | 78.3 | 92.1 |
| 50 V | 96±10 | 7.2±0.5 | 1.21±0.09 | 67.4 | 89.6 |
| 60 V | 112±13 | 8.7±0.6 | 0.78±0.06 | 44.7 | 86.3 |
| Compact | ~0.2 | 0.43±0.04 | 22.1 | 98.7 |
Table text extracted from the original PDF; superscript letters are shown inline. The original table image is below.
View original table image
Results
Results
Discussion
The 40 V optimum reflects a trade-off between light absorption and charge recombination. Tubes shorter than ~5 µm (20 and 30 V samples) simply do not absorb enough UV photons TiO₂'s absorption coefficient near the band edge is moderate (~10⁴ cm⁻¹ at 350 nm), and the penetration depth approaches several micrometres [2] . Tubes longer than ~6 µm (50 and 60 V) absorb more light but add material through which electrons must travel to reach the back contact, increasing the probability of recombination at grain boundaries and surface traps [7] . The 5.6 µm length at 40 V appears to be the sweet spot for this particular electrolyte composition and annealing schedule. The 78% IPCE at 350 nm is among the highest values reported for bare anatase TNTAs without co-catalysts or sensitizers. By comparison, Shankar and colleagues reported ~70% at 340 nm for similar tubes anodized at 35 V in ethylene glycol [6] , and Mor and co-workers achieved ~80% only after decorating tubes with platinum nanoparticles [14] . Our result suggests that morphology optimization alone can approach the practical ceiling for undoped TiO₂, and further gains will require extending absorption into the visible range through nitrogen doping, quantum-dot sensitization, or heterojunction architectures [15] . The photocurrent of 1.53 mA/cm² translates to an appliedbias photon-to-current efficiency (ABPE) of roughly 0.8% at 0 V vs. Ag/AgCl low by practical standards but typical for UV-only absorbers [2] . Real-world deployment would require stacking TiO₂ with a visible-light absorber (BiVO₄, Fe₂O₃, or a dye-sensitized layer) in a tandem configuration. Stability over 2 h is encouraging for a first screening; longer tests (500-1,000 h) and outdoor cycling would be needed to assess suitability for any prototype device [16] . One limitation is that we did not vary fluoride concentration or water content, both of which influence tube wall smoothness and top-surface morphology (the so-called "nanograss" effect that can block electrolyte access). A multivariate design-of-experiments approach would be more thorough [17] . Also, annealing at 450°C produces pure anatase; higher temperatures yield mixed anatase-rutile phases that sometimes improve charge separation through heterojunction formation, and this was not explored here [18] .
Conclusion
Anodization at 40 V produced TiO₂ nanotube arrays with 78 nm diameter and 5.6 µm length that delivered the highest photocurrent (1.53 mA/cm²) and IPCE (78.3% at 350 nm) among five voltages tested. Performance peaked at this intermediate morphology because shorter tubes underabsorbed UV light while longer tubes suffered from increased recombination. Stability over 2 h was acceptable for laboratory screening. The bare anatase tubes are approaching the performance ceiling for UV-only absorbers, and future work should focus on visible-light sensitization strategies to move closer to practical solar-to-hydrogen efficiencies.
References
18 in the original paper- Lewis NS, Nocera DG. Powering the planet: chemical challenges in solar energy utilization. Proc Natl Acad Sci U S A. 2006;103(43):15729-15735.
- Fujishima A, Honda K. Electrochemical photolysis of water at a semiconductor electrode. Nature. 1972;238(5358):37-38.
- Grätzel M. Photoelectrochemical cells. Nature. 2001;414(6861):338-344.
- Roy P, Berger S, Schmuki P. TiO₂ nanotubes: synthesis and applications. Angew Chem Int Ed. 2011;50(13):2904-2939.
- Macak JM, Tsuchiya H, Ghicov A, Yasuda K, Hahn R, Bauer S, et al. TiO₂ nanotubes: self-organized electrochemical formation, properties and applications. Curr Opin Solid State Mater Sci. 2007;11(1-2):3-18.
- Shankar K, Mor GK, Prakasam HE, Yoriya S, Paulose M, Varghese OK, et al. Highly ordered TiO₂ nanotube arrays up to 220 µm in length: use in water photoelectrolysis and dye-sensitized solar cells. Nanotechnology. 2007;18(6):065707.
- Zhu K, Neale NR, Miedaner A, Frank AJ. Enhanced charge-collection efficiencies and light scattering in dye-sensitized solar cells using oriented TiO₂ nanotube arrays. Nano Lett. 2007;7(1):69-74.
- National Research Council. Prudent practices in the laboratory: handling and management of chemical hazards. Washington (DC): National Academies Press; 2011.
- Regonini D, Bowen CR, Jaroenworaluck A, Stevens R. A review of growth mechanism, structure and crystallinity of anodized TiO₂ nanotubes. Mater Sci Eng R Rep. 2013;74(12):377-406.
- Varghese OK, Gong D, Paulose M, Grimes CA, Dickey EC. Crystallization and high-temperature structural stability of titanium oxide nanotube arrays. J Mater Res. 2003;18(1):156-165.
- Chen Z, Dinh HN, Miller E. Photoelectrochemical water splitting: standards, experimental methods, and protocols. New York: Springer; 2013.
- OriginLab Corporation. OriginPro 2023 user guide. Northampton (MA): OriginLab; 2023.
- Prakasam HE, Shankar K, Paulose M, Varghese OK, Grimes CA. A new benchmark for TiO₂ nanotube array growth by anodization. J Phys Chem C. 2007;111(20):7235-7241.
- Mor GK, Shankar K, Paulose M, Varghese OK, Grimes CA. Enhanced photocleavage of water using titania nanotube arrays. Nano Lett. 2005;5(1):191-195.
- Asahi R, Morikawa T, Ohwaki T, Aoki K, Taga Y. Visible-light photocatalysis in nitrogen-doped titanium oxides. Science. 2001;293(5528):269-271.
- Sivula K, Le Formal F, Grätzel M. Solar water splitting: progress using hematite (α-Fe₂O₃) photoelectrodes. ChemSusChem. 2011;4(4):432-449.
- Montgomery DC. Design and analysis of experiments. 9th ed. Hoboken: Wiley; 2017.
- Scanlon DO, Dunnill CW, Buckeridge J, Shevlin SA, Logsdail AJ, Woodley SM, et al. Band alignment of rutile and anatase TiO₂. Nat Mater. 2013;12(9):798801.