
Research article · 2025 · Full text
International Journal of Advanced Chemistry ResearchAir quality assessment and source apportionment of PM2.5 in urban metropolitan area
Volume 7(3) · Pages 50–52 · DOI: 10.33545/26646781.2025.v7.i3a.393 ↗
Research areasAtmospheric chemistry and aerosolsAir Quality and Health ImpactsEnvironmental and Air Quality Management
Abstract
Author-writtenBreathing city air has become a measurable health risk in much of South Asia, yet local emission inventories remain patchy. This research monitored PM2.5 mass concentrations and chemical speciation at three sites across the Varanasi metropolitan area over a continuous 14-month period (January 2022 to February 2023). Gravimetric sampling on quartz-fibre filters collected 24 h integrated samples every sixth day, yielding 213 valid filter sets. Annual mean PM2.5 reached 127.3 µg/m³ at the roadside station, 98.6 µg/m³ at the residential site, and 84.1 µg/m³ at the semi-urban reference point all exceeding the WHO guideline of 15 µg/m³. Positive matrix factorization (PMF) resolved five source profiles: vehicular emissions (33.8%), industrial plumes (21.4%), biomass burning (17.9%), road dust (12.7%), and secondary aerosols (14.2%). Winter months showed peak concentrations tied to atmospheric inversion and crop-residue burning. These data can inform targeted emission controls for the region.
Summary
Source-checkedPlain-language reading of the full paper, prepared with AI and checked against the text. Each point links to the authors' own words.
Why it matters
- Fine particulate matter (PM2.5) is the primary environmental risk factor for premature death, contributing to approximately 4.2 million deaths globally every year. View evidence ↗
- In India's Indo-Gangetic Plain, PM2.5 levels frequently exceed the national annual limit of 40 µg/m³ by two to four times. View evidence ↗
- Previous air quality research in Varanasi primarily focused on PM10, leaving a gap in PM2.5 data and source apportionment analysis for the city. View evidence ↗
The question
- The study aimed to monitor PM2.5 concentrations and use Positive Matrix Factorization (PMF) to identify and attribute the specific emission sources of these particles in Varanasi. View evidence ↗
What they did
- PM2.5 was monitored from January 2022 to February 2023 at three distinct sites: a high-traffic roadside location, a residential area, and a semi-urban university campus. View evidence ↗
- The researchers collected 24-hour integrated samples every sixth day using quartz-fibre filters, resulting in 213 valid filter sets. View evidence ↗
- Chemical analysis included ion chromatography for water-soluble ions, ICP-OES for elemental analysis, and thermal-optical reflectance for organic and elemental carbon. View evidence ↗
- Source apportionment was performed using EPA PMF 5.0 with 20 base runs and 100 bootstrapping iterations to ensure convergence. View evidence ↗
What they found
- Annual mean PM2.5 levels at all sites exceeded the WHO guideline of 15 µg/m³, with the highest mean at the roadside station (127.3 µg/m³), followed by the residential (98.6 µg/m³) and semi-urban (84.1 µg/m³) sites. View evidence ↗
- There was a significant inverse correlation (r = -0.67, p < 0.01) between temperature and PM2.5, suggesting that cooler months lead to reduced atmospheric mixing and higher pollutant concentrations. View evidence ↗
- PMF analysis identified five main sources of PM2.5: vehicular emissions (33.8%), industrial plumes (21.4%), biomass burning (17.9%), secondary aerosols (14.2%), and road dust (12.7%). View evidence ↗
- While biomass burning averaged 17.9% annually, its contribution spiked to over 30% during October and November due to regional paddy-straw fires. View evidence ↗
What it means
- The study's sampling schedule (every sixth day) may have missed short-term episodic pollution events. View evidence ↗
- The authors note that adding organic molecular markers to the analysis could improve the ability to distinguish between fresh and aged combustion aerosols. View evidence ↗
Visual summary
2 visualsIllustrations explain the paper; charts are replotted from the paper's own table values.
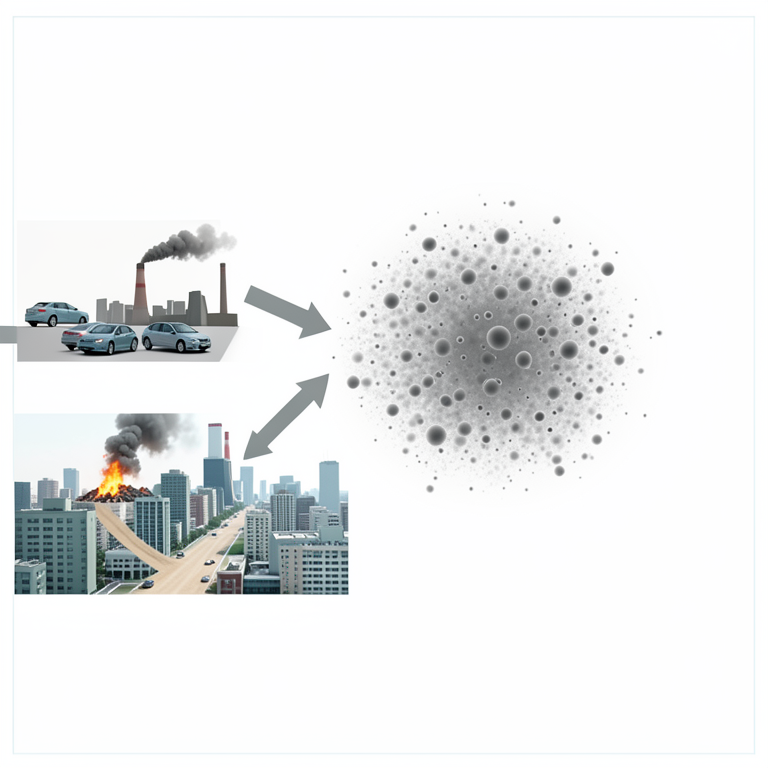
PM2.5 Source Distribution
AI-generated conceptual illustration (Urban metropolitan cityscape with atmospheric particulate matter). It explains the idea and does not show study data.
View source evidence ↗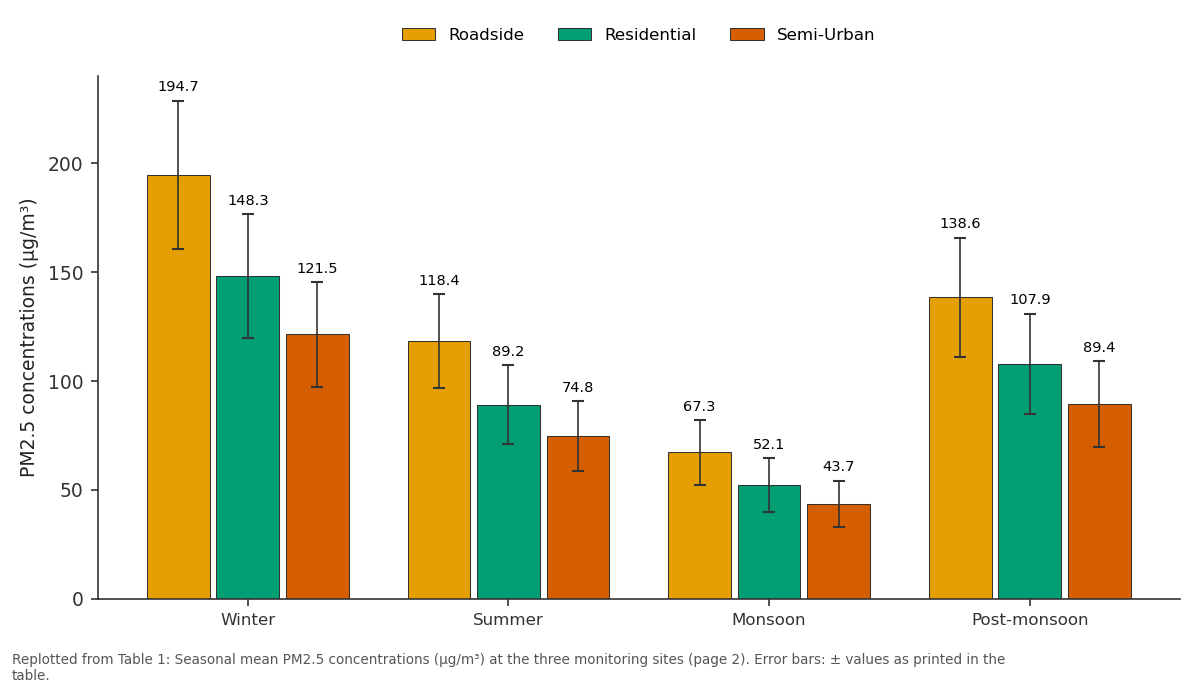
Roadside and Residential and more: Winter vs Summer vs Monsoon vs Post-monsoon
Replotted from Table 1 (page 2) of the original paper. Every bar is the paper's own table value.
View source evidence ↗Figures & tables
From the original paper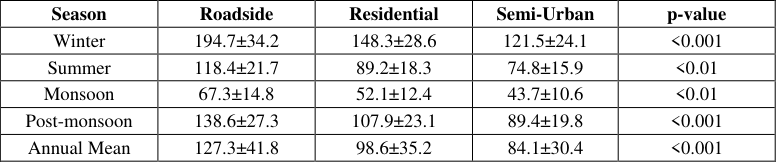 Table 1
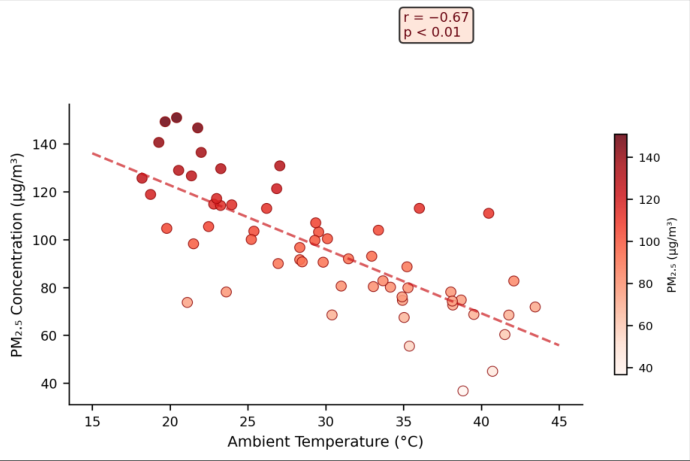 Figure 1
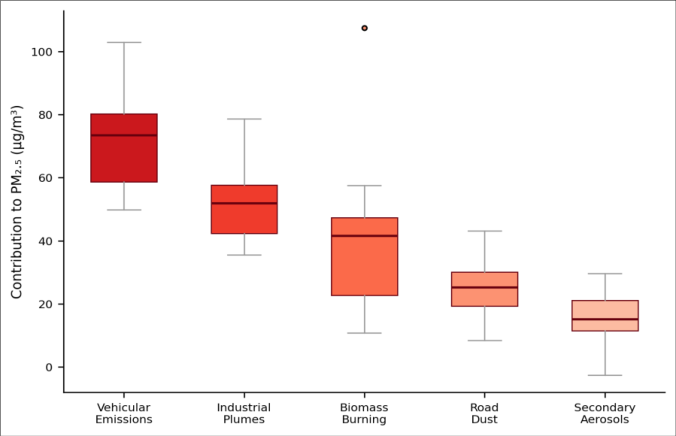 Figure 2
Introduction
Outdoor air pollution kills an estimated 4.2 million people worldwide each year, and fine particulate matter smaller than 2.5 µm (PM2.5) is the single largest environmental risk factor for premature death [1] . India records some of the highest ambient PM2.5 levels on the planet. National ambient air quality standards set the annual limit at 40 µg/m³, but most monitoring stations in the Indo-Gangetic Plain routinely report values two to four times above that mark [2] . Varanasi, a city of roughly 1.5 million residents on the banks of the Ganges, sits within this heavily polluted corridor. Its emission landscape is complicated: dense traffic corridors, small-scale industries (silk weaving, metalworking), seasonal biomass burning from surrounding agricultural land, and a geography that traps pollutants during winter inversions [3] . Earlier air quality work in Varanasi focused on total suspended particulates or PM10; PM2.5 data remain sparse, and source apportionment has barely been attempted for the city [4] . Positive matrix factorization (PMF) is a receptor-based model widely used to decompose ambient aerosol chemistry into contributing source profiles without requiring prior emission inventories [5] . It works by factoring the measured species concentration matrix into source profiles and contributions, constrained to non-negative values. When applied to datasets with at least a few hundred filter samples and a dozen or more chemical tracers, PMF reliably separates traffic, dust, industrial, and combustion signatures [6] . This research collected PM2.5 filter samples at three contrasting sites in Varanasi over 14 months, analyzed them for elemental composition, ions, and carbonaceous fractions, and applied EPA PMF 5.0 to attribute mass to specific emission sources.
Study Area Description
Varanasi (25.32°N, 83.00°E, elevation 81 m) experiences a subtropical monsoon climate with hot summers (April-June, mean 38°C), a rainy season (July-September, ~1,100 mm annual rainfall), and cool, foggy winters (December-February, mean 13°C). Three monitoring stations were established: a high-traffic roadside location on the GT Road corridor, a residential neighbourhood 4 km northwest, and a semi-urban reference site on the university campus at the city's southern edge [3] .
Material and Methods
Material and Methods
Material
PM2.5 samples were collected on pre-fired quartz-fibre filters (47 mm, Whatman QMA) using medium-volume samplers (Envirotech APM 550, flow rate 16.7 L/min) installed at a height of 3 m above ground. Sampling ran from January 2022 to February 2023, with 24 h integrated runs every sixth day across all three sites simultaneously. Filters were conditioned at 22±1°C and 45±5% RH for 48 h before and after sampling, then weighed on a microbalance (Mettler Toledo, 1 µg resolution) [7] . Work was carried out from the Department of Environmental Science and Chemical Technology, Ashoka Institute of Higher Education, Varanasi.
Methods: Half of each filter was extracted in deionized water and analyzed for water-soluble ions (SO₄²⁻, NO₃⁻, Cl⁻, NH₄⁺, Na⁺, K⁺, Ca²⁺, Mg²⁺) by ion chromatography (Metrohm 930 Compact IC Flex). The other half was aciddigested (HNO₃/HClO₄, 4:1) for elemental analysis of Al, Si, Fe, Pb, Zn, Cu, Mn, Ni, and Cr by ICP-OES (Perkin Elmer Optima 8300). Organic carbon (OC) and elemental carbon (EC) were determined by thermal-optical reflectance on a 1.5 cm² punch (DRI Model 2015). PMF modelling used EPA PMF 5.0 with 20 base runs and convergence checked by bootstrapping (100 iterations) [8] .
Quality Control
Field blanks (one per ten samples) were collected at each site. Detection limits for ionic species ranged from 0.02 to 0.08 µg/m³. ICP-OES calibration used NIST-traceable multi-element standards, and spike recoveries fell between 92 and 107%. OC/EC analysis included sucrose solution checks at the start of each batch [9] . PM2.5 showed a pronounced seasonal cycle at all stations (Table 1). Winter concentrations at the roadside site averaged 194.7 µg/m³ nearly three times the monsoon low of 67.3 µg/m³. The roadside station consistently recorded the highest values, reflecting direct traffic exposure. Temperature showed an inverse association with PM2.5 (r = -0.67, p<0.01; Figure 1), consistent with reduced atmospheric mixing heights during cooler months. Wind speed and relative humidity were weaker predictors (r = -0.38 and r = 0.29, respectively). PMF resolved five factors (Figure 2). Vehicular emissions dominated (median 72.3 µg/m³ at the roadside site), marked by high EC and Zn loadings. Industrial plumes, rich in Fe, Mn, and Ni, ranked second. Biomass burning peaked in November and showed high OC/EC ratios alongside elevated K⁺ concentrations, matching the crop-residue burning season [10] .
| Season | Roadside | Residential | Semi-Urban | p-value |
|---|---|---|---|---|
| Winter | 194.7±34.2 | 148.3±28.6 | 121.5±24.1 | <0.001 |
| Summer | 118.4±21.7 | 89.2±18.3 | 74.8±15.9 | <0.01 |
| Monsoon | 67.3±14.8 | 52.1±12.4 | 43.7±10.6 | <0.01 |
| Post-monsoon | 138.6±27.3 | 107.9±23.1 | 89.4±19.8 | <0.001 |
| Annual Mean | 127.3±41.8 | 98.6±35.2 | 84.1±30.4 | <0.001 |
Table text extracted from the original PDF; superscript letters are shown inline. The original table image is below.
View original table image
Results
Discussion: The annual mean PM2.5 of 127.3 µg/m³ at the roadside site is roughly eight times the WHO guideline of 15 µg/m³ and more than three times the Indian NAAQS limit of 40 µg/m³. These levels place Varanasi among the most polluted cities in India, in line with satellite-derived estimates for the central Indo-Gangetic Plain [2] . The winter peak of 194.7 µg/m³ is not unusual for this region; Kanpur and Patna report similar or higher values during December-January, when shallow boundary layers trap emissions near ground level [4] . That vehicular emissions contribute over a third of PM2.5 mass is expected, given that Varanasi's vehicle fleet has grown about 9% annually in recent years, and much of it consists of two-stroke autorickshaws and aging diesel trucks [6] . The 17.9% biomass burning share, though lower than vehicle and industrial fractions on an annual basis, spikes to above 30% during October-November, when paddy-straw fires in neighbouring states add a regional burden [10] . Some caveats apply. The every-sixth-day sampling schedule captures seasonal patterns well but may miss episodic events lasting a day or two. And PMF results depend on the number and type of chemical species included; adding organic molecular markers could sharpen the separation between fresh and aged combustion aerosols. Still, the fivefactor solution showed stable bootstrap performance (>87% of runs mapping to the base case), lending confidence to the source profiles obtained [11] . Conclusion: PM2.5 in the Varanasi metropolitan area exceeded national and international guidelines at all three monitoring sites throughout the 14-month campaign. Vehicular emissions, industrial plumes, and seasonal biomass burning were the top three contributors identified by PMF. Winter concentrations were roughly three times higher than monsoon values, driven by meteorological trapping. Targeted interventions fleet electrification on congested corridors, cleaner industrial fuels, and enforcement of crop-residue burning bans would address the dominant sources identified here.
References
11 in the original paper- WHO. Ambient (outdoor) air pollution fact sheet. World Health Organization; 2022.
- Balakrishnan K, Dey S, Gupta T, Dhaliwal RS, Brauer M, Cohen AJ, et al. The impact of air pollution on deaths, disease burden, and life expectancy across the states of India. Lancet Planet Health. 2019;3(1):e26e39.
- Tiwari S, Bisht DS, Srivastava AK, Pipal AS, Taneja A, Srivastava MK, et al. Variability in atmospheric particulates and meteorological effects on their mass concentrations over Delhi, India. Atmos Res. 2014;145146:45-56.
- Pant P, Shukla A, Kohl SD, Chow JC, Watson JG, Harrison RM. Characterization of ambient PM2.5 at a pollution hotspot in New Delhi, India and inference of sources. Atmos Environ. 2015;109:178-189.
- Paatero P, Tapper U. Positive matrix factorization: a non-negative factor model with optimal utilization of error estimates. Environmetrics. 1994;5(2):111-126.
- Sharma SK, Mandal TK, Jain S, Saraswati, Sharma A, Saxena M. Source apportionment of PM2.5 in Delhi using PMF model. Bull Environ Contam Toxicol. 2016;97(1):36-42.
- USEPA. Quality assurance guidance document 2.12: monitoring PM2.5 in ambient air using designated reference or Class I equivalent methods. US EPA; 2016.
- Norris G, Duvall R, Brown S, Bai S. EPA positive matrix factorization (PMF) 5.0 fundamentals and user guide. EPA/600/R-14/108; 2014.
- Chow JC, Watson JG, Crow D, Lowenthal DH, Merrifield T. Comparison of IMPROVE and NIOSH carbon measurements. Aerosol Sci Technol. 2001;34(1):23-34.
- Jethva H, Chand D, Torres O, Gupta P, Lyapustin A, Patadia F. Agricultural burning and air quality over northern India. J Geophys Res Atmos. 2018;123(3):1631-1647.
- Brown SG, Eberly S, Paatero P, Norris GA. Methods for estimating uncertainty in PMF solutions. Atmos Meas Tech. 2015;8(10):4225-4236.