
Research article · 2026 · Full text
International Journal of Geography Geology and EnvironmentPolitical reservation and socio-economic development: A spatial analysis of scheduled tribe population of selected assembly constituencies in Rajasthan
Volume 8(4) · Pages 01–06 · DOI: 10.22271/27067483.2026.v8.i4a.499 ↗
Research areasSocial and Economic Development in IndiaSouth Asian Studies and ConflictsIndian Economic and Social Development
Abstract
Author-writtenThe constitution of India under article 332 has provided reservation for Scheduled Tribes in State Assembly. But even after 70 year of independence its impact on socio-economic development of ST population remain negligible. This study uses a comparative approach to examine the socio-economic consequences of political reservation in three ACs of Rajasthan. The three AC in Rajasthan: two ST-reserved constituencies (Rajgarh-Laxmangarh and Kushalgarh) and one unreserved constituency (Deoli-Uniara). In this study villages having populations above 25 percent ST are selected. To analyse the data, factor analysis using Principal Component Analysis (PCA) with Varimax rotation was applied to identify underlying development dimensions. The result finds three primary factors: socio-economic development and living standards, modernization and advanced asset ownership, and demographic structure with gender balance. Regional comparisons were also assessed through factor scores to determine disparity in development outcomes. Thus, study contributes in understanding the spatial distribution of development disparities. It also evaluates the effectiveness of reservation policies in promoting equitable development among ST populations.
Summary
Source-checkedPlain-language reading of the full paper, prepared with AI and checked against the text. Each point links to the authors' own words.
Why it matters
- Political reservation for Scheduled Tribes (STs) in India's State Legislative Assemblies was designed to correct historical socio-economic deprivation and political exclusion. View evidence ↗
- Despite seventy years of independence, the actual socio-economic progress in tribal regions following political reservation remains uneven and debated. View evidence ↗
- There is a lack of empirical research comparing reserved and unreserved constituencies to understand the spatial and socio-economic effects of reservation. View evidence ↗
The question
- The study aims to determine if political reservation has led to improved socio-economic conditions within tribal constituencies. View evidence ↗
- The research also investigates if development outcomes are driven more by geography and infrastructure than by reservation status. View evidence ↗
What they did
- The study compared three assembly constituencies (ACs) in Rajasthan: two ST-reserved (Rajgarh-Laxmangarh and Kushalgarh) and one unreserved (Deoli-Uniara). View evidence ↗
- To avoid dilution of results, the analysis only included villages where the Scheduled Tribe population exceeded 25%. View evidence ↗
- The researchers used Principal Component Analysis (PCA) with Varimax rotation to identify the primary dimensions of socio-economic development. View evidence ↗
- The primary data source for demographic and socio-economic indicators was the 2011 Census of India. View evidence ↗
What they found
- Factor analysis identified three primary dimensions of development that together explain 56.43% of the total variance in the data. View evidence ↗
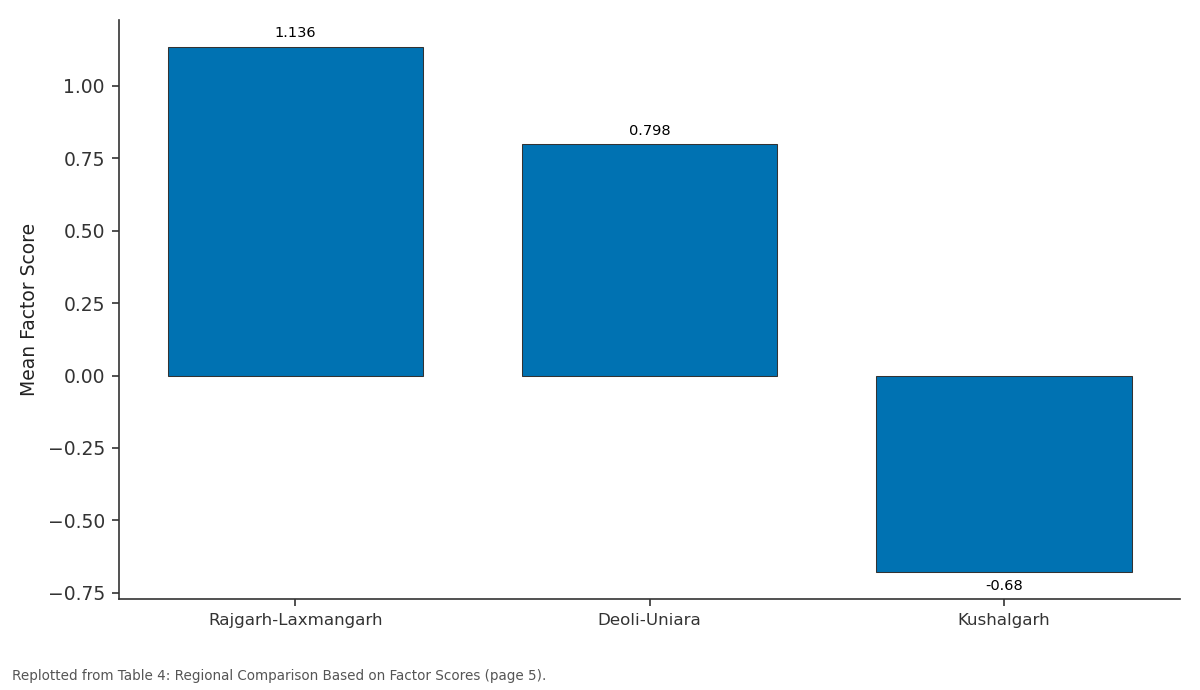
- Rajgarh-Laxmangarh showed the highest level of socio-economic development with a mean factor score of 1.136. View evidence ↗
- Modern infrastructure was concentrated in Rajgarh-Laxmangarh (score 0.753), while Deoli-Uniara (-0.166) and Kushalgarh (-0.153) both scored negatively. View evidence ↗
What it means
- The authors conclude that political reservation by itself does not ensure substantive socio-economic development. View evidence ↗
- The study concludes that development is primarily driven by geography, infrastructure, and administrative reach rather than the status of political reservation. View evidence ↗
Visual summary
2 visualsIllustrations explain the paper; charts are replotted from the paper's own table values.
Factor 1: Rajgarh-Laxmangarh vs Deoli-Uniara vs Kushalgarh
Replotted from Table 4 (page 5) of the original paper. Every bar is the paper's own table value.
View source evidence ↗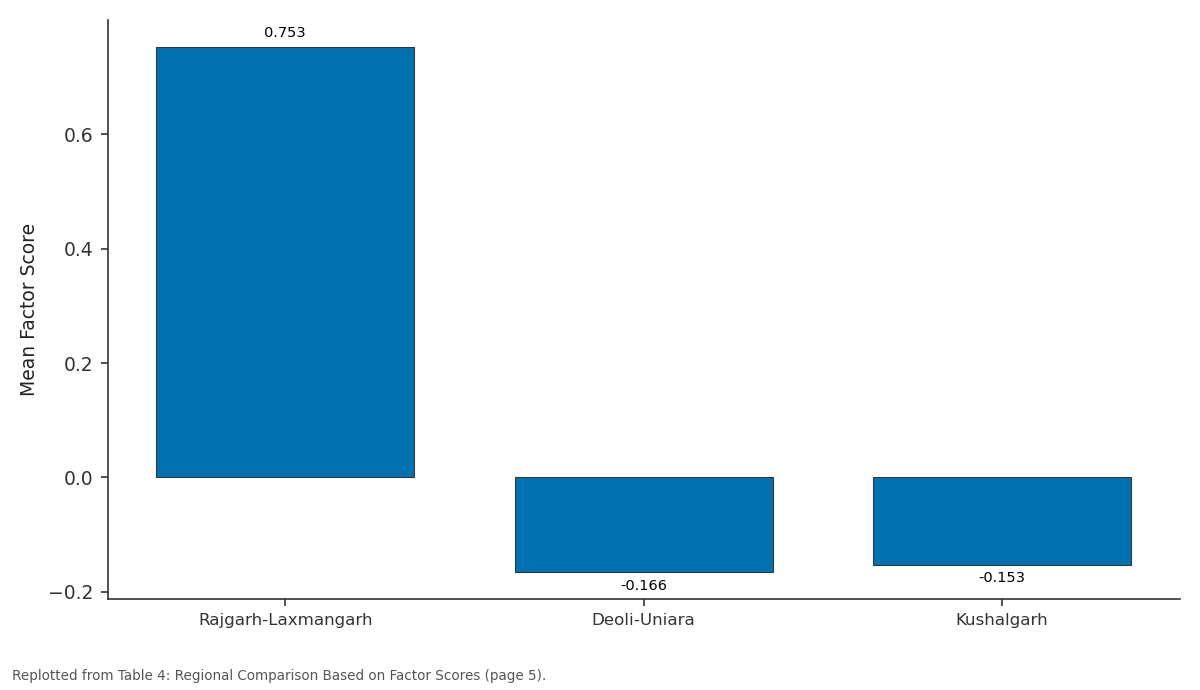
Factor 2: Rajgarh-Laxmangarh vs Deoli-Uniara vs Kushalgarh
Replotted from Table 4 (page 5) of the original paper. Every bar is the paper's own table value.
View source evidence ↗Figures & tables
From the original paper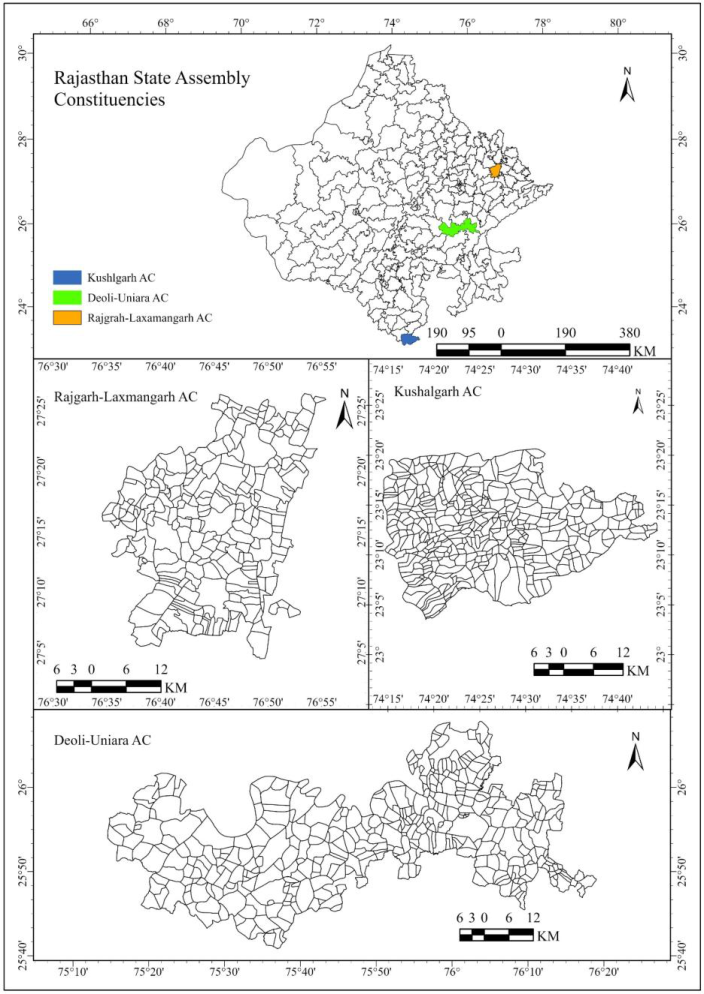 Figure 1
 Table 1
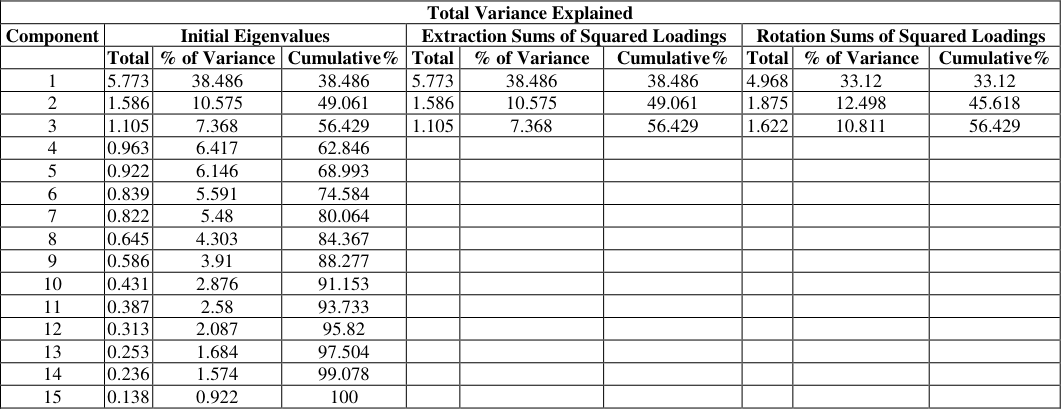 Table 2
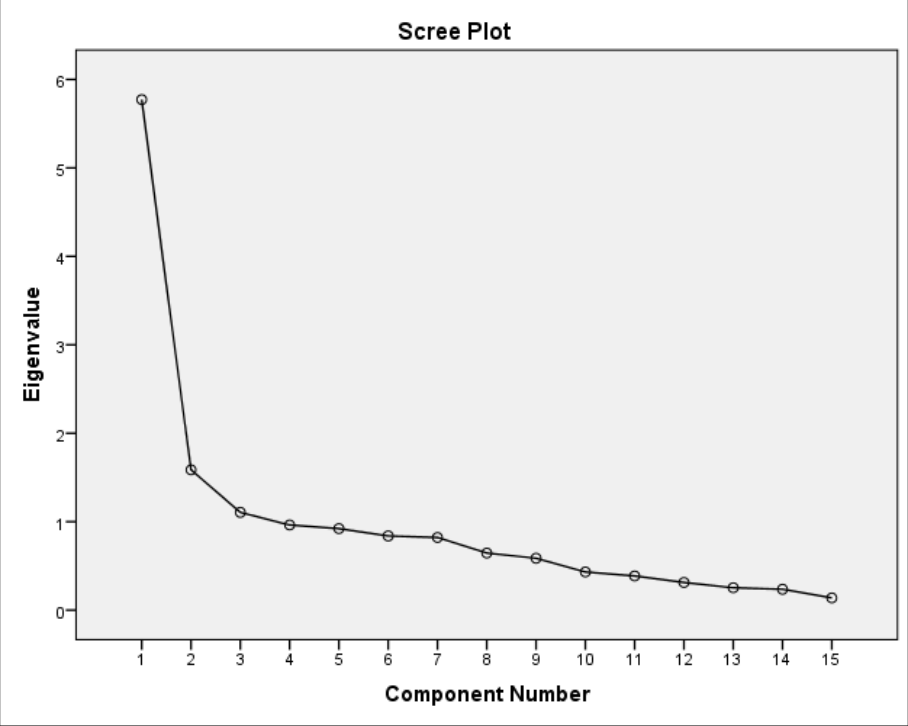 Figure 2
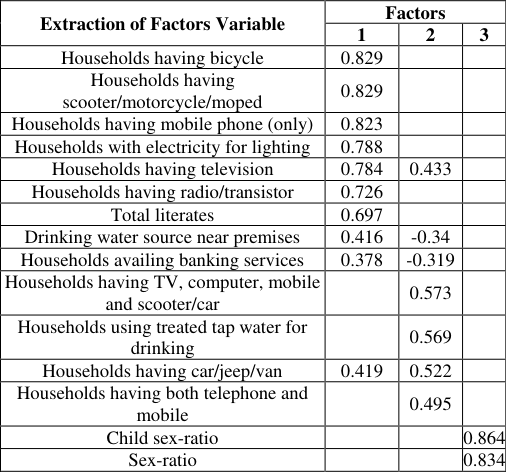 Table 3
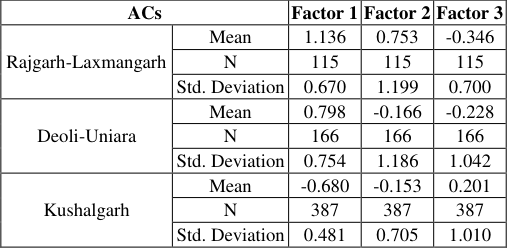 Table 4
Introduction
The political representation of historically marginalized communities has been a fundamental concern in India since Independence and to ensure their political representation the reservation of seats for Scheduled Tribes (STs) in State Legislative Assemblies under Article 332 of the Constitution was envisaged. This measure seen as a corrective mechanism to address historical political exclusion and socio-economic deprivation of marginalized communities (Duflo, 2005) [1] . The reservation was not only expected to ensuring presence of tribal representatives in states assembly but also facilitate inclusive governance and region-specific developmental needs. But, after seven decades of Independence political reservation and socio-economic advancement in tribal regions remains contested and uneven. In this context, electoral delimitation process plays key role in shaping political representation as delimitation determines not only the size and boundaries of constituencies but also their social composition, settlement structure, and administrative reach (Morrill, 2018; Prescott, 2017) [8] . In tribal area this process often brings together heterogeneous spaces along with homogenous cluster. These cluster varying in term of connectivity, infrastructure, and access to public services. The outcome of development of reserved ACs should understood not only by peoples electoral participation rather it should look at deep socio-economic and demographic factors as well ACs geographical settings. In India most of research focus on leadership and electoral participation but not at the underlaying geography and socio-economic structure of the region. Although these research provided valuable insights into political inclusion of marginalised people. However, limited attention has been paid to the spatial and socio-economic consequences of reservation at the constituency level. There is a paucity of empirical work that to compares reserved and unreserved constituencies. This gap is evident in Rajasthan, where regional disparities are more pronounced. The state has one of the largest concentrations of tribal population in western India.
In Rajasthan, tribal regions range from relatively accessible and semi-urbanised areas in the north-east to remote, forested and predominantly rural tracts in the south. In this context, this study examines whether political reservation have translated into improved socio-economic conditions in tribal constituencies. It also analyse that whether development outcomes continue to be shaped primarily by geography and infrastructural integration by comparing reserved and unreserved constituency. Three Assembly Constituencies (ACs) are selected with contrasting social composition and locational characteristics. This study adopts a comparative geographical approach to assess patterns of inequality rather than relying on single indicators. To capture the complex and interrelated dimensions of development, study uses factor analysis as the principal analytical tool.
Study Area
The present study have been selected three ACs: Rajgarh-Laxmangarh (ST reserved), Deoli-Uniara (unreserved), and Kushalgarh (ST reserved). These AC are chosen to represent contrasting geographical settings and social compositions. Rajgarh-Laxmangarh is located in north-eastern Rajasthan and represents a mixed social constituency with moderate tribal concentration and relatively better connectivity while Deoli-Uniara, situated in the central part, is unreserved characterised by a heterogeneous population structure.
Source: Survey of India, Census of India, 2011 Despite having comparable population sizes, these ACs differ sharply in terms of literacy levels, gender composition, infrastructure availability, and access to public services.
Data Sources and Methodology
This study adopted a quantitative cum comparative methods based on secondary data to analyse the overall socioeconomic and demographic similarities and disparity across three ACs.
Data Sources
Demographic and socio-economic indicators are derived from the Census of India 2011, it provides the most comprehensive and standardised dataset at the constituency and village levels. In addition, constituency-level data on education, health facilities, drinking water, sanitation, electricity, household assets, transport, and market access were obtained from IndiaStat publications and related government statistical compendia. Other data regarding reservation status and constituency boundaries were drawn from the Delimitation of Parliamentary and Assembly Constituencies Order, 2008. The Census 2011 is the principal demographic source is the most recent decennial dataset that aligns with the current delimitation framework. To understand socio-economic development level, a set of variable are selected from demographic, social, and infrastructural aspect. It includes variable such as total literacy rate, male and female literacy, sex-ratio, child sexratio, access to educational institutions, health infrastructure, drinking water sources, sanitation facilities, electricity for domestic and productive use, ownership of household assets, banking access, and transport connectivity etc. The village constitutes the primary unit of analysis. Villages are filtered using the following criterion:
Only villages satisfying ST population above 25 percent are retained for analysis. This threshold ensures that tribaldominated contexts and avoids dilution of results due to socially heterogeneous settlements.
Data Analysis
A comparative geographical approach is used to examine similarities and differences among two ST reserved ACs and one unreserved AC. This assessment allows that whether political reservation leads to improved development outcomes, or observed variations are better explained by geographical and infrastructural factors.
To eliminate effect of differing units of measurement and scale all variables are standardised as:
where: 𝑋 𝑖𝑗 = value of variable 𝑗for village 𝑖𝑋 ˉ𝑗 = mean of variable 𝑗 𝜎 𝑗 = standard deviation of variable 𝑗 It ensures that each variable contributes equally to the analysis and prevents variables with larger numerical ranges from influencing the results.
After standardisation of all variable, factor analysis is used in IBM SPSS software to identify the underlying dimensions that structure socio-economic and demographic variation across three ACs. Principal Component Analysis (PCA) is used for factor extraction, then Varimax rotation to improve interpretability of the outcomes. The reason of using factor analysis is due to the fact that factor analysis reduces a large set of correlated variables into a smaller number of independent factors. The each factor represents a distinct dimension of development. However, before factor extraction, the suitability of data is checked for factor analysis using the Kaiser-Meyer-Olkin (KMO) measure of sampling adequacy and Bartlett's Test of Sphericity.
The KMO value obtained is well above the acceptable threshold, indicating strong inter-correlations among variables and confirming that the dataset is appropriate (Table 1). 0.000 Source: Calculated by Author While Bartlett's Test is statistically significant. Thus, rejects the null hypothesis that the correlation matrix is an identity matrix. The number of factors is determined by Kaiser's criterion. This criteria considers only those components having eigenvalues above one as significant.
| Kaiser-Meyer-Olkin Measure of Sampling Adequacy. | — | .889 |
|---|---|---|
| Bartlett's Test of Sphericity | Approx. Chi-Square | 4560.113 |
| df | 105 | |
| Sig. | 0.000 |
Table text extracted from the original PDF; superscript letters are shown inline. The original table image is below.
View original table image
Results
Results
Factors Extraction and Variance
As presented in table 2, three components satisfied above mentioned criterion of eigenvalues of above one. The first component recorded an eigenvalue of 5.773 and explained 38.49 percent of the total variance, indicating that it represents the most dominant dimension of variation among the selected variables. The second component had an eigenvalue of 1.586, accounting for 10.58 percent of the variance, while the third component, with an eigenvalue of 1.105, contributed 7.37 percent of the variance. Based on the calculation and scree plot, three factors account around 56.43% of the total variance in the data. In socioeconomic and geographical research multiple complex indicators are analysed, so a cumulative variance above 50% is considered satisfactory. As above 50% variance indicate a substantial condensation of information into a smaller number of meaningful factors. In the calculation Varimax rotation is applied to ensure statistical interpretability of the result. After Varimax rotation the variance are more evenly distributed in three factors. The rotated solution shows first factor accounts for 33.12%, the second for 12.50%, and the third 10.81% of the total variance. Although cumulative explanatory power remains unchanged at 56.43%. This balanced distribution shows that each extracted factor significantly represents the underlying structure of socio-economic and demographic conditions across the study area.
| Total Variance Explained | — | — | — | — | — | — | — | — | — |
|---|---|---|---|---|---|---|---|---|---|
| Component | Initial Eigenvalues | Extraction Sums of Squared Loadings | Rotation Sums of Squared Loadings | ||||||
| Total | % of Variance | Cumulative% | Total | % of Variance | Cumulative% | Total | % of Variance | Cumulative% | |
| 1 | 5.773 | 38.486 | 38.486 | 5.773 | 38.486 | 38.486 | 4.968 | 33.12 | 33.12 |
| 2 | 1.586 | 10.575 | 49.061 | 1.586 | 10.575 | 49.061 | 1.875 | 12.498 | 45.618 |
| 3 | 1.105 | 7.368 | 56.429 | 1.105 | 7.368 | 56.429 | 1.622 | 10.811 | 56.429 |
| 4 | 0.963 | 6.417 | 62.846 | ||||||
| 5 | 0.922 | 6.146 | 68.993 | ||||||
| 6 | 0.839 | 5.591 | 74.584 | ||||||
| 7 | 0.822 | 5.48 | 80.064 | ||||||
| 8 | 0.645 | 4.303 | 84.367 | ||||||
| 9 | 0.586 | 3.91 | 88.277 | ||||||
| 10 | 0.431 | 2.876 | 91.153 | ||||||
| 11 | 0.387 | 2.58 | 93.733 | ||||||
| 12 | 0.313 | 2.087 | 95.82 | ||||||
| 13 | 0.253 | 1.684 | 97.504 | ||||||
| 14 | 0.236 | 1.574 | 99.078 | ||||||
| 15 | 0.138 | 0.922 | 100 |
Table text extracted from the original PDF; superscript letters are shown inline. The original table image is below.
View original table image
Rotated Component Matrix
The Varimax rotated component matrix presents the factor loadings of each standardized variable on the three extracted components. Loadings of 0.30 and above were considered significant for interpretation, as they indicate a strong association between a variable and a given factor. Based on this criterion, three distinct and conceptually meaningful factors emerged.
Factor 1: Socio-Economic Development and Living Standard
Factor 1 consists of a multitude of variables with high positive loadings. These include the ownership of bicycles (0.829), scooters or motorcycles (0.829), mobile phones (0.823), availability of electricity for lighting (0.788), availability of television (0.784), ownership of radio or transistors (0.726), and total literacy rate (0.697). Overall these variables are indicative of educational attainment, access to basic infrastructure, communications, transport assets, and financial inclusion. This clustering of variables indicates that Factor 1 is representative of the overall socio-economic condition and quality of life for households. Regions that score high on Factor 1 demonstrate a higher standard of living, higher level of material wellbeing, and increased access to basic services. Therefore, Factor 1 is labelled as Socio-economic Development and Living Standard Factor.
Factor 2: Modernization and Advanced Asset Ownership
The second factor is primarily characterized by a large loadings of the composite modern asset ownership in the form of modern technology, such as televisions, computers, mobile phones, and scooters or vehicles (0.573); the use of treated tap water as the primary drinking water source (0.569); ownership of either a car or a jeep (0.522); and the presence of a television (0.433). The second factor reflects a higher order of development and is indicative of modernisation, improved economic capacity, and improved infrastructure to support use of public utilities. Treated water supply and higher-order consumer assets indicate that development has progressed beyond subsistence-level amenities. So the second factor is referred to as the Modern Infrastructure and Economic Advancement Factor.
Factor 3: Demographic Structure and Gender Balance
The third factor exhibits substantial positive loadings on both the child sex-ratio (0.864) and the overall sex-ratio (0.834). These variables serve as direct indicators of the demographic composition and gender balance within the population. This factor encapsulates social conditions pertaining to population structure, cultural practices, and the demographic health of the region. Therefore, it is designated as the "Demographic Structure and Gender Balance Factor." Three separate variables have been identified through the process of factor analysis based on the demographic and socioeconomic characteristics of the study areas. These include socio-economic development and standard of living (education; access to infrastructure; household assets; financial inclusion); the presence of modern infrastructure and economic development (higher quality of facilities and modernization); and demographic structure/gender balance (population and gender equity). Together, these three variables constitute a powerful method for analysing the socioeconomic patterns within the assembled dataset and provide a rich and thorough basis for examining the degree of regional differences between assembly constituencies.
Regional Comparison Based on Factor Scores
The spatial disparities among three ACs is measured using mean factor scores. The mean factor score is calculated for each extracted factor by regression method. The factor scores are standardized with a mean of zero and a standard deviation of one. The positive values show above-average performance, while negative values indicate below-average level. The mean factor score for Rajgarh-Laxmangarh is 1.136, which is higher than the overall mean thus it demonstrates the highest level of socio-economic development across three ACs. This is evident as high level of literacy rates, access to electricity, ownership of household assets, and access to basic services. Deoli-Uniara AC demonstrate a moderately positive score of 0.798. It indicate a relatively developed socioeconomic condition, lower than Rajgarh-Laxmangarh AC. In Kushalgarh compare to other two AC presents a negative score of-0.680, indicate lower living standards, limited asset ownership, and weaker access to infrastructure and services. Thus, the spatial pattern reveals higher level of socioeconomic development in Rajgarh-Laxmangarh, followed by Deoli-Uniara, while Kushalgarh remains relatively underdeveloped.
Factor 2: Modern Infrastructure and Economic Advancement
The second factor, Rajgarh-Laxmangarh shows high positive mean score of 0.753, it highlights higher infrastructural facilities, treated water supply, and other household assets. In contrast, both Deoli-Uniara (-0.166) and Kushalgarh (-0.153) present slightly negative scores, indicating relatively lower levels of modernization and infrastructural development within these constituencies. This underscores a pronounced regional disparity, with modern infrastructure being predominantly concentrated in Rajgarh-Laxmangarh.
Factor 3: Demographic Structure and Gender Balance
The third factor exhibits a divergent spatial pattern. Kushalgarh registers a positive score of 0.201, signifying a relatively superior demographic balance and more favorable sex-ratio conditions. In contrast, Rajgarh-Laxmangarh (-0.346) and Deoli-Uniara (-0.228) display negative values, indicating comparatively lower gender balance in these regions. This suggests that although Kushalgarh lags in socioeconomic and infrastructural development, it demonstrates relatively better performance in demographic and social structure. The factor score analysis indicates significant spatial disparities among the three assembly constituencies. Rajgarh-Laxmangarh is identified as the most developed area in terms of socio-economic conditions and infrastructural advancement. Deoli-Uniara holds an intermediate status with moderate levels of development. Conversely, Kushalgarh remains relatively underdeveloped in economic and infrastructural aspects, although it exhibits a comparatively better demographic balance. The findings suggest a polarized pattern of regional development, characterized by the concentration of economic growth and modernization in specific constituencies, while others continue to encounter developmental challenges. The identified factors thus offer a comprehensive framework for understanding the multidimensional nature of regional disparities within the study area.
Conclusion
The overall assessment of the political evolution and socioeconomic-demographic conditions of Rajgarh-Laxmangarh, Deoli-Uniara, and Kushalgarh AC's with specific focus on the implications of reservation and delimitation for Scheduled Tribe populations. The analysis clearly demonstrates that while reservation has ensured numerical political representation, it has not produced uniform or automatic socio-economic advancement. Analysis shows a spatial gradient emerge across the three constituencies, shaped primarily by geography, settlement pattern, administrative reach, and infrastructural connectivity rather than by reservation status alone. As Kushalgarh, despite being the most demographically homogeneous and overwhelmingly ST-dominated constituency, continues to experience acute deficits in literacy, electricity use, asset ownership, mobility, and access to treated water. At the same time, it displays the most favourable sex-ratio and child sex-ratio, reflecting the resilience of tribal social structures and relatively weaker patriarchal pressures. Rajgarh-Laxmangarh and Deoli-Uniara(Unreserved), though socially more heterogeneous, show comparatively better educational outcomes, infrastructure access, and economic integration due to proximity to urban centres and transport corridors, albeit with sharper gender disparities. Overall, the findings underscore a central conclusion that, political reservation alone does not guarantee substantive development outcomes. Socio-economic progress in tribal areas is mediated by spatial context and institutional accessibility. The three constituencies thus represent different positions along a continuum of tribal integration and development, offering critical insight into the limits and possibilities of reservation as a tool for social transformation.
Figures and tables from the paper
| Extraction of Factors Variable | Factors | — | — |
|---|---|---|---|
| 1 | 2 | 3 | |
| Households having bicycle | 0.829 | ||
| Households having scooter/motorcycle/moped | 0.829 | ||
| Households having mobile phone (only) | 0.823 | ||
| Households with electricity for lighting | 0.788 | ||
| Households having television | 0.784 | 0.433 | |
| Households having radio/transistor | 0.726 | ||
| Total literates | 0.697 | ||
| Drinking water source near premises | 0.416 | -0.34 | |
| Households availing banking services | 0.378 | -0.319 | |
| Households having TV, computer, mobile and scooter/car | 0.573 | ||
| Households using treated tap water for drinking | 0.569 | ||
| Households having car/jeep/van | 0.419 | 0.522 | |
| Households having both telephone and mobile | 0.495 | ||
| Child sex-ratio | 0.864 | ||
| Sex-ratio | 0.834 |
Table text extracted from the original PDF; superscript letters are shown inline. The original table image is below.
View original table image
| ACs | — | Factor 1 | Factor 2 | Factor 3 |
|---|---|---|---|---|
| Rajgarh-Laxmangarh | Mean | 1.136 | 0.753 | -0.346 |
| N | 115 | 115 | 115 | |
| Std. Deviation | 0.670 | 1.199 | 0.700 | |
| Deoli-Uniara | Mean | 0.798 | -0.166 | -0.228 |
| N | 166 | 166 | 166 | |
| Std. Deviation | 0.754 | 1.186 | 1.042 | |
| Kushalgarh | Mean | -0.680 | -0.153 | 0.201 |
| N | 387 | 387 | 387 | |
| Std. Deviation | 0.481 | 0.705 | 1.010 |
Table text extracted from the original PDF; superscript letters are shown inline. The original table image is below.
View original table image
References
8 in the original paper- Duflo E. Why political reservations? Journal of the European Economic Association. 2005;3(2-3):668-678. doi:10.1162/jeea.2005.3.2-3.668.
- Election Commission of India. Legislative Assembly elections 2018. New Delhi: Election Commission of India; 2018.
- Government of India. Delimitation of Parliamentary and Assembly Constituencies Order, 2008. New Delhi: Government of India Press; 2008.
- Government of India. Census of India 2011: Primary Census Abstract (Rajasthan, District Tables). New Delhi: Office of the Registrar General and Census Commissioner; 2011.
- Government of India. Statistical profile of Scheduled Tribes in India 2021. New Delhi: Ministry of Tribal Affairs; 2021.
- IndiaStat Publications. Rajasthan Assembly Factbook: Rajgarh-Laxmangarh, Deoli-Uniara, and Kushalgarh Assembly Constituencies. IndiaStat Public Data Series; 2023.
- Jalan S. Electoral delimitation and geography of representation in reserved constituencies of Rajasthan. The Indian Geographical Journal. 2019;94(1):35-50.
- Morrill R. Electoral geography and gerrymandering: space and politics. In: Routledge; 2018. p. 117-138. doi:10.4324/9780429494741-6.