
Research article · 2026 · Full text
International Journal of Biology SciencesEffect of different nitrogen levels on growth and forage productivity of elephant grass in southern Ethiopia
Volume 8(4) · Pages 26–33 · DOI: 10.33545/26649926.2026.v8.i4a.616 ↗
Research areasAgricultural Productivity and Crop ImprovementAgricultural Science and FertilizationPasture and Agricultural Systems
Abstract
Author-writtenAn experiment was conducted at Agricultural Research Station, Bule Hora University Ethiopia to assess the growth and forage productivity of elephant grass through different nitrogen levels in 2021-2022. The experiment was conducted with six treatments in a randomized block design (RBD) with 3 replications. Treatments were six different levels of nitrogen fertilizer i.e., T0 (0.0 kg N/ha), T1 (25 kg N/ha), T2 (50 kg N/ha), T3 (75 kg N/ha), T4 (100 kg N/ha) and T5 (125 kg N/ha). The data was collected from experiment plots such as; morphometric characteristics of grass and yield attributes of grass analysed. The results of experiment revealed that plant height (cm), number of leaves per plant, number of leaves per tiller, leaves length per plant (cm), leaves blade width (cm), stem production/tiller (kg), leaf production/tiller (kg), fresh fodder production/tiller (kg), green fodder/plot (kg/6 m2), green fodder yield (t/ha), and dry fodder yield (t/ha) significantly (p
Summary
Source-checkedPlain-language reading of the full paper, prepared with AI and checked against the text. Each point links to the authors' own words.
Why it matters
- Livestock production is a critical economic driver in Ethiopia, contributing between 12% and 16% of the national GDP. View evidence ↗
- Livestock productivity in Ethiopia is hindered by a shortage of high-quality feed, with an estimated annual deficit of 27 million metric tons. View evidence ↗
- Elephant grass is a fast-growing, multipurpose perennial forage crop native to Sub-Saharan Africa, commonly used for cattle in cut-and-carry systems. View evidence ↗
The question
- The study aimed to evaluate how different doses of nitrogen fertilizer affect the growth and yield components of elephant grass in southern Ethiopia. View evidence ↗
What they did
- The experiment took place at Bule Hora University, Ethiopia, during 2021-2022, using a randomized block design with three replications. View evidence ↗
- Six nitrogen fertilizer levels were tested: 0.0, 25, 50, 75, 100, and 125 kg N/ha. View evidence ↗
- Growth parameters were evaluated using five randomly selected tillers per plot, and data were analyzed using ANOVA via SPSS. View evidence ↗
What they found
- The highest plant height was significantly recorded at 125 kg N/ha (166.78 cm), compared to the lowest height in the control group (89.44 cm). View evidence ↗
- Contrary to other growth metrics, the basal circumference of the stem was significantly higher in the control group (2.67 cm) than in the high-nitrogen treatments. View evidence ↗
- The 125 kg N/ha treatment produced the highest green fodder yield (32.59 t/ha) and dry biomass yield (6.85 t/ha), significantly outperforming the control (1.96 t/ha dry biomass). View evidence ↗
What it means
- The authors recommend a nitrogen application rate of 125 kg N/ha to optimize forage productivity and dry matter yield for farmers. View evidence ↗
Visual summary
3 visualsIllustrations explain the paper; charts are replotted from the paper's own table values.
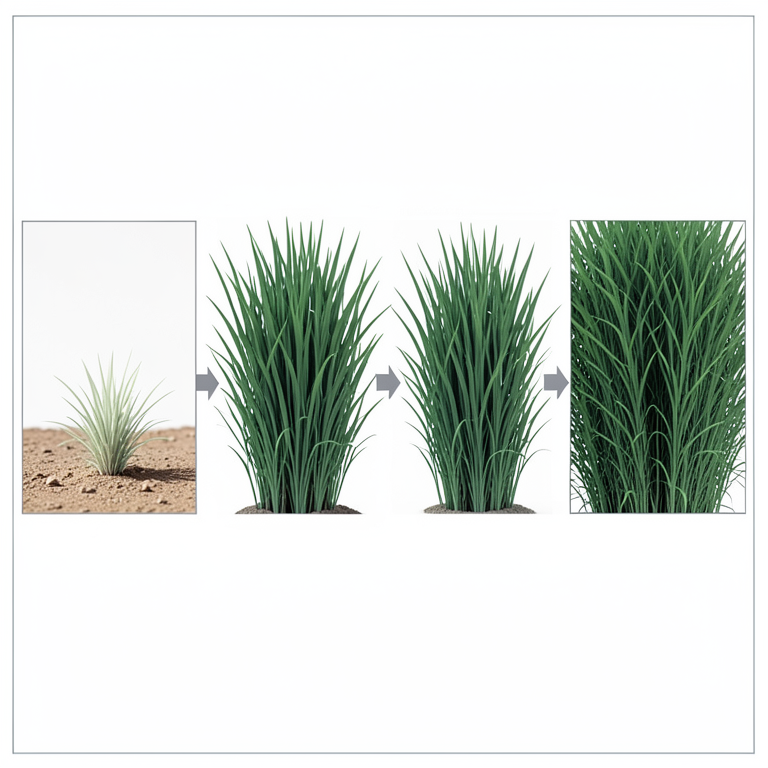
Nitrogen Dose vs. Forage Yield
AI-generated conceptual illustration (elephant grass (Pennisetum purpureum)). It explains the idea and does not show study data.
View source evidence ↗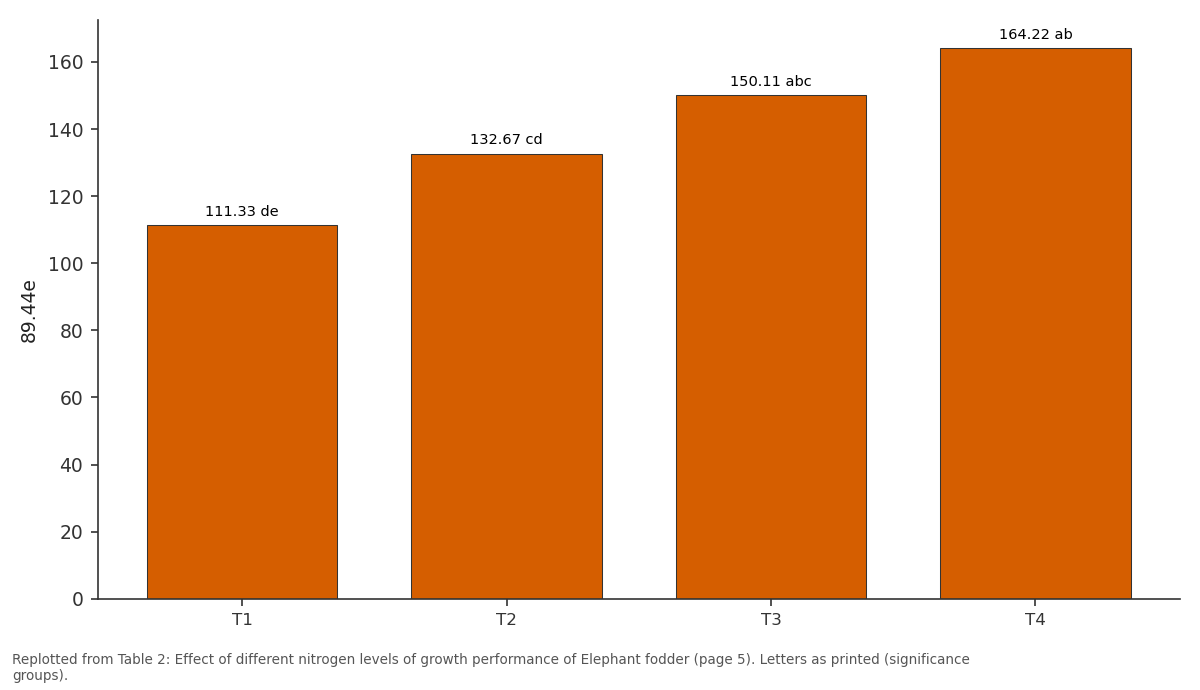
89.44e: T1 vs T2 vs T3 vs T4
Replotted from Table 2 (page 5) of the original paper. Every bar is the paper's own table value.
View source evidence ↗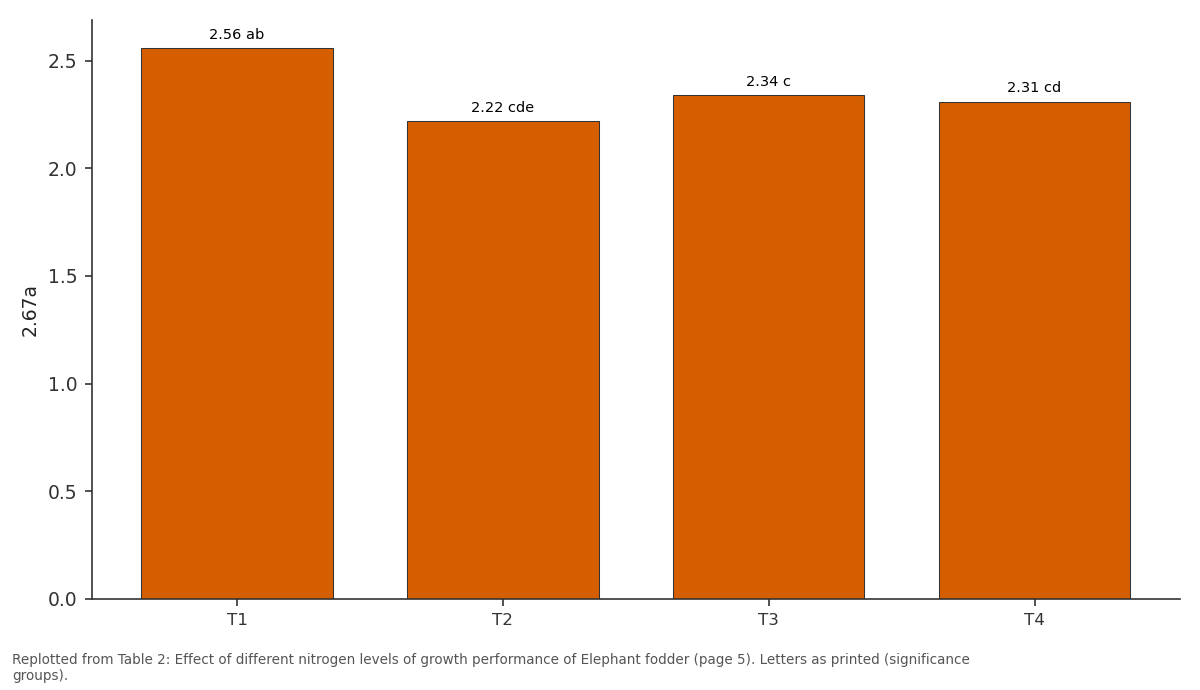
2.67a: T1 vs T2 vs T3 vs T4
Replotted from Table 2 (page 5) of the original paper. Every bar is the paper's own table value.
View source evidence ↗Figures & tables
From the original paper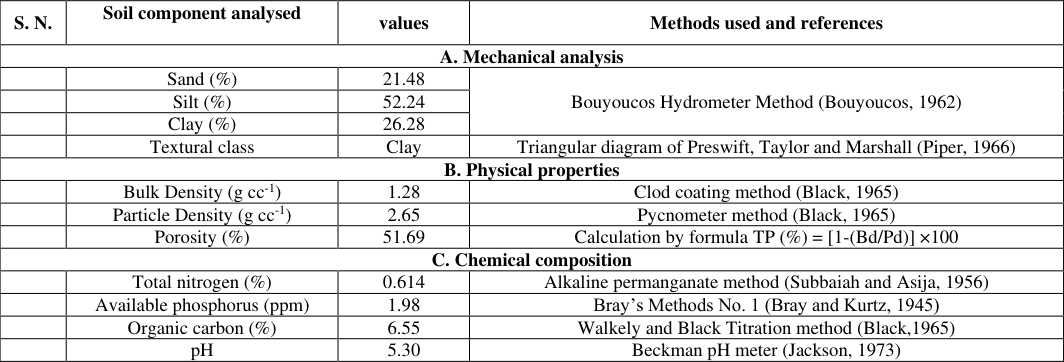 Table 1
 Table 2
 Table 3
 Table 4
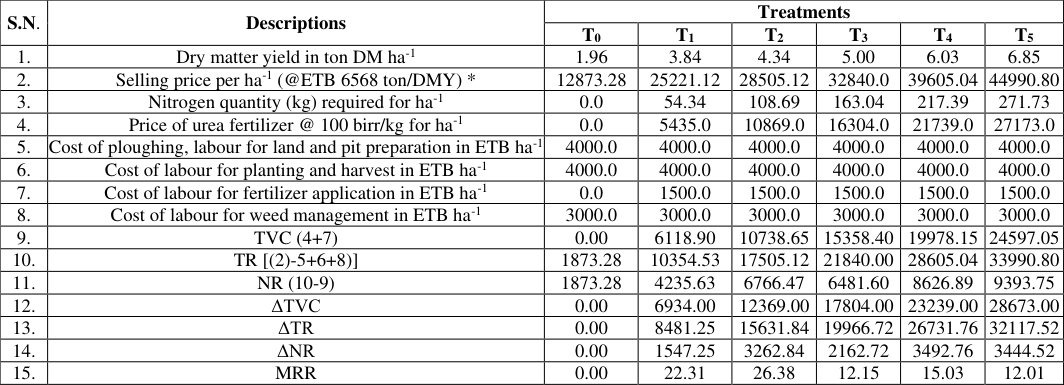 Table 4
Introduction
Ethiopia is endowed with huge potential livestock resources and holds the largest livestock population in Africa, estimated at about 60 million cattle, 60 million sheep and goats, 52 million chickens, 4.5 million camels, 10 million bee colonies and 7.2 million equines (CSA, 2018) [14] . In rural Ethiopia, livestock is a valuable asset that serves a variety of economic, social, and risk management activities. Livestock production currently contributes 12 to 16 percent of Ethiopia's GDP and 16 percent of its foreign revenues. Livestock farming is a major source of revenue and a means of life for Ethiopian farmers (Bewket et al, 2015) [7] , accounting for more than 85 percent of agricultural cash income (Yeshitila et al, 2008) [54] . However, despite the large livestock resource base and the importance of livestock to the livelihoods of millions of people, the productivity and economic contribution of the livestock sector are below potential due to technical and nontechnical constraints (Tolera, 2012) [50] . One of the major technical constraints limiting the productivity of livestock is the shortage and poor quality of feeds. According to a study conducted by the FAO in 2018, Ethiopia has a deficit of 27 million MT of feed each year and needs to fill this gap in order to ensure feed security (FAO, 2018) [18] . Inadequate supply of feed for the existing livestock population and poor quality of the available feed resources are the two main factors that contribute to the low production and productivity of livestock in Ethiopia (Asresie et al, 2015) [5] . Ethiopia has a net annual fodder biomass production of 144.5 million tons, with ME and CP values of 890 x 109 MJ and 7.49 million tons, respectively (Aranguiz and Creemers, 2019) [4] . Except in the Harari region, where improved forages account for 1.68 percent of the diet, hay and crop residues together with natural grass account for more than 90 percent of all animal diets (Aranguiz and Creemers, 2019) [4] . Even though the feed is available to a certain extent, in the majority of cases, it is not in a position to satisfy the quality for higher productivity of our livestock sector in Ethiopia. Available concentrate feeds and agro-industrial by-products are still at a very low level of supply to feed the present livestock population. One of the recommended profitable options to address this challenge of feed shortage is improved forage production using strategies suitable for a given farming system (Adugna, 2012) [2] . The utilization of locally accessible forage plants as feed resources is highly suggested to address existing livestock nutritional limits because they are familiar to smallholder farmers, grow with minimal input and adapt to local environments (Bimrew et al, 2017) [8] . In Ethiopia, certain information on Elephant Grass (Pennisetum purpureum) grass is generated in the form of publications and working papers (Ebrahim et al, 2020 a ; Gelayenew et al, 2020 and Gadisa et al, 2021) [16,17,21,22] . Elephant grass (Pennisetum purpureum) is a fast-growing perennial grass native to Sub-Saharan Africa that is widely grown across the tropical and subtropical regions of the world (Negawo et al, 2017) [38] . It is a multipurpose forage crop, primarily used to feed cattle in cut and carry feeding systems (Negawo et al, 2017) [38] . Elephant grass is a source of feed for most ruminants and is found to be one of the most preferred types of grass favoured by livestock. However, its production varies in the rainy season and dry season. Elephant Grass, also known as Napier grass or Uganda grass, is one of the most important tropical forage crops. It is widely used in cut and carry systems and is of growing importance in other agricultural systems. For most forage, fertilizer levels, harvesting times, and intervals can have a significant effect on both yield and nutritional qualities (Okwori and Magani, 2010) [39] . However, farmers do not have sufficient information on optimal management practices for elephant grass (Mutegi et al, 2008) [36] . Nitrogen (N) fertilizer is frequently deficient in soils (Havlin et al, 1999) and plants grown on nitrogendeficient soils show stunted growth, yellowish colour and reduced yield (Pandey and Sinha, 2006). Nitrogen fertilizer develops stronger cells for photosynthesis (Bob, 2011) and increasing of forage grass's dry matter yield and quality in terms of crude protein content, voluntary feed intake and digestibility (Aderinola, 2007) [1] . These qualities of forage are a function of many factors including the species, height of harvest, plant parts, agroecology, agronomy and postharvest processing practices (Ball et al, 2001) [6] . Keeping in view the importance of nitrogen, different experiments have been conducted to boast the elephant grass in countries, but less attention has been paid to the rainfed condition of Ethiopia. The present research was designed, to assess the effects of different doses of nitrogen on growth, yield and other yield components of elephant grass to standardize balanced nutrition at Bule Hora University, Ethiopia.
Materials and Methods
Materials and Methods
Descriptions of the experimental site
The experiment was conducted at an Agricultural Research Station, Bule Hora University Ethiopia. The experimental field was located at 5°62ˈN latitude and 38°21ˈE longitude and an altitude of 1716 meters above sea level. The site was selected based on the suitability of soil for growing elephant fodder under rainfed conditions. The topography of the experimental plot was sloppy. The area has a bimodal rainfall pattern with a long rainy season (June to September) and a short rainy season (February to May). The average maximum and minimum temperatures of the area are 23.6 °C and 6.3 °C, respectively. The average monthly maximum and minimum air temperature, relative humidity and annual rainfall distribution of the experimental periods more or less showed similar trends with the long-term average at both experimental sites. Before planting, representative soil samples were taken from the experimental fields using a soil sampling augur at a depth of 0 to 22.5 cm layer. The composite samples were analysed for their physio-chemical analysis and presented in Table 1. The soil analysis (Table 1) indicated that the experimental plot was clay in texture, available nitrogen (0.614%) and phosphorus (1.98 ppm), very high in organic carbon (6.55%) and slightly acidic in reaction (pH 5.30).
| S. N. | Soil component analysed | values | Methods used and references |
|---|---|---|---|
| A. Mechanical analysis | |||
| Sand (%) | 21.48 | Bouyoucos Hydrometer Method (Bouyoucos, 1962) | |
| Silt (%) | 52.24 | ||
| Clay (%) | 26.28 | ||
| Textural class | Clay | Triangular diagram of Preswift, Taylor and Marshall (Piper, 1966) | |
| B. Physical properties | |||
| Bulk Density (g cc-1) | 1.28 | Clod coating method (Black, 1965) | |
| Particle Density (g cc-1) | 2.65 | Pycnometer method (Black, 1965) | |
| Porosity (%) | 51.69 | Calculation by formula TP (%) = [1-(Bd/Pd)] ×100 | |
| C. Chemical composition | |||
| Total nitrogen (%) | 0.614 | Alkaline permanganate method (Subbaiah and Asija, 1956) | |
| Available phosphorus (ppm) | 1.98 | Bray’s Methods No. 1 (Bray and Kurtz, 1945) | |
| Organic carbon (%) | 6.55 | Walkely and Black Titration method (Black,1965) | |
| pH | 5.30 | Beckman pH meter (Jackson, 1973) |
Table text extracted from the original PDF; superscript letters are shown inline. The original table image is below.
View original table image
Field preparation and management
After the selection of the experimental site, the experimental land was cleaned manually with the help of labour. Consequently, the experimental field was ploughed and harrowed using a tractor-mounted moldboard plough and disc harrow. The elephant grass root splits obtained from a local farmer were planted at the beginning of the main rainy season on a plot size of 5 m x 3 m (15 m 2 ) with a spacing of 1 and 0.5 m between rows and plants, respectively. Diammonium phosphate (DAP) fertilizer at the rate of 50 kg/ha (18 kg N and 46 kg P 2 O 5 ) was uniformly applied for all treatments at the planting of elephant grass for better root development and in addition, nitrogen was applied in the form of urea. Hand weeding was done during establishment and after every harvest of elephant grass to facilitate regrowth.
Experimental design and treatments
The experiment was conducted with six treatments in a randomized block design (RBD) with 3 replications. Treatments were six different levels of nitrogen fertilizer namely, T 0 (0.0 kg N/ha), T 1 (25 kg N/ha), T 2 (50 kg N/ha), T 3 (75 kg N/ha), T 4 (100 kg N/ha) and T 5 (125 kg N/ha).
Data collection Morphometric characteristics of grass
The sample of five tillers of plants were randomly selected and tagged from the inner rows of each plot and used for the evaluation of 13 growth parameters (Halim et al, 2013) [27] . Plant height was determined by measuring beginning from its base to the longest leaf with a steel tape (Marafon, 2012) [35] . Leaf number was determined by counting the number of leaves on each stand from the oldest to the one just emerging from the five stands of elephant grass (Desalegn, 2017) [15] . Leaf length was measured from the tip to the ligules of elephant grass which was conducted by using a meter rule on five stands that were previously selected (Desalegn, 2017) [15] . Leave width have been conducted by measuring the length of the leaf half way and at that point measure its width on five stands (Marafon, 2012) [35] . Tiller number was determined by direct counting of the tillers from five plants that were randomly selected (Desalegn, 2017) [15] . The stem diameter, measured in five plants per plot with a digital caliper (Marafon, 2012) [35] .
Yield and fodder productivity
The forages were harvested about 5 to 10 cm from the ground using sickles. The fresh weight of the harvested fodder in each plot was measured using spring balance. The biomass yields were calculated by using formula stated by Mutegi et al, (2008) [36] . Fresh subsamples of 500 g were taken from each experimental plot. Fodder samples were chopped and shredded to facilitate drying. Drying was done using a forced air draft oven at 65 °C for 72 hours. Dry matter percentage was estimated by dividing the dried forage sample by the fresh sample and multiply it by hundred. The dry biomass yield (DM, t/ha) was calculated using the following formula as DM yield (t/ha) = TFW x (DWss /HA x FWss) x 10
Where; TFW = total fresh weight kg/plot, DWss = dry weight of subsample in grams, FWss = fresh weight of subsample in grams, HA = Harvest plot area in square meters and 10 is a constant for conversion of yields in kg/m2 to t/ha.
Partial budget analysis
Partial budget analysis for this experiment was performed according to Upton (1979) [52] to evaluate the profitability of the treatments. It was assessed by the variable costs of fertilizer and labor. The sale price of elephant grass was estimated using local market observations. The difference in the sale and purchase of all inputs in each treatment was considered as a total return (TR). The net return (NR) was calculated by subtracting the total variable cost (TVC) from the total return (TR):
NR = TR -TVC
The change in net return (ΔNR) was calculated as the difference between the change in total return (ΔTR) and the change in total variable cost (ΔTVC) as:
The marginal rate of return (MRR) measures the increase in NR and is associated with each additional unit of expenditure (ΔTVC), which was the difference among the three rates of nitrogen fertilizer excluding positive control and normally expressed as a percentage.
MRR = ΔNR/ΔTVC*100
MRR = ΔNR/ΔTVC*100
Data analysis
The collected field performance data (plant height, number of tillers, number of leaf and biomass yield) were analysed using analysis of variance (ANOVA) procedures of SPSS. Critical differences (CD) at 5% significance level were used for comparison of means. The following general model was used for data analysis:
Yij= μ+Bi+Tj+Eij
Where, Yij = Response of parameters, μ = Overall mean, Bi = ith block effect, Tj = jth treatment effect, Eij = Random error.
Results and discussion
Results and discussion
Plant height of a crop at harvest is a function of the wellcoordinated interplay of the inherent and the environmental factors. The data of plant height (cm) are presented in Table 2. In present experiment plant height increase with increasing of nitrogen dose. Application of N increased plant height significantly over T0 (89.44 cm) as well as 25 kg N ha -1 (111.33 cm) and 50 kg N ha -1 (132.67 cm) in entire experimental period. On an average, crop fertilized @ 125 kg N ha -1 produced the tallest plants (166.78 cm) but that did not differ significantly from the crop fertilized @ 100 kg N ha -1 (164.22 cm) and 75 kg N ha -1 (150.11 cm). In otherwise lowest plant height was recorded in control treatment (89.44 cm). However, T 5 , T 4 and T 3 treatments are at par with each other. The findings of present experiment are supported by the Ebrahim et al, (2020 b ) [16,17] who recorded the plant height as 80, 130, 190, and 210 cm fertilized 0, 69, 115, 161 kg N/h -1 , respectively. Wang et al, (2002) [53] also recorded the similar results ranging from 43 to 111 cm. In the contrary, Francisco et al, (2018) [55] recorded the smaller plant heights then current findings. However, Plant height of elephant grass ranging from 186 to 275 cm was reported when fertilized with 50 kg N ha -1 (Mamaru, 2018) [34] , which was higher than observed value in the current study. (8.78). The result studied was agree with findings reported by Hendarto et al, (2021) [30] , who recorded that the number of plants/tillers as 13.00, 15.33 and 19.33 stem/clump application of nitrogen at 100, 200 and 300 kg N/h -1 , respectively. The variation tiller number due to different genetic variation, soil fertility, soil moisture and environmental factors. This idea is agreed with the variation of elephant grass tillers per plant reported under central Kenya by Mwendia et al, (2008) [37] . Furthermore, Mamaru (2018) [34] which ranged from 9-12 plant per tiller from Ethiopia. Apart from, Tessema (2008) [49] recorded higher number of plant/tillers ranging 18.80 to 25.53 with average mean 21.75 compared to present experiment.
| Parameters | Treatments | — | — | — | — | — | SEM | C.D. (P<0.05) | P |
|---|---|---|---|---|---|---|---|---|---|
| T0 | T1 | T2 | T3 | T4 | T5 | ||||
| Plant height (cm) | 89.44e | 111.33de | 132.67cd | 150.11abc | 164.22ab | 166.78a | 7.58 | 22.75 | 0.0002 |
| Number of plants per tiller | 8.78e | 10.33d | 11.44cd | 12.33c | 14.67a | 14.33ab | 0.52 | 1.58 | <0.0001 |
| Number of leaves per plant | 9.00e | 10.89d | 12.22cd | 12.56bc | 13.67ab | 14.11a | 0.47 | 1.40 | 0.0013 |
| Number of leaves per tiller | 57.56d | 68.00cd | 71.89cd | 73.44bc | 79.44ab | 86.56a | 2.46 | 7.41 | 0.0020 |
| Leaves length per plant (cm) | 63.22e | 67.78de | 72.00d | 83.78abc | 84.00ab | 85.11a | 2.19 | 6.57 | <0.0001 |
| Leaves blade width (cm) | 2.41f | 2.98e | 3.47cd | 3.51c | 4.04ab | 4.15a | 0.14 | 0.44 | <0.0001 |
| Basal circumference of stem (cm) | 2.67a | 2.56ab | 2.22cde | 2.34c | 2.31cd | 2.02f | 0.05 | 0.16 | <0.0001 |
Table text extracted from the original PDF; superscript letters are shown inline. The original table image is below.
View original table image
Number of plants per tiller
Number of plants per tiller
Number of leaves/plants
The data pertaining to number of plants/clumps under different treatments are given in Table 2. The analysis of the result indicated that there was significantly (p<0.05) higher number of leave/plants in T 5 (14.11) as compared to control group (9.00), T 1 (10.89), T 2 (12.22), and T 3 (12.56). Even so, T 5 and T 4 was at par with each other. The findings of experiment are supported by Teshale et al, (2022) [48] who recorded number of leaves per plants as 15 [48] .
The mean of leaves length per plant (cm) of the experiment are shown in Table 2. The maximum average leaf length per plant was recorded in T 5 followed T 4 , T 3 , T 2 , T 1 and T 0 as 85.11, 84.00, 83.78, 72.00, 67.78 and 63.22 cm, respectively. The lowest average leaf length per plant was recorded from T 0 (63.22 cm). This result of experiment was numerically different. The result studied was agree with result reported by values by Teshale et al, (2022) [48] which ranged from 62.6 to 82 leaf length per plant from Ethiopia. Similar, results also recorded by Fauzi et al, (2020) [19] . They had recorded as 73.2, 82.8 and 81.9 cm leaf length fertilized by 0 kg N/ha/year, 500 kg N/ha/year, and 1000 kg N/ha/year, respectively. Rahetlah et al, (2014) [44] also perceive leaf length from 66 to 84.7 cm with average 76.5 cm. The variation length of leaves due to different genetic variation, soil fertility, soil moisture, environmental factors and harvesting times.
The maximum average leaf blade width (cm) per plant was recorded in T 5 followed T 4 , T 3 , T 2 , T 1 and T 0 as 4.15, 4.04, 3.51, 3.47, 2.98 and 2.41 cm, respectively. This result of experiment was numerically different. The result studied was supported by Favare et al, (2019) [20] . Who observed that leaf blade width as 1.23 to 5.37 cm in dry season and 3.06 to 5.09 cm in rainy season. Although, Fauzi et al, (2020) [19] recorded lower leaf blade width as 1.8, 2.3 and 2.2 cm fertilized by 0.0, 500 and 1000 kg N/ha/year, respectively. In the contrary, Almeida et al, (2016) [3] observed maximum width of leaf blade as 6.60, 6.00 and 6.03 cm in Cubano Pinda genotype of elephant grass fertilized through 400, 1000 and 1600 kg N ha -1 .
As per the Table 2, the results regarding the stem diameters (cm) significantly (p<0.005) higher noted in T 0 (2.67 cm) group followed by T 2 , T 3 , T 4 , and T 5 as 2.22, 2.34, 2.31, and 2.02 cm, respectively. However, T 0 (2.67 cm) and T 1 (2.56 cm) treatments are at par with each other's. The results of current experiment is in line with the findings by Bueno et al, (2020) [13] 2.10±0.05, 2.07±0.06, 2.07±0.06, 2.14±0.04, 2.21± 0.03 cm stem diameters of elephant fodder application of N @ 0.0, 50, 100, 150 and 200 kg N ha -1 . The findings of present experiment are also comparable with Maleko et al, (2019) [33] . They observed that basal circumferences of stem as 2.19, 1.81, 1.18, 1.73 cm from Bana, KK 2 , Ouma and LN verities of elephant fodder.
The average stem production/tiller (kg) is presented in Table 3.The significantly (p<0.05) higher production of stem production/tiller found in T 5 (2.16 kg) as compared to over the T 4 (1.86 kg), T 3 (1.76 kg), T 2 (1.55 kg), T 1 (1.23 kg) and T 0 (0.99 kg). However, T 3 and T 2 and as well as T 1 and T 0 treatments had numerically difference or at par with each other's. The findings of present experiment are agreed with
| Parameters | Treatments | — | — | — | — | — | SEM | C.D. (P<0.05) | P |
|---|---|---|---|---|---|---|---|---|---|
| T0 | T1 | T2 | T3 | T4 | T5 | ||||
| Stem production/tiller (kg) | 0.99e | 1.23e | 1.55cd | 1.76bc | 1.86b | 2.16a | 0.09 | 0.28 | <0.0001 |
| Leaf production/tiller (kg) | 0.86e | 1.10de | 1.29cd | 1.45bc | 1.68ab | 1.86a | 0.08 | 0.25 | <0.0001 |
Table text extracted from the original PDF; superscript letters are shown inline. The original table image is below.
View original table image
Osak et al, (2018) [41] who recorded 2.72±0.19 kg stem production per tiller at harvested 45 days of sowing.
In term of leaves production per tiller, the maximum leaf production per tiller recorded in T 5 followed by T 4 , T 3 , T 2 , T 1 and T 0 as 1.86, 1.68, 1.45, 1.29, 1.10 and 0.86 kg, respectively. The higher dose of nitrogen increases the leaf production per tiller (kg) as compared to control group. Osak et al, (2018) [41] findings were supported to present experiment results. They were recorded 2.26±0.11 kg leaf production per tiller at harvested 45 days of sowing.
The data of fresh fodder production per tiller (Kg) is shown in Table 3. Application of nitrogen increase the fresh fodder production/tiller significantly (p<0.005) over the control group in entire experimental period. On other hand, fodder fertilized @ 125 kg N ha -1 yielded the maximum fresh fodder production/tiller (4.02 kg) that significantly differ from rest of treatment groups. The findings of present experimental trial were supported by Osak et al, (2018) [41] . They had recorded 4.98±0.27 kg fresh fodder production per tiller under Coconut-Beef Cattle Integrated Farming System in South Minahasa, Indonesia.
The data regarding the fresh biomass yield ha -1 is presented in Table 3. The fresh biomass yield is important parameters, which allow farmers and pastoralists for cut and carry system for using the herbage yield of forage (Getnet, 2003; Getiso and Mijena, 2021) [23,24] . The average fresh biomass production of elephant grass is 25.27 kilograms per plot (6 m 2 ). This production is much higher than the research of Hendarto et al, (2020) [29] which was recorded only about 2 kg per square meter, due to differences in the conditions of the research location. However, production is still lower than the production potential of elephant grass. The average fresh forage production of elephant grass application of N increased green fodder yield significantly (p<0.005) over control treatment. On an average, fodder fertilized @ 125 kg N ha -1 produced significantly maximum yield (32.59 t ha -1 ) as compared to T 4 (26.95 t ha -1 ), T 3 (24.97 t ha -1 ), T 2 (22.59 t ha -1 ), T 1 (18.62 t ha -1 ) and T 0 (14.12 t ha -1 ). However, T 4 and T 3 and T 3 and T 2 and T 2 and T 1 treatments are the at par with each other's. The results of current experiment are supported by Hendarto et al, (2021) [30] , who stated that the green fodder yield as 36.59, 37.24 and 39.95 t/ha -1 fertilized 100, 200 and 300 kg/ha/urea, respectively. The current results for fresh biomass yield were lower than the results (22.2 to 57.3 t/ha) for fresh biomass yield reported by Habtie et al, (2020) [26] . In addition, Hidosa et al, (2022) [31] also observed similar findings as 38.16, 29.15, 29.57 and 18.60 ton/ha fresh biomass yield for ILRI-16840, Werer-1333, Areka-local and Werer-local, respectively in South Omo, South-Western Ethiopia. Although, Getiso and Mijena (2021) [23] stated higher fresh biomass yield as 64.
The effects of nitrogen levels on dry biomass yields of elephant grass are presented in Table 3. Dry matter yield is the basic component related to the forage production. The dry matter yield of elephant grass increased as well as the nitrogen level increased (Table 3). The result revealed that the T 5 (6.85 t/ha) yielded higher (p<0.05) dry biomass yields than T 3 (5.00 t/ha), T 2 (4.34 t/ha), T 1 (3.24 t/ha) and T 0 (1.96 t/ha) treatments, but dry biomass yields in T 5 and T 4 , and T 4 and T 3 as well as T 3 and T 2 treatments are at par with each other's. Nitrogen element is basically related with the growth of crop or grass. This showed that nitrogen level significantly affected the dry matter yield. The results of present experiment are agreed with Ullah et al, (2010) [51] , who stated that different levels of nitrogen application in elephant grass significantly affected dry matter yield. They recorded as 1.2, 1.7, 2.0 and 2.0 t ha -1 dry matter yield of elephant grass after applied nitrogen @ 0, 40, 80 and 120 kg N ha -1 , respectively. Furthermore, the dry biomass yield from this experiment is also similar reported by Gezahagn et al, (2017) [25] as 6.84 ton/ha for six elephant grass cultivars and Tesfaye (2018) [47] as 4.2 ton/ha for nine Elephant grass cultivars, but it was lower than reported value ranged from 7.22 to ton/ha by Getiso and Mijena (2021) [23] in Wondo Genet, Ethiopia and 8.70 to 18.27 ton/ha by Hidosa et al, (2022) [31] under rainfed condition in South Omo, Southwestern Ethiopia.
Partial budget analysis of elephant grass
The rate of N fertilizer application determines the cost and biomass production of elephant grass (Sant'Ana et al, 2018) [45] so that Partial budget analysis is very vital to evaluate its' economic feasibility (Oliveira et al, 2015) [40] . In the present experiment, the partial budget analysis was done to evaluate the elephant grass grower farmers' profitability by producing elephant grass fertilized with different rates of N (Table 4). The result of the partial budget analysis revealed that fertilizing elephant grass with N resulted in a relatively higher net return such as T [16,17] who recorded net returns as 2491.5, 6700.9, 9992.9 and 9509.1 ETB/ha applied nitrogen 0.0, 69, 115 and 161 kg N ha -1 , respectively.
| S.N. | Descriptions | Treatments | — | — | — | — | — |
|---|---|---|---|---|---|---|---|
| T0 | T1 | T2 | T3 | T4 | T5 | ||
| 1. | Dry matter yield in ton DM ha-1 | 1.96 | 3.84 | 4.34 | 5.00 | 6.03 | 6.85 |
| 2. | Selling price per ha-1 (@ETB 6568 ton/DMY) * | 12873.28 | 25221.12 | 28505.12 | 32840.0 | 39605.04 | 44990.80 |
| 3. | Nitrogen quantity (kg) required for ha-1 | 0.0 | 54.34 | 108.69 | 163.04 | 217.39 | 271.73 |
| 4. | Price of urea fertilizer @ 100 birr/kg for ha-1 | 0.0 | 5435.0 | 10869.0 | 16304.0 | 21739.0 | 27173.0 |
| 5. | Cost of ploughing, labour for land and pit preparation in ETB ha-1 | 4000.0 | 4000.0 | 4000.0 | 4000.0 | 4000.0 | 4000.0 |
| 6. | Cost of labour for planting and harvest in ETB ha-1 | 4000.0 | 4000.0 | 4000.0 | 4000.0 | 4000.0 | 4000.0 |
| 7. | Cost of labour for fertilizer application in ETB ha-1 | 0.0 | 1500.0 | 1500.0 | 1500.0 | 1500.0 | 1500.0 |
| 8. | Cost of labour for weed management in ETB ha-1 | 3000.0 | 3000.0 | 3000.0 | 3000.0 | 3000.0 | 3000.0 |
| 9. | TVC (4+7) | 0.00 | 6118.90 | 10738.65 | 15358.40 | 19978.15 | 24597.05 |
| 10. | TR [(2)-5+6+8)] | 1873.28 | 10354.53 | 17505.12 | 21840.00 | 28605.04 | 33990.80 |
| 11. | NR (10-9) | 1873.28 | 4235.63 | 6766.47 | 6481.60 | 8626.89 | 9393.75 |
| 12. | ΔTVC | 0.00 | 6934.00 | 12369.00 | 17804.00 | 23239.00 | 28673.00 |
| 13. | ΔTR | 0.00 | 8481.25 | 15631.84 | 19966.72 | 26731.76 | 32117.52 |
| 14. | ΔNR | 0.00 | 1547.25 | 3262.84 | 2162.72 | 3492.76 | 3444.52 |
| 15. | MRR | 0.00 | 22.31 | 26.38 | 12.15 | 15.03 | 12.01 |
Table text extracted from the original PDF; superscript letters are shown inline. The original table image is below.
View original table image
| Fresh fodder production /tiller (kg) | 1.85e | 2.33de | 2.84cd | 3.21bc | 3.54ab | 4.02a | 0.18 | 0.54 | <0.0001 |
|---|---|---|---|---|---|---|---|---|---|
| Green fodder/plot (Kg/6 m2) | 8.47f | 11.17e | 13.55cd | 14.98bc | 16.17b | 19.56a | 0.87 | 2.61 | <0.0001 |
| Green fodder yield (t/ha) | 14.12f | 18.62de | 22.59cd | 24.97bc | 26.95b | 32.59a | 1.45 | 4.34 | <0.0001 |
| Dry fodder yield (t/ha) | 1.96e | 3.24de | 4.34cd | 5.00bc | 6.03ab | 6.85a | 0.53 | 1.59 | <0.0001 |
Table text extracted from the original PDF; superscript letters are shown inline. The original table image is below.
View original table image
Conclusion and recommendations
From the results of present experiment, it can be concluded that nitrogen fertilizer rate had a significant effect on the growth characteristics and on forage yield of elephant grass. Forage yield and morphological characteristics increased in response to increasing the rate of nitrogen fertilizers. The treatment T 5 group (125 kg N/ha) yielded maximum dry matter (6.85 t/ha) over the control treatment group (1.96 t/ha). Looking on the basis of net returns, T 5 group provided maximum return (9393.75 ETB/ha) then other experimental treatment groups. However, marginal rate of return (%) higher found in T 2 as compared to control as well as other experimental treatment groups. Therefore, it was observed that as an economically feasible N fertilizer rate, suggesting 125 kg N ha -1 to be recommended for farmers to grow as it may lead to economical forage production.
Conflict of interest
Authors declare no conflict of interest associated with present publication
Acknowledgement
AcknowledgmentsThe researchers are thankful to the Directorate of Research and Community Services, Bule Hora University Bule Hora, Ethiopia for providing the funds to conducted the successfully experiments. Moreover, researchers also thankful to the Dean, College of Agriculture to release the experimental money.
References
54 in the original paper- Adugna B. Assessment of challenges and opportunities of wetlands management in Bule Hora Woreda, Borena Zone, Southern Ethiopia. Sci Technol Arts Res J. 2012;4(2):99-111.
- Almeida BO, Daher RF, Novo AAC, Gravina GA, Vivas M, Moraes CRO, et al. Effect of nitrogen and potassium fertilizations on elephant grass genotypes used for energy purposes in Northern Rio de Janeiro State, Brazil. African J Agric Res. 2016;11(49):50435049.
- Aranguiz AA, Creemers J. Quick scan of Ethiopia's forage sub-sector. Wageningen: Wageningen URLivestock Research; 2019.
- Asresie A, Zemedu L, Adigrat E. The contribution of livestock sector in Ethiopian economy: a review. Adv Life Sci Techno. 2015;29:1-10.
- Ball DM, Collins M, Lacefield GD, Martin NP, Mertens DA, Olson KE, et al. Understanding forage quality. Park Ridge: American Farm Bureau Federation; 2001.
- CGIAR Research Program on Climate Change, Agriculture and Food Security; 2015.
- Bimrew A, Demeke S, Taye T, Tegegne F, Haile A, Wamatu J. Effects of altitude and harvesting dates on morphological characteristics, yield and nutritive value of desho grass (Pennisetum pedicellatum Trin.). Agric Nat Resour. 2017;51(3):148-153. DOI:10.1016/j.anres.2016.11.001.
- Black CA. Methods of soil analysis. Part II. Madison: American Society of Agronomy; 1965.
- Bob M. The good, bad and interesting roles of nitrogen and nitrogen fertilizers in home lawn care. Minnesota: University of Minnesota Cooperative Extension; 2011.
- Bouyoucos CJ. Hydrometer method for making particle size analysis of soil. Agron J. 1962;54:464-465.
- Bray RH, Kurtz LT. Determination of total, organic and available forms of phosphorus in soil. Soil Sci. 1945;59:38-45.
- Bueno AM, Andrade AF, Vicosi KA, Flores RA, Sette CR Jr, Cunha TQG, et al. Does nitrogen application improve elephant grass yield and energetic characteristics of biofuels? BioEnergy Res. 2020;13:112. DOI:10.1007/s12155-020-10198-5.
- CSA. Central Statistical Agency of the Federal Democratic Republic of Ethiopia Agricultural Sample Survey 2017/18: Report on Livestock and Livestock Characteristics (Private Peasant Holdings). Statistical Bulletin 587(II). Addis Ababa: CSA; 2018.
- Desalegn A. Effect of manure levels and alfalfa (Medicago sativa) cultivars intercropping on dry matter yield of napier grass (Pennisetum purpureum L.) under irrigation in Kobo district, Ethiopia. J Fisheries Livest Prod. 2017;5(3):241-245.
- Ebrahim H, Negussie F, Animut G. Effect of levels of N fertilizer and cutting height on nutrient content and nitrogen recovery rate of elephant grass (Pennisetum purpureum L.). J Anim Res. 2020;10(5):685-690.
- Ebrahim H, Negussie F, Animut G. Effects of nitrogen fertilizer rate and cutting height on morphological characteristics and yield of elephant grass (Pennisetum purpureum L.). East African J Sci. 2020;14(2):141-150.
- FAO. Report on feed inventory and feed balance in Ethiopia. Rome: Food and Agriculture Organization; 2018.
- Fauzi MM, Seotanto H, Mashudi. Effect of nitrogen and sulphur on the production and nutritive values of two elephant grass cultivars at two different harvesting times. IOP Conf Ser Earth Environ Sci. 2020;478:012082.
- Favare HG, Abreu JG, Barros LV, Silva FG, Ferreira LMM, Barelli MAA, et al. Effect of elephant grass genotypes to bioenergy production. J Experi Agric Int. 2019;38(1):1-11.
- Gadisa B, Dinkale T, Debela M. Agronomic performance evaluation of elephant (Pennisetum purpureum L. Schumach) grass cultivars for fodder production at Mechara Research Station, Eastern Oromia, Ethiopia. World J Agric Sci. 2021;17(3):169176.
- Gelayenew B, Tamir B, Assefa G, Feyissa F. Effects of spacing of elephant grass and vetch intercropping on agronomic performance and herbage yield of elephant grass. Ethiopian J Agric Sci. 2020;30(2):13-30.
- Getiso A, Mijena D. Performance evaluation of napier grass (Pennisetum purpureum L. Schumach) accessions under rain fed and irrigation system at Wondo Genet. Glob J Ecol. 2021;6(1):028-033. DOI:10.17352/gje.0000141.
- Getnet A. Feed resource development and utilization: possible options and recommendations under Ethiopian condition. Training handout. Holeta: Holeta Agricultural Research Center; 2003.
- Schumach) accessions in different agro-ecological zones of Ethiopia. J Agric Crop Res. 2017;5(4):49-65.
- Habtie A, Mezgebu G, Esubalew S, Bainesagn W. Screening of napier grass (Pennisetum purpureum) accessions tolerant to acid soils in some areas of Ethiopia. Int Scient Engine Sci. 2020;4:1-6. Available from: https://bit.ly/3eDWlV5.
- Halim RA, Shampazuraini S, Indris AB. Yield and nutritive quality of nine napier grass varieties in Malaysia. Mal J Anim Sci. 2013;16(2):37-44.
- Havlin JL, Beaton JD, Tisdale SL, Nelson WL. Soil fertility and fertilizers: an introduction to nutrient management. 6th ed. India: Pearson Education; 1999.
- Hendarto E, Bahrun N, Hidayat HH. Pertumbuhan, produksi dan daya tampung tanaman rumput king dibawah pengaruh kompos kotoran sapi potong diperkaya Azolla microphylla. In: Proceeding Seminar Fakultas Peternakan Unsoed Purwokerto; 2020.
- Hendarto E, Hidayat N, Setyaningrum A, Harwanto H. The effect of various types and fertilizer dosages on king grass (Pennisetum purpuphoides): growth, production, and carrying capacity. Adv Biol Sci Res. 2021;20:288-295.
- Hidosa D, Zeleke B, Nahom F. Evaluation of elephant (Pennisetum purpureum) grass variety for agronomic parameters and biomass yields under rain fed condition to improve feed availability in South Omo, Southwestern Ethiopia. J Vet Med Animal Sci. 2022;5(1):1107-1115.
- Jackson ML. Soil chemical analysis. New Delhi: Prentice Hall of India; 1973. p.46, 128.
- Maleko D, Mwilawa A, Msalya G, Pasape L, Mtei K. Forage growth, yield and nutritional characteristics of four varieties of napier grass (Pennisetum purpureum Schumach) in the West Usambara highlands, Tanzania. Scientific African. 2019;6:e00214. DOI:10.1016/j.sciaf.2019.e00214.
- Mamaru T. Evaluation of napier grass (Pennisetum purpureum (L.) Schumach) accessions for agronomic traits under acidic soil conditions of Nejo area, Ethiopia. Int J Agric Biosci. 2018;7(2):30-35.
- Marafon AC. Quantitative analysis of sugarcane growth: an introduction to the practical procedure. Aracajú: Embrapa Tabuleiros Costeiros; 2012.
- Mutegi JK, Mugendi DK, Verchot L, Kung'u JB. Combining napier grass with leguminous shrubs in contour hedgerows controls soil erosion without competing with crops. Agroforestry Syst. 2008;74:3749.
- Mwendia SW, Mwangi DW, Wahome RG, Wanyoike M. Assessment of growth rate and yields of three napier grass varieties in Central Highlands of Kenya. East Afr Agric For J. 2008;74:211-217.
- Negawo AT, Teshome A, Kumar A, Hanson J, Jones CS. Opportunities for napier grass (Pennisetum purpureum) improvement using molecular genetics. Agronomy. 2017;7(28):1-13. DOI:10.3390/agronomy7020028.
- Okwori AI, Magani IE. Influence of nitrogen sources and cutting interval on the digestibility of four grass species in the southern guinea savanna of Nigeria. Agric Bio J North Am. 2010;1:526-533.
- Oliveira S, Daher RFP, Ponciano NJ, Gravina GDA, Augusto J. Variation of morpho-agronomic and International Journal of Biology Sciences https://www.biologyjournal.net biomass quality traits in elephant grass for energy purposes according to nitrogen levels. American J Plant Sci. 2015;6:1685-1696.
- Osak EMFR, Anis SD, Rumambi A. Productivity of dwarf elephant grass (Pennisetum purpureum cv. Mott) and coconut (Cocos nucifera) in coconut-beef cattle integrated farming system in South Minahasa, Indonesia. Int J Environ Agric Biotech. 2018;3(5):1874-1878.
- Pandey S, Sinha BK. Plant physiology. 4th ed. New Delhi: Vikas Publishing House; 2006.
- Piper CS. Soil and plant analysis. Bombay: Hans Publishers; 1966. p.19-136.
- Rahetlah VB, Randrianaivoarivony JM, Andrianarisoa B, Ramalanjaona V. Yield response of elephant grass (Pennisetum purpureum) guano organic fertilizer in the Highlands of Madagascar. Livest Res Rural Dev. 2014;26(1):1-9. Available from: www.lrrd.org/lrrd26/1/rahe26003.htm.
- Sant'Ana JAA, Daher RFP, Ponciano NJ, Santos MMP, Viana AP. Nitrogen and phosphate fertilizers in elephant grass for energy use. African J Agric Res. 2018;13(16):806-813.
- Subbiah BV, Asija GL. A rapid procedure for the estimation of available nitrogen in soils. Curr Sci. 1956;25:259-260.
- Tesfaye M. Evaluation of napier grass (Pennisetum purpureum (L.) Schumach) accessions for agronomic traits under acidic soil conditions of Nejo Area, Ethiopia. Int J Agri Biosci. 2018;7:30-35.
- Teshale J, Bekele K, Tesfaye G, Amare Z. Evaluation of elephant grass (Pennisetum purpureum L.) accessions for agronomic performances in lowland areas of Guji Zone, Southern Oromia, Ethiopia. American J Biol Environ Statis. 2022;8(1):31-35. DOI:10.11648/j.ajbes.20220801.14.
- Tessema Z. Effect of plant density on morphological characteristics, yield and chemical composition of napier grass (Pennisetum purpureum (L.) Schumach). East African J Sci. 2008;2(1):55-61.
- Tolera A, Yami A, Alemu D. Livestock feed resources in Ethiopia: challenges, opportunities and need for transformation. Ethiopian Animal Feeds Industry Association; 2012.
- Ullah MA, Anwar M, Rana AS. Effect of nitrogen fertilization and harvesting intervals on yield and forage quality of elephant grass (Pennisetum purpureum) under mesic climate of Pothowar plateau. Pak J Agri Sci. 2010;47(3):231-234.
- Upton M. Farm management in Africa: the principle of production and planning. Oxford: Oxford University Press; 1979.
- Wang D, Poss JW, Donovan T, Shannon MC, Lesch SM. Biophysical properties and biomass production of elephant grass under saline conditions. J Arid Environ. 2002;52:447-456.
- Yeshitila A. Efficiency of livestock feed resources utilization and forage development in Alaba Woreda, Southern Ethiopia [MSc thesis]. Dire Dawa: Haramaya University; 2008.
- Francisco PM, Segri NJ, Borim FS, Malta DC. Prevalência simultânea de hipertensão e diabetes em idosos brasileiros: desigualdades individuais e contextuais. Ciência & Saúde Coletiva. 2018;23:382940.