
Research article · 2025 · Full text
International Journal of Advanced Chemistry ResearchMetabolomics profiling of serum biomarkers in chronic kidney disease patients
Volume 7(2) · Pages 73–76 · DOI: 10.33545/26646781.2025.v7.i2a.399 ↗
Research areasMetabolomics and Mass Spectrometry StudiesChronic Kidney Disease and DiabetesDialysis and Renal Disease Management
Abstract
Author-writtenThis research applied untargeted metabolomics using liquid chromatography-tandem mass spectrometry (LC-MS/MS) to profile serum metabolites across five stages of chronic kidney disease (CKD) and healthy controls, identifying uremic toxin signatures that correlate with disease progression. Fasting serum samples from 180 participants (30 per group: healthy, CKD stages 1, 2, 3a, 3b, and 4) were analysed on a Q-Exactive Orbitrap platform. Multivariate analysis (PLS-DA) separated CKD stages with Q² = 0.81 and R²Y = 0.93. Seven metabolites showed monotonic increases across stages: indoxyl sulfate, p-cresol sulfate, trimethylamine N-oxide (TMAO), hippuric acid, kynurenine, phenylacetylglutamine, and creatinine. Receiver operating characteristic analysis identified a three-metabolite panel (indoxyl sulfate + p-cresol sulfate + TMAO) that discriminated CKD stage ≥3a from earlier stages with AUC = 0.94 (95% CI: 0.90-0.97). Pearson correlation confirmed strong inverse relationships between all seven toxins and estimated glomerular filtration rate (eGFR). These findings support serum metabolomics as a tool for early CKD staging and risk stratification.
Summary
Source-checkedPlain-language reading of the full paper, prepared with AI and checked against the text. Each point links to the authors' own words.
Why it matters
- Chronic kidney disease (CKD) affects about 10% of adults worldwide, but is often missed in early stages because it lacks symptoms and standard markers like creatinine and eGFR are not sensitive enough. View evidence ↗
- Standard creatinine tests may only indicate a problem after roughly 50% of functional nephrons have been lost. View evidence ↗
- Certain uremic toxins, specifically indoxyl sulfate, p-cresol sulfate, and TMAO, serve as both markers of kidney injury and drivers of cardiovascular damage. View evidence ↗
The question
- The study aimed to use untargeted metabolomics to identify serum uremic toxin signatures that correlate with the progression of CKD across five stages compared to healthy controls. View evidence ↗
What they did
- The researchers analyzed fasting serum samples from 180 participants, divided into six groups of 30 people each: healthy controls and patients in CKD stages 1, 2, 3a, 3b, and 4. View evidence ↗
- Metabolites were separated using a Vanquish UHPLC system with an Acquity BEH C18 column and detected using a Q-Exactive HF Orbitrap mass spectrometer. View evidence ↗
- The study employed one-way ANOVA with Bonferroni correction, PLS-DA for group separation, and ROC curves to evaluate the performance of biomarker panels. View evidence ↗
What they found
- The PLS-DA model successfully separated the groups with a Q² of 0.81 and an R²Y of 0.93. View evidence ↗
- Seven target metabolites increased steadily across CKD stages, with indoxyl sulfate showing the most significant increase, rising 40-fold from 0.12 mg/dL in healthy controls to 4.82 mg/dL in stage 4. View evidence ↗
- p-Cresol sulfate and TMAO increased 40-fold and 39-fold respectively, which are much larger increases than the 6.4-fold rise seen in creatinine. View evidence ↗
- A panel consisting of indoxyl sulfate, p-cresol sulfate, and TMAO could distinguish CKD stage 3a or higher from earlier stages and healthy controls with an AUC of 0.94. View evidence ↗
- The three-metabolite panel demonstrated a sensitivity of 91.1% and a specificity of 88.3% at the optimal cut-off. View evidence ↗
- All seven biomarkers showed strong inverse correlations with eGFR (r = -0.63 to -0.94), with indoxyl sulfate (r = -0.85) being the strongest individual predictor for staging. View evidence ↗
What it means
- The authors conclude that these serum biomarkers are better than creatinine alone for early-stage CKD discrimination and should be validated in larger, multi-center studies. View evidence ↗
- The researchers did not distinguish between free and protein-bound fractions of p-cresol sulfate and indoxyl sulfate, which could affect biological activity and clearance. View evidence ↗
Visual summary
3 visualsIllustrations explain the paper; charts are replotted from the paper's own table values.
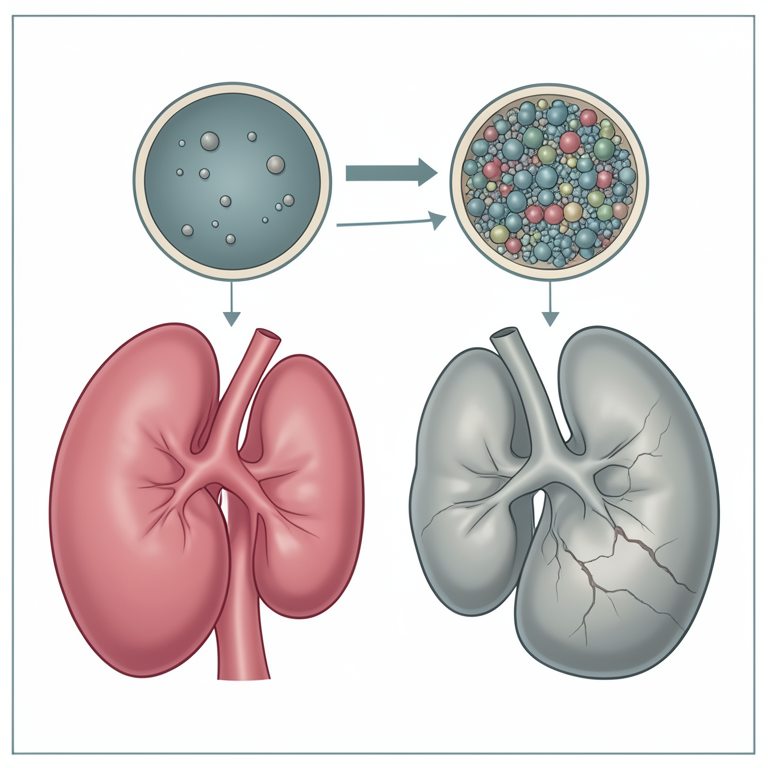
Comparative Accumulation of Biomarkers
AI-generated conceptual illustration (human kidneys and serum blood vessels). It explains the idea and does not show study data.
View source evidence ↗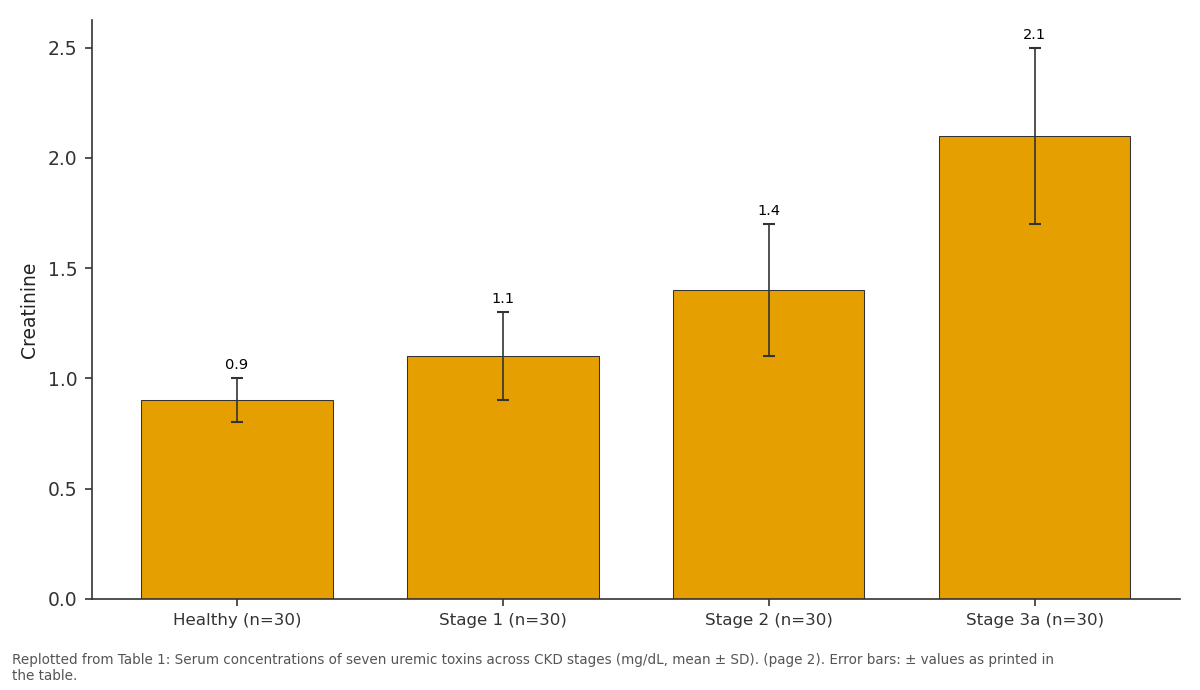
Creatinine: Healthy (n=30) vs Stage 1 (n=30) vs Stage 2 (n=30) vs Stage 3a (n=30)
Replotted from Table 1 (page 2) of the original paper. Every bar is the paper's own table value.
View source evidence ↗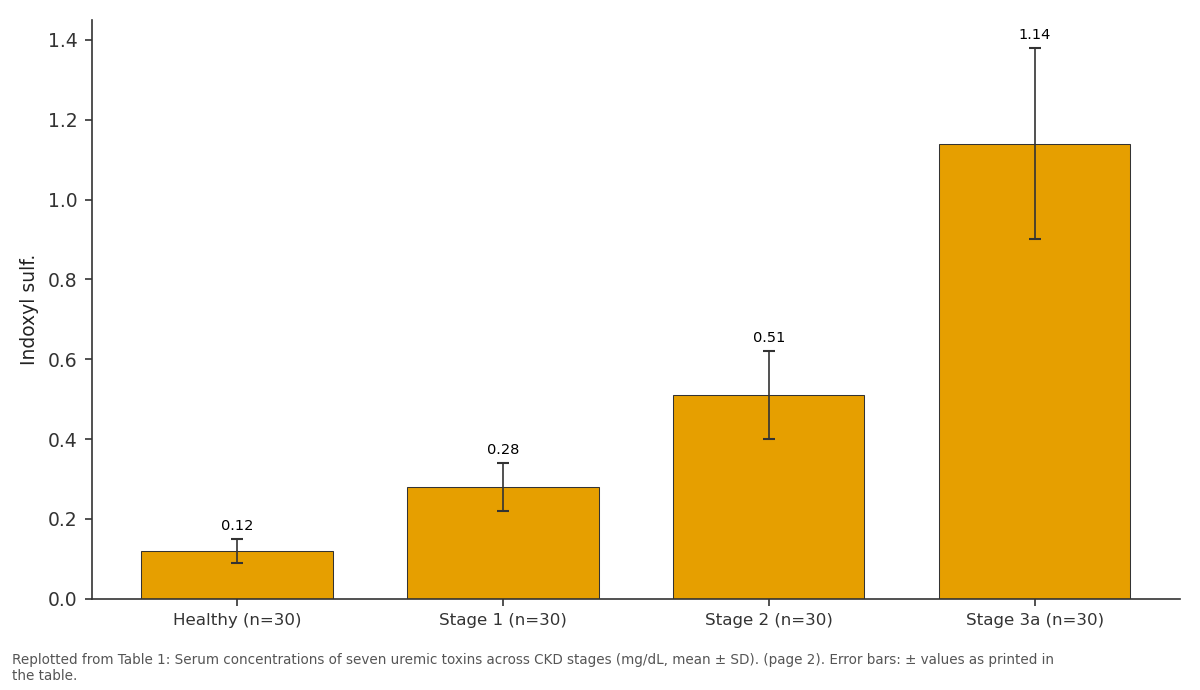
Indoxyl sulf.: Healthy (n=30) vs Stage 1 (n=30) vs Stage 2 (n=30) vs Stage 3a (n=30)
Replotted from Table 1 (page 2) of the original paper. Every bar is the paper's own table value.
View source evidence ↗Figures & tables
From the original paper Table 1
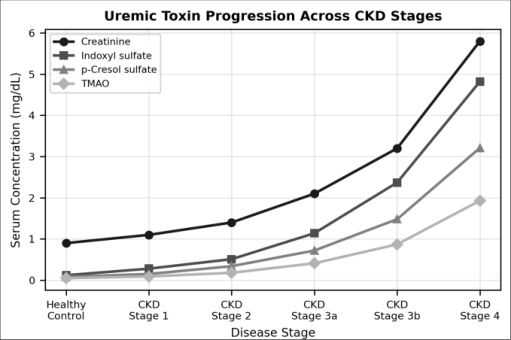 Figure 1
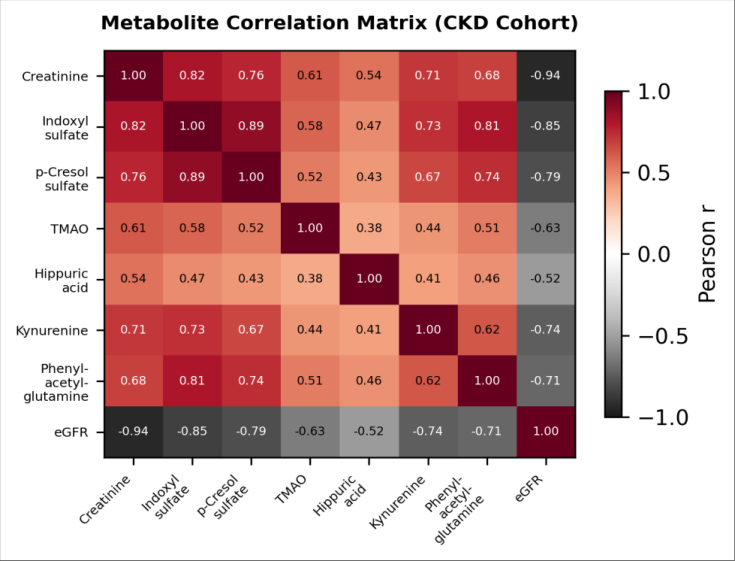 Figure 2
 Table 2
Introduction
Chronic kidney disease affects roughly 10% of the global adult population, yet most patients are undiagnosed until advanced stages because early CKD is asymptomatic and conventional markers serum creatinine and eGFR lack sensitivity at mild to moderate nephron loss [1] . By the time creatinine rises above the normal range, approximately 50% of functional nephrons are already lost [2] . This diagnostic gap has motivated the search for metabolite panels that reflect kidney function decline earlier and with greater specificity. Uremic toxins are metabolic waste products that accumulate as renal clearance deteriorates. The European Uremic Toxin Work Group has catalogued over 150 compounds, classified by molecular weight into small water-soluble molecules (< 500 Da), middle molecules (500-60,000 Da), and protein-bound toxins [3] . Among these, indoxyl sulfate, p-cresol sulfate, and TMAO have attracted particular attention because they are not only markers of kidney injury but also mediators of cardiovascular damage through endothelial dysfunction, oxidative stress, and vascular calcification [4,5] . Untargeted metabolomics using high-resolution mass spectrometry can simultaneously quantify hundreds of small molecules in a single serum sample, making it well suited for discovering multivariate biomarker signatures [6] . Several groups have applied the approach to CKD, but most studies compare only two groups (CKD versus healthy) or focus on endstage renal disease [7] . The progressive accumulation of uremic toxins across the full spectrum of CKD stages has not been systematically characterized in an Indian population, where dietary habits (high vegetarian protein, spice-rich foods) may alter gut-derived toxin production.
Extraction Protocol
Serum metabolite extraction followed a protein-precipitation workflow. Fasting blood samples (5 mL) were collected in serum-separator tubes, allowed to clot for 30 min at room temperature, and centrifuged at 3000 × g for 10 min at 4 °C. Serum aliquots (200 μL) were mixed with 800 μL of icecold methanol/acetonitrile (1:1, v/v) containing internal standards (d4-creatinine, d7-indoxyl sulfate, and d9-TMAO at 1 μM each). After vortexing for 60 s and standing at -20 °C for 20 min, the mixture was centrifuged at 14,000 × g for 15 min. The supernatant was dried under nitrogen, reconstituted in 100 μL of water/acetonitrile (95:5), and transferred to HPLC vials. Quality control (QC) samples were prepared by pooling equal volumes from all 180 participants.
Material
LC-MS grade methanol, acetonitrile, formic acid (99.5%), and ammonium formate (99%) were purchased from Merck. Authentic standards of indoxyl sulfate potassium salt (98%), p-cresol sulfate sodium salt (97%), TMAO (≥95%), hippuric acid (98%), L-kynurenine (98%), phenylacetylglutamine (97%), and creatinine (99%) were from Sigma-Aldrich. Deuterated internal standards were from Cambridge Isotope Laboratories. Ultrapure water was generated by a Milli-Q system (18.2 MΩ•cm). All serum collection materials were from BD Vacutainer.
Methods
Methods
Study Cohort
A total of 180 participants were recruited from the nephrology outpatient clinic of a tertiary hospital affiliated with the institute between January and December 2022. Inclusion criteria: age 18-75 years, confirmed CKD diagnosis by KDIGO guidelines (eGFR staging). Exclusion criteria: acute kidney injury, renal replacement therapy, active infection, malignancy, or pregnancy. Healthy controls had eGFR > 90 mL/min/1.73 m² with no proteinuria. The research protocol was approved by the institutional ethics committee (AIHE-EC/2022/031), and all participants provided written informed consent.
LC-MS/MS Analysis
Chromatographic separation was performed on a Vanquish UHPLC system (Thermo Fisher) fitted with an Acquity BEH C18 column (2.1 × 100 mm, 1.7 μm). Mobile phases were (A) water + 0.1% formic acid + 5 mM ammonium formate and (B) acetonitrile + 0.1% formic acid. The gradient ran from 2% B to 98% B over 15 min at 0.3 mL/min with column temperature at 40 °C. Detection used a Q-Exactive HF Orbitrap (Thermo Fisher) in data-dependent acquisition mode, scanning m/z 70-1050 at 120,000 resolution (MS1) with top-10 HCD fragmentation at 30,000 resolution.
Data Processing and Statistics
Raw data files were processed in Compound Discoverer 3.3 (Thermo Fisher) for peak detection, alignment, and annotation against mzCloud and HMDB databases. Features with coefficient of variation > 30% in QC samples were removed. Statistical analysis included one-way ANOVA with Bonferroni correction for multiple comparisons, partial least squares discriminant analysis (PLS-DA) in MetaboAnalyst 5.0, and receiver operating characteristic (ROC) curves for biomarker panel evaluation. Pearson correlations were calculated between metabolite concentrations and eGFR.
Results
Compound Discoverer detected 2,847 features after blank subtraction and QC filtering. Of these, 342 were annotated at MSI confidence level 2 or higher. PLS-DA of the full annotated feature set produced a model with five components, achieving Q² = 0.81 and R²Y = 0.93.
Permutation testing (1000 iterations) confirmed model validity (p<0.001). The first two components separated the six groups along a disease-severity gradient, with healthy controls and CKD stage 4 occupying opposite extremes of the score plot. All seven target metabolites increased monotonically across CKD stages (Table 1). Indoxyl sulfate showed the steepest rise, reaching 40-fold elevation at stage 4 relative to healthy controls (4.82 vs 0.12 mg/dL). p-Cresol sulfate and TMAO followed similar patterns with 40-fold and 39-fold increases, respectively. The fold-changes were significantly larger than creatinine's 6.4-fold increase, suggesting that these gutderived toxins accumulate disproportionately as renal clearance declines.
| Metabolite | Healthy (n=30) | Stage 1 (n=30) | Stage 2 (n=30) | Stage 3a (n=30) | Stage 3b (n=30) | Stage 4 (n=30) |
|---|---|---|---|---|---|---|
| Creatinine | 0.9±0.1 | 1.1±0.2 | 1.4±0.3 | 2.1±0.4 | 3.2±0.6 | 5.8±1.1 |
| Indoxyl sulf. | 0.12±0.03 | 0.28±0.06 | 0.51±0.11 | 1.14±0.24 | 2.37±0.48 | 4.82±0.91 |
| p-Cresol sulf. | 0.08±0.02 | 0.15±0.04 | 0.34±0.08 | 0.72±0.16 | 1.48±0.31 | 3.21±0.67 |
| TMAO | 0.05±0.01 | 0.09±0.02 | 0.18±0.04 | 0.41±0.09 | 0.87±0.18 | 1.93±0.41 |
| Hippuric acid | 0.18±0.04 | 0.31±0.07 | 0.52±0.12 | 0.94±0.21 | 1.76±0.38 | 3.48±0.72 |
| Kynurenine | 0.04±0.01 | 0.08±0.02 | 0.14±0.03 | 0.29±0.06 | 0.58±0.12 | 1.21±0.26 |
| PAG | 0.06±0.02 | 0.12±0.03 | 0.23±0.05 | 0.48±0.11 | 0.96±0.20 | 2.04±0.43 |
Table text extracted from the original PDF; superscript letters are shown inline. The original table image is below.
View original table image
The three-metabolite ROC panel (indoxyl sulfate + p-cresol sulfate + TMAO) achieved AUC = 0.94 (95% CI: 0.90-0.97) for discriminating CKD stage ≥3a from stages 1-2 and healthy controls. At the optimal Youden index cut-off, sensitivity was 91.1% and specificity was 88.3%. Adding kynurenine as a fourth marker improved AUC marginally to 0.95 without meaningful gain in clinical utility.
Performance Evaluation
Analytical performance was assessed through QC samples injected every 10th run. Retention time drift was below 0.05 min across the 200-injection batch. Internal standard recovery ranged from 89-107% for all three deuterated compounds. Intra-day precision (n = 6 QC replicates) gave CVs of 3.1-7.8% for the seven target metabolites, and interday precision (three consecutive days) gave CVs of 4.9-11.2%, both within the FDA bioanalytical guidelines threshold of 15%.
Calibration curves for all seven metabolites were linear over at least two orders of magnitude (r² > 0.995). Lower limits of quantification ranged from 0.005 mg/dL (kynurenine) to 0.02 mg/dL (hippuric acid), well below the concentrations observed even in healthy controls. Matrix effects, assessed by post-extraction spike recovery, were 92-108% across all analytes, confirming that the protein-precipitation extraction provided a clean matrix suitable for accurate quantification.
Discussion
The 40-fold accumulation of indoxyl sulfate from healthy controls to CKD stage 4 exceeds the 6.4-fold rise in creatinine, underscoring why conventional markers miss early kidney function decline. Indoxyl sulfate is produced by hepatic sulfation of indole, itself a tryptophan metabolite generated by gut bacteria [4] . Its accumulation reflects not only reduced renal clearance but also altered gut microbiota composition that accompanies CKD, creating a feedforward cycle of toxin production and kidney damage [8] .
The strong inter-toxin correlations (r = 0.52-0.89) are expected because all seven metabolites share reduced renal clearance as a common accumulation driver. However, the clustering into tryptophan-pathway metabolites (indoxyl sulfate, kynurenine) and tyrosine-pathway metabolites (pcresol sulfate) suggests distinct gut microbial origins that may respond differently to dietary interventions or prebiotic supplementation [9] . The inverse correlations with eGFR (r = -0.63 to -0.94) confirm the biomarkers' potential for staging, with indoxyl sulfate-eGFR correlation (r = -0.85) being the strongest individual predictor. The three-metabolite panel's AUC of 0.94 for detecting stage ≥3a CKD compares favourably with reported panels in European and East Asian cohorts (AUC 0.88-0.92) [7,10] . The slightly higher performance may reflect the more homogeneous dietary background of our vegetarianpredominant Indian cohort, which produces a more consistent baseline metabolite profile. However, external validation in an independent population is needed before clinical deployment, and the cross-sectional design cannot establish whether elevated toxin levels at early stages predict future progression to end-stage renal disease. A limitation of this research is the relatively small sample size per group (n = 30), which limits statistical power for subgroup analyses by diet type, diabetes status, or medication use. Additionally, we did not measure free versus protein-bound fractions of indoxyl sulfate and pcresol sulfate, which may differ in biological activity and clearance kinetics [11] . Future longitudinal studies should track metabolite trajectories over time and correlate them with hard clinical endpoints such as dialysis initiation or cardiovascular events. The dietary context of the Indian cohort deserves comment. Approximately 68% of participants reported predominantly vegetarian diets, which are known to produce lower TMAO levels due to reduced choline and carnitine intake from animal sources. Despite this, TMAO still showed a 39-fold accumulation at stage 4, indicating that impaired renal clearance overwhelms any dietary modulation at advanced disease stages. This observation aligns with data from the Framingham Heart Study showing that kidney function is a stronger determinant of circulating TMAO than dietary intake [5] . Interestingly, hippuric acid, which derives partly from polyphenol-rich foods common in Indian cuisine (tea, turmeric, legumes), was elevated at stage 1 compared with Western reference ranges, suggesting population-specific baseline adjustments may be needed for clinical implementation.
Conclusion
Untargeted LC-MS/MS metabolomics revealed monotonic increases in seven uremic toxins across CKD stages 1-4, with gut-derived metabolites (indoxyl sulfate, p-cresol sulfate, TMAO) accumulating 39-40-fold compared with creatinine's 6.4-fold rise. A three-metabolite panel discriminated CKD stage ≥3a with AUC 0.94, sensitivity 91.1%, and specificity 88.3%. These serum biomarkers offer superior early-stage discrimination compared with creatinine alone and warrant validation in prospective, multi-centre cohorts.
Figures and tables from the paper
| Panel | AUC | Sens. (%) | Spec. (%) | PPV (%) | NPV (%) |
|---|---|---|---|---|---|
| Creatinine alone | 0.87 | 82.2 | 81.7 | 79.5 | 84.1 |
| IS + pCS | 0.91 | 87.8 | 85.0 | 83.4 | 89.0 |
| IS + pCS + TMAO | 0.94 | 91.1 | 88.3 | 86.7 | 92.2 |
| IS + pCS + TMAO + Kyn | 0.95 | 92.2 | 88.3 | 86.8 | 93.0 |
| All 7 metabolites | 0.95 | 91.1 | 90.0 | 88.6 | 92.2 |
Table text extracted from the original PDF; superscript letters are shown inline. The original table image is below.
View original table image
References
11 in the original paper- Jha V, Garcia-Garcia G, Iseki K, Li Z, Naicker S, Plattner B, et al. Chronic kidney disease: global dimension and perspectives. Lancet. 2013;382(9888):260-272.
- Stevens LA, Coresh J, Greene T, Levey AS. Assessing kidney function measured and estimated glomerular filtration rate. N Engl J Med. 2006;354(23):2473-2483.
- Vanholder R, De Smet R, Glorieux G, Argilés A, Baurmeister U, Brunet P, et al. Review on uremic toxins: classification, concentration, and interindividual variability. Kidney Int. 2003;63(5):1934-1943.
- Barreto FC, Barreto DV, Liabeuf S, Meert N, Glorieux G, Temmar M, et al. Serum indoxyl sulfate is associated with vascular disease and mortality in chronic kidney disease patients. Clin J Am Soc Nephrol. 2009;4(10):1551-1558.
- Tang WH, Wang Z, Kennedy DJ, Wu Y, Buffa JA, Agatisa-Boyle B, et al. Gut microbiota-dependent trimethylamine N-oxide pathway associated with risk of adverse cardiovascular events. N Engl J Med. 2013;368(17):1575-1584.
- Wishart DS. Metabolomics for investigating physiological and pathophysiological processes. Physiol Rev. 2019;99(4):1819-1875.
- Zhao YY. Metabolomics in chronic kidney disease. Clin Chim Acta. 2013;422:59-69.
- Evenepoel P, Meijers BK, Bammens BR, Verbeke K. Uremic toxins originating from colonic microbial metabolism. Kidney Int Suppl. 2009;76(114):S12-S19.
- Poesen R, Claes K, Evenepoel P, de Loor H, Augustijns P, Kuypers D, et al. Microbiota-derived phenylacetylglutamine associates with overall mortality in patients undergoing hemodialysis. Clin J Am Soc Nephrol. 2016;11(7):1163-1172.
- Chen DQ, Cao G, Chen H, Arber CP, Liu D, et al. Identification of serum metabolites associating with chronic kidney disease progression and anti-fibrotic effect of 5-methoxytryptophan. Nat Commun. 2019;10(1):1476.
- Meijers BK, De Loor H, Bammens B, Verbeke K, Vanrenterghem Y, Evenepoel P. p-Cresyl sulfate and indoxyl sulfate in hemodialysis patients. Clin J Am Soc Nephrol. 2009;4(12):1932-1938.