
Research article · 2026 · Full text
International Journal of Geography Geology and EnvironmentAssessment of agricultural production dynamics in Bhiwani district: A spatio-temporal study of Rabi and kharif crops
Volume 8(3) · Pages 62–70 · DOI: 10.22271/27067483.2026.v8.i3a.495 ↗
Research areasAgricultural Economics and PracticesClimate change impacts on agricultureSocial and Economic Development in India
Abstract
Author-writtenThis study examines the agricultural production dynamics in Bhiwani district through a spatio-temporal analysis of Rabi and Kharif crops. The research focuses on understanding variations in cropping patterns, productivity, and seasonal shifts over time. Secondary data from government agricultural reports and district statistical records were analyzed to identify trends in major crops such as wheat, mustard, bajra, and cotton. The findings reveal significant spatial disparities in crop productivity influenced by factors such as irrigation availability, soil characteristics, and climatic variability. Temporal analysis indicates a gradual shift towards water-efficient crops due to declining groundwater levels and changing rainfall patterns. The study also highlights the impact of technological interventions and policy support on improving crop yield. Overall, the research provides valuable insights into regional agricultural transformation and suggests the need for sustainable practices and resource management to ensure long-term agricultural productivity in the district.
Summary
Source-checkedPlain-language reading of the full paper, prepared with AI and checked against the text. Each point links to the authors' own words.
Why it matters
- Agriculture is a central part of the economy in the Bhiwani district of Haryana. View evidence ↗
- Because rainfall is limited, the region's farming relies heavily on irrigation from canals, tube wells, and open wells. View evidence ↗
- Changing rainfall and falling groundwater levels have led to a gradual transition toward crops that use water more efficiently. View evidence ↗
The question
- The study aims to identify trends in crop performance and evaluate how fertilizers and pesticides affect agricultural productivity. View evidence ↗
What they did
- The research analyzed agricultural production in the Bhiwani district over a ten-year period from 2001 to 2011. View evidence ↗
- The study used secondary data primarily from the 'Statistical Abstract of Haryana,' supplemented by other government reports and private databases. View evidence ↗
- Researchers used Mean, Standard Deviation, Compound Annual Growth Rate (CAGR), and Percentage Change to analyze production patterns. View evidence ↗
What they found
- Wheat production showed robust growth with a Compound Annual Growth Rate (CAGR) of 6.41% and a total increase of 74.88%. View evidence ↗
- Rapeseed and mustard production increased by 30.05%, driven largely by a 26.28% increase in yield. View evidence ↗
- Gram cultivation saw a significant reduction in land use (down 17.0%), which led to a 4.35% decrease in total production. View evidence ↗
- Rice production grew by 109.52% due to a massive 187.17% expansion in area, despite a 27.21% decline in yield. View evidence ↗
- Cotton production increased by 32.50% despite a 46.06% drop in area, because yields increased dramatically by 145.16%. View evidence ↗
- Across all studied crops, there is an increasing reliance on chemical fertilizers. View evidence ↗
What it means
- The authors conclude that while productivity has grown, there are widening disparities between crop groups and rising environmental risks, necessitating policies for sustainable intensification. View evidence ↗
Visual summary
2 visualsIllustrations explain the paper; charts are replotted from the paper's own table values.
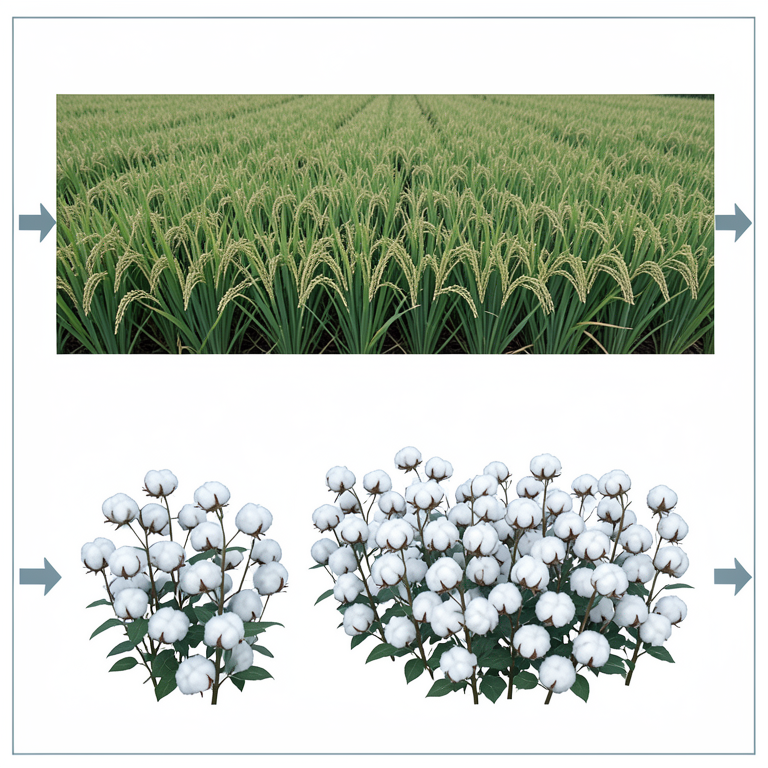
Contrasting Growth Drivers
AI-generated conceptual illustration (Rice and cotton plants in agricultural fields). It explains the idea and does not show study data.
View source evidence ↗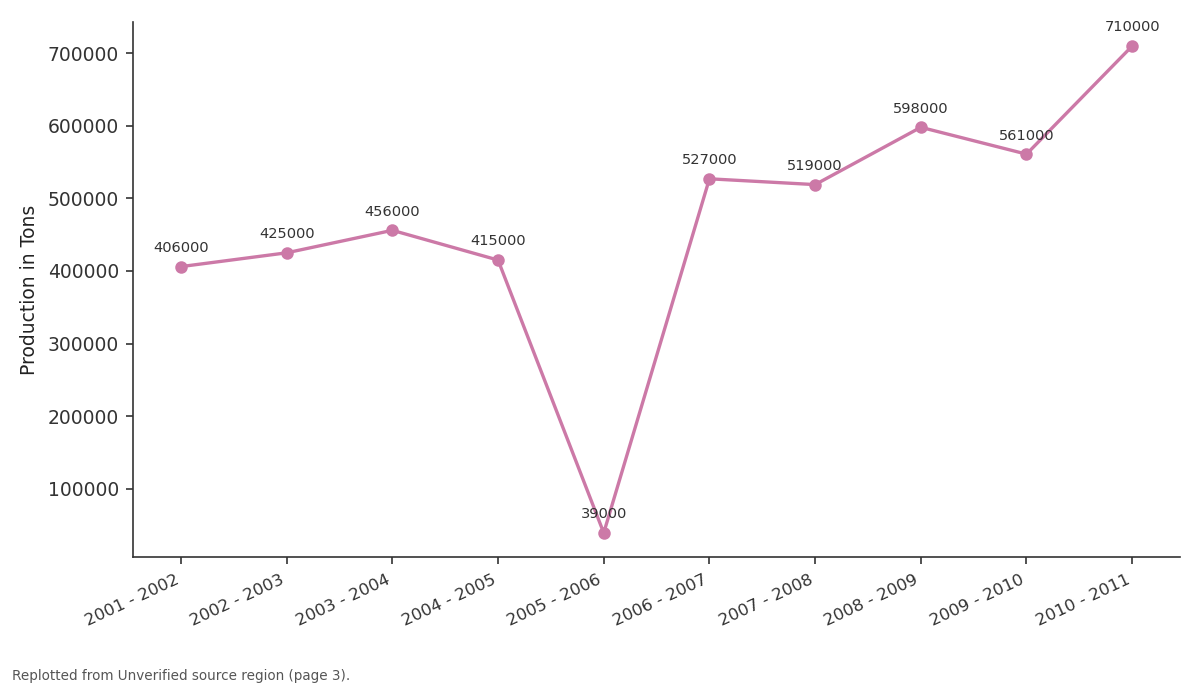
Production in Tons: 2001 - 2002 vs 2002 - 2003 vs 2003 - 2004 vs 2004 - 2005 vs 2005 - 2006
Replotted from a table (page 3) of the original paper. Every bar is the paper's own table value.
View source evidence ↗Introduction
This study examines the spatio-temporal dynamics of agricultural production in the Bhiwani district of Haryana over a ten-year period, spanning from 2001 to 2011. Agriculture plays a pivotal role in the district's economy, and this analysis focuses on major crops such as wheat, gram, cotton, rice, rapeseed and mustard, and bajra in terms of their area, production, and yield. The primary objective of this study is to understand the changes and trends in crop performance over time, as well as to assess the impact of agricultural inputs such as fertilizers and pesticides on productivity. The principal aim of this study is to analyze patterns of crop production using statistical techniques and methods, including the Mean, Standard Deviation, Compound Annual Growth Rate (CAGR), and Percentage Change. These methods facilitate the identification of trends in agricultural performance, patterns of agricultural growth, and variability observed during this specific time frame. Furthermore, this study endeavors to evaluate the impact of fertilizers and pesticides on the production and yield of these crops, thereby highlighting their contribution to the enhancement of productivity. The study uses secondary data collected from various reliable and authentic sources. The primary source of data is the 'Statistical Abstract of Haryana,' published by the Department of Economic and Statistical Affairs, Government of Haryana; this abstract provides detailed, district-wise agricultural statistics. Additional data has been sourced from the 'Economic Survey of Haryana,' reports from the Department of Agriculture and Farmers Welfare, and the 'Agriculture Census of India.' Additionally, private secondary databases such as India stat were utilized for data collection to ensure the consistency and reliability of the data throughout the entire study period. This study employs quantitative techniques and methods to analyze the changes observed in the area, production, and yield of the selected crops. Mean values are utilized to determine the average performance of crops, while Standard Deviation measures the extent of variability and instability. The Compound Annual Growth Rate (CAGR) is applied to assess long-term growth trends, and percentage change is used to illustrate variations occurring between different time periods.
The findings of the study indicate that, by using improved irrigation facilities and technological advancements, there has been a continuous increase in the production, and yield of wheat, as well as rapeseed and mustard. Cotton production demonstrates moderate growth alongside inherent variability, while rice cultivation remains confined primarily to irrigated areas. Regional disparities within the district are clearly evident, influenced predominantly by irrigation availability and soil conditions. Overall, this study highlights significant shifts in cropping patterns and productivity, while simultaneously emphasizing the imperative for sustainable agricultural practices in light of environmental and resource-related constraints.
Objectives
• To analyze the temporal changes in area, production, and yield of major crops wheat, gram, cotton, rice, rapeseed and mustard, and bajra in Bhiwani district. • To examine growth trends and variability in agricultural production using statistical techniques such as mean, standard deviation, compound annual growth rate (CAGR), and percentage change. • To assess the impact of agricultural inputs, particularly fertilizers and pesticides, on the productivity and yield of selected crops.
• To analyze temporal changes in agricultural production (2001-2011) • To study cropping pattern changes • To identify factors influencing agricultural production
• To analyze temporal changes in agricultural production (2001-2011) • To study cropping pattern changes • To identify factors influencing agricultural production
Study Area Profile: Bhiwani District
Bhiwani district is situated in the southwestern part of Haryana and ranks as one of the largest districts in the state in terms of geographical area. It lies approximately between 28°19' and 29°05' North latitude and 75°26' and 76°28' East longitude. The district shares its borders with Hisar district to the north, Charkhi Dadri district to the east, Mahendragarh district to the south, and the state of Rajasthan to the west. Due to its geographical location, Bhiwani serves as a transitional zone between the fertile plains of Haryana and the arid regions of Rajasthan. Physically, the district is characterized by a semi-arid landscape comprising sandy plains, stabilized sand dunes, and scattered rocky formations representing remnants of the Aravalli Hills. The general slope of the land is from the northeast towards the southwest. The soil here ranges primarily from sandy to loamy-sandy; it is low in organic matter but is well-suited for drought-resistant crops such as bajra and gram. In certain irrigated areas, soils support crops like wheat and mustard. The climate of Bhiwani district is generally semi-arid, marked by significant seasonal variations. Summers are extremely hot, with temperatures frequently soaring above 45 °C, while winters can be quite cold, with temperatures dropping below 5 °C. Rainfall in the district is scanty and erratic, averaging approximately 300-400 mm per year; the majority of this precipitation occurs during the southwest monsoon season (July to September). These climatic conditions significantly influence agricultural practices and crop selection within the district. Agriculture constitutes the primary economic activity of the district, providing employment to a large segment of the population. However, due to limited rainfall, agriculture is largely dependent on irrigation. The primary sources of irrigation include canals, tube wells, and open wells. Over the past few years, the expansion of irrigation facilities has led to a shift in cropping patterns; there is now a gradual transition away from traditional, rain-fed crops toward more remunerative and irrigated crops. The major crops cultivated in the district include wheat, bajra, gram, cotton, rice, and mustard. Crops such as bajra and gram are traditionally grown in rain-fed areas due to their drought-tolerant nature, whereas crops like wheat and mustard are predominantly cultivated in irrigated regions. Cotton cultivation is undertaken in areas with suitable soil and climatic conditions, while rice cultivation is restricted solely to regions possessing assured irrigation systems. Administratively, the district is divided into several tehsils and blocks, which exhibit variations in agricultural development and productivity. Areas endowed with superior irrigation infrastructure and fertile soil yield higher agricultural output compared to less developed regions. Overall, the Bhiwani district presents a diverse agricultural landscape, shaped by its semi-arid environment, resource availability, and technological advancements. These characteristics make it a significant case study for analyzing spatio-temporal variations in agricultural production.
Database and Methodology Data Sources
This study is based on secondary data collected from various reliable and authentic sources. Its primary source is the 'Statistical Abstract of Haryana,' published by the Department of Economic and Statistical Affairs, Government of Haryana; this document provides comprehensive district-level data regarding the area, production, and yield of major crops. Additional data has been obtained from the 'District Statistical Handbook,' which presents detailed local-level agricultural statistics. Reports from the Department of Agriculture and Farmers Welfare were also utilized to gather information concerning crop production, fertilizer consumption, and pesticide usage. Furthermore, data derived from the 'Census of India' and private databases such as India stat were employed to supplement and cross-verify the information, thereby ensuring the accuracy and consistency of the data throughout the study period (2001)(2002)(2003)(2004)(2005)(2006)(2007)(2008)(2009)(2010)(2011).
Methods Used
This study employs quantitative and statistical methods to analyze spatio-temporal variations in agricultural production. Tabulation and classification techniques are utilized to systematically organize the collected data. The Mean method is applied to determine the average area, production, and yield of the selected crops. Standard deviation is used to measure variability and instability over time. The Compound Annual Growth Rate (CAGR) method is employed to assess long-term growth trends in agricultural production. Percentage change is calculated to examine variations across different time periods. Additionally, graphs and charts are used to analyze trends and to visually represent the changes in agricultural practices that occurred during the study period. The mean, or arithmetic average, is a fundamental statistical measure used to represent the central tendency of a dataset. It is calculated by summing all observations and dividing the result by the total number of observations. In dataset, the mean provides a single representative value for each variable over a ten-year period, thereby helping us understand the overall level of agricultural performance. For instance, an average production of 465600 tons indicates the typical production level across the years, while an average yield of 3.31 reflects the general productivity. Similarly, the mean values for fertilizer and pesticide represent the average input usage per acre. However, the mean is sensitive to extreme values, known as 'outliers.' In this dataset, the unusually low production in 2005-06 (39000 tons) significantly lowers the average production value, rendering it less representative of typical years. Despite this limitation, the mean remains extremely useful for making comparisons across different variables and time periods, assisting policymakers and analysts in understanding general trends. It also serves as a baseline for further statistical analysis, such as calculating variability or growth rates. In agricultural studies, the mean helps identify whether input usage (such as fertilizer) is increasing and whether production levels are improving. However, to fully understand the variability within the data, the mean should always be interpreted in conjunction with measures such as the standard deviation. Overall, the mean provides a simple yet powerful summary of a dataset; however, it should be used with caution when significant fluctuations or anomalous values are present. The Compound Annual Growth Rate (CAGR) is a useful method that shows the average annual growth rate of a variable over a specific time period, assuming that growth compounds each year. Unlike a simple average, CAGR shows year-to-year fluctuations and provides a clearer picture of long-term trends. In the dataset, production exhibits the highest CAGR of 6.41%, signaling robust overall growth in output during this period. The area under cultivation grew at a slower rate of 2.86%, suggesting that the increase in production does not solely depend on land expansion but also on improvements in productivity. This pattern is shown by yield CAGR of 3.46%, which reflects enhanced efficiency in agricultural practices. Fertilizer usage also increased significantly at an annual rate of 5.21%. Conversely, pesticide consumption shows a slightly negative CAGR (-0.47%), suggesting either improved pest management practices or a decline in reliance on pesticides over time. The percentage change method complements the CAGR, as it illustrates the total change between the initial and final years without any smoothing. Production increased by 74.88%, which is substantial and consistent with its high CAGR. Similarly, fertilizer usage rose by approximately 58%, indicating an increase in input intensity. Yield improved by about 36%, confirming an increase in productivity. The area under cultivation expanded by approximately 29%, reflecting a moderate increase in land utilization. However, there was a marginal decline of 4.17% in pesticide usage, which reinforces the notion of stabilization or improved efficiency. The mean, or arithmetic average, represents the central tendency of a dataset and is calculated by dividing the sum of all observations by the total number of observations. In this rapeseed and mustard dataset, the mean provides a holistic overview of agricultural performance over a tenyear period. The average area under cultivation stands at approximately 153001 hectares, indicating the typical land allocation for this crop. Similarly, an average production of 203700 tons reflects the standard production level. An average yield of 1.34 suggests moderate productivity over the years, while fertilizer usage (72.57 kg/acre) indicates the level of input intensity. However, the mean is sensitive to fluctuations and extreme values. For instance, variations in production over the years can influence the average, rendering it less representative of any single specific year. Nevertheless, the mean remains an invaluable tool for comparing variables and identifying general trends over time. In agricultural analysis, the mean is frequently utilized as a benchmark for performance and to assess whether improvements are required. However, as it does not capture variability or risk, it should be interpreted in conjunction with other statistical measures, such as the standard deviation. Total percentage change measures the overall variation that occurred between the first and last years of a dataset. It is calculated by dividing the difference between the final and initial values by the initial value, and then multiplying the result by 100. In this dataset, production increased by 30.05%, indicating a significant rise in output during this period. Yield also rose by 26.28%, suggesting that improvements in productivity played a pivotal role in boosting production. The area under cultivation saw only a marginal increase (3.26%), confirming that land expansion was not the primary driver of this growth. This method provides a simple and clear measure of overall progress. In this instance, the results indicate that improvements in productivity and increased fertilizer usage were the primary contributors to the growth observed. The Mean represents the average value of each variable over a ten-year period, providing a general overview of rice cultivation practices and outcomes. The average area under rice cultivation stood at 13778 hectares, indicating a moderate yet consistent increase in land allocation throughout this decade. An average production of 30100 tons reflects the combined effect of expanding acreage and fluctuating yield levels. An average yield of 2.24 suggests that rice productivity remained significantly higher compared to pulse cropsa finding consistent with the fact that rice is an input-intensive crop. These average values serve as useful benchmarks for evaluating long-term performance and for comparing rice cultivation with other crops or regions. The Compound Annual Growth Rate (CAGR) measures the average annual rate of change over an entire period, thereby mitigating the impact of short-term fluctuations. The area under rice cultivation recorded a robust positive CAGR of 12.44%, signaling a rapid expansion in the land allocated for rice farming. Production also witnessed a significant increase, registering a CAGR of 8.57%; this reflects the combined effects of both area expansion and improved management practices. However, yield exhibits a negative CAGR of -3.47%, indicating a gradual decline in per-unit-area productivity over time. This suggests that the growth in production was driven primarily by area expansion rather than improvements in yielda trend that could raise concerns regarding sustainability. CAGR presents a clear picture of long-term structural trends. In this specific instance, while the area under rice cultivation and overall production expanded rapidly, the decline in yield signals a need for measures focused on productivity such as the adoption of improved crop varieties and enhanced water management techniques. The 'Mean' value represents the average level of each variable over a ten-year period, providing a comprehensive picture of the trends in cotton cultivation. The average land area dedicated to cotton cultivation stood at 50820 hectares, indicating a decline despite a significant expansion of the overall land base during this decade. Notwithstanding this reduction in land area, average production remained high at 103600 tons, demonstrating cotton's robust yield potential and its positive responsiveness to improved cultivation practices. An average yield of 2.16 indicates that cotton productivity was comparatively high and witnessed consistent improvement over time.
Analysis of
Analysis of
Standard Deviation
Standard Deviation
Rapeseed and Mustard Mean Method Analysis
Rapeseed and Mustard Mean Method Analysis
Standard Deviation
Standard Deviation
Gram Mean
Gram Mean
Standard Deviation
Standard Deviation
Percentage Change
Patterns of input usage reveal that cotton cultivation involved a significantly high level of input application. The average values demonstrate that, despite the reduction in cultivated land, cotton production remained economically significanta result primarily driven by improvements in productivity. Standard deviation measures variability around the mean and indicates the extent to which variables associated with cotton cultivation remained stable or unstable during the study period. The cultivable area exhibits a high standard deviation of 15979 hectares, reflecting a significant year-onyear decline in the area under cotton cultivation. This decline may be attributed to price fluctuations, pest infestations, or a shift in preference toward alternative crops. Production also demonstrates high variability, with a standard deviation of 29125 tons, indicating sensitivity to both fluctuations in yield and market-driven adjustments in acreage.
Standard Deviation
Variability in yield characterized by a standard deviation of 0.60 suggests a notable improvement over time rather than mere random fluctuations, thereby signaling a structural growth in productivity. The high variability observed in acreage and production underscores the inherently risky nature of cotton cultivation, whereas the moderate variability in yield reflects the impact of technological advancements. Thus, standard deviation serves to identify cotton as a high-risk, high-return crop that necessitates meticulous management.
Compound Annual Growth Rate (CAGR)
Variable CAGR (%) Area (Hectares) -6.63 Production (Tons) 3.18 Yield 10.48
The Compound Annual Growth Rate (CAGR) illustrates long-term growth trends by smoothing out short-term fluctuations. The area under cotton cultivation recorded a negative CAGR of -6.63%, signaling a rapid and consistent decline in the land allocated for cotton farming. Despite this reduction, production grew at a positive CAGR of 3.18%, indicating that improvements in yield more than compensated for the diminished acreage. This is further corroborated by a robust yield CAGR of 10.48%, which highlights significant technological advancements likely driven by superior seed varieties and improved agricultural practices.
The CAGR analysis clearly demonstrates that the growth in cotton production was primarily driven by gains in productivity rather than by an expansion of the cultivated area, pointing to the success of intensification strategies. The percentage change compares the first and last years of the period to show the net transformation over this time period. Cotton area declined sharply by 46.06%, confirming a major structural contraction in cultivated land. Despite this, production increased by 32.50%, demonstrating the strong compensatory effect of rising yields. Yield increased dramatically by 145.16%, highlighting substantial productivity gains over the period. Standard deviation measures the extent to which data points deviate from the mean, thereby providing insights into their uniformity and stability. In this dataset, the standard deviation of the area under cultivation is relatively low (15000 hectares), indicating that land utilization for millet farming has remained largely stable over the past few years. This suggests that farmers have neither significantly expanded nor drastically reduced the cultivated area, pointing towards consistent farming practices. However, the standard deviation in production is considerably high (60000 tons), signaling significant fluctuations. This implies that production levels were influenced by factors such as variations in rainfall, pest infestations, or farming techniques. Despite the stability in the cultivated area, substantial variations in production were observed, underscoring the critical importance of yield and external environmental conditions. The standard deviation for yield is moderate (0.32), suggesting that productivity has experienced notable variations over the past few years. This variability further reinforces the notion that environmental factors and the efficient utilization of resources have played a pivotal role in determining production outcomes.
Percentage Change
Percentage Change
Bajra Mean
The standard deviation analysis reveals that while land utilization and pesticide usage remained stable, production and fertilizer usage exhibited greater volatility. This suggests that improvements in productivity have not been CAGR measures the average annual growth rate over a specific time period, assuming that growth has been steady. It is particularly useful for understanding long-term trends rather than year-to-year fluctuations. In this dataset, the area under millet cultivation grew at a modest CAGR of 1.26%, indicating a gradual expansion in land use. This slow growth suggests that millet remained a stable crop, but did not undergo rapid expansion. Production exhibits a higher CAGR of 3.30%, implying that the increase in output occurred at a faster pace than the expansion of the cultivated area. This signals an improvement in productivity, likely driven by better agricultural practices, improved seeds, or increased use of agricultural inputs. The 'Yield,' growing at an annual rate of 2.00%, corroborates this trend, demonstrating that gains in efficiency contributed to the higher production levels.
The CAGR analysis reveals that millet cultivation experienced steady growth, driven primarily by increased productivity rather than an expansion of the cultivated area. The robust growth in fertilizer usage highlights a shift toward 'input-intensive agriculture,' while the decline in pesticide usage may indicate improvements in efficiency.
Percentage Change
Variable Percentage Change Area (Hectares) +11.90% Production (Tons) +34.10% Yield +19.90%
The percentage change provides a direct comparison between the first and final years, thereby revealing the cumulative growth that occurred over the entire period. In this dataset, the cultivated area expanded by 11.9%, indicating a moderate expansion in millet cultivation. This suggests that while the crop remained significant, there was no drastic shift in land allocation. Production witnessed a remarkable increase of 34.1%, a figure significantly higher than the growth observed in the cultivated area. This indicates that the majority of the production growth was driven by improved productivity rather than mere expansion. Yields also rose by 19.9%, further corroborating this conclusion. This increase in yield reflects the adoption of better agricultural practices, superior inputs, or favorable environmental conditions over time.
The percentage change presents a clear 'before-and-after' comparison, making it easier to comprehend the overall progress achieved. In this instance, it demonstrates that during this decade, millet cultivation became more productive and input-intensive. This combination of increased fertilizer usage and improved yields points toward advancements in technology or management practices. However, the relatively modest growth in the cultivated area suggests that growth was driven more by efficiency than by expansiona positive sign for sustainable agricultural development.
Conclusion
An analysis of wheat, rapeseed and mustard, gram, rice, cotton, and bajra utilizing statistical measures such as mean, standard deviation, Compound Annual Growth Rate (CAGR), and total percentage change along with trends in fertilizer and pesticide usage, presents a clear picture of the structural changes, intensification, and emerging sustainability concerns within the agricultural system during the study period. The mean values indicate that wheat and rice dominate the agricultural landscape in terms of average area and production; this reflects their role as staple food crops, supported by irrigation, procurement policies, and input availability. Rapeseed and mustard occupy an intermediate position, signifying their growing importance as oilseed crops, while gram and bajra exhibit lower average yields and productiona characteristic of pulses and coarse cereals, which are primarily cultivated under rain-fed conditions. Despite a decline in average area compared to cereals, cotton demonstrates relatively high average yields and production, underscoring its commercial nature and its responsiveness to technology and inputs. Across all crops, the average usage of fertilizers remains consistently high and on an upward trajectory, signaling a system that is becoming increasingly dependent on chemical nutrients; conversely, the average usage of pesticides remains comparatively low and stable, suggesting either controlled pest pressure or improved pest management practices. The results of the standard deviation analysis highlight distinct differences in the stability of various crops. Wheat and rice typically exhibit low variability in yield and production, reflecting relatively stable performance driven by assured irrigation, improved varieties, and institutional support. Conversely, gram and pearl millet demonstrate higher variability particularly in production and yield reflecting their sensitivity to rainfall fluctuations, soil moisture deficits, and the limited adoption of modern inputs. Cotton exhibits high variability in both area under cultivation and production, driven by market price volatility, pest outbreaks, and shifting profitability; however, variability in its yield remains relatively low due to technological advancements. Rapeseed and mustard occupy an intermediate position, displaying moderate variability that reflects their sensitivity to climatic conditions while also indicating increasing stability driven by technological and policy support. Fertilizer usage across crops shows relatively high variability particularly in rice and cotton signaling intense intensification and evolving nutrient management strategies; conversely, pesticide usage exhibits lower variability, reflecting a more uniform and cautious approach toward pest control across these crops. CAGR analysis provides deep insights into long-term growth dynamics. Wheat typically records a modest positive CAGR in both yield and production, signaling gradual growth driven primarily by productivity gains rather than by an expansion in the area under cultivation. Rice demonstrates a strong positive CAGR in both area and production; however, in some instances, yield growth has been weak or even negative, implying that production growth has been driven more by area expansion than by efficiency gains. Gram and pearl millet exhibit stagnant or negative CAGRs in terms of area and production, yet show modest positive growth in yield; this indicates that the importance of these crops in land allocation is steadily diminishing, and that productivity gains are insufficient to reverse this declining significance. Cotton presents a contrasting pattern: a strong negative CAGR in area, coupled with a high positive CAGR in yield and a positive CAGR in productiona trend that clearly reflects a shift toward high-productivity, input-intensive farming on a shrinking land base. Rapeseed and mustard typically exhibit positive CAGRs in both yield and production, reflecting the growing demand for edible oils as well as successful technological interventions. Across all crops, fertilizer usage demonstrates a consistently positive CAGR often outpacing the yield growth rate signaling an increasing reliance on chemical inputs; conversely, pesticide usage generally shows a low or negative CAGR, suggesting improvements in efficiency or substitution through superior crop varieties and Integrated Pest Management. Percentage change analysis corroborates these trends by highlighting the magnitude of the changes that have occurred over the decade. A notable increase has been recorded in the production and fertilizer usage of wheat and rice, confirming the prevalence of intensive farming practices. In particular, there has been a dramatic expansion in both the area under cultivation and the production of rice.
The area under gram cultivation has witnessed a significant decline, while yields have seen only a marginal increase, resulting in limited overall production growth. This raises concerns regarding the long-term sustainability of pulse availability. The results for millet have been mixed; while there has been limited improvement in production, the crop remains vulnerable to climate-related risks. The area under cotton cultivation has contracted sharply; however, yields have risen exceptionally, leading to a significant increase in productiona testament to the success of technologydriven intensive farming. Both the production and yield of rapeseed and mustard have shown positive changes, aligning with national efforts to reduce edible oil imports. Across all crops, a percentage increase in fertilizer usage has been observed, whereas pesticide usage has either remained stable or declined slightly. This reinforces the conclusion that yield growth has been achieved primarily through nutrient intensification rather than through increased reliance on chemical pest control.
A comparative analysis of crops and inputs reveals a distinct shift within the agricultural system toward input-intensive, productivity driven growth particularly in the cases of wheat, rice, cotton, and oilseeds. Conversely, pulses as well as coarse cereals such as gram and bajra are lagging behind in terms of both stability and growth. The increasing reliance on fertilizers across all crops coupled with the relatively stable usage of pesticides signals partial technological progress; however, it simultaneously raises concerns regarding soil health, environmental sustainability, and diminishing marginal returns on input usage. In conclusion, while statistical evidence points to the success of productivity growth across various crops, it also highlights widening disparities among crop groups and escalating environmental risks, thereby underscoring the need for balanced policies that foster sustainable intensification, stabilize rain-fed crops, and ensure longterm food and nutritional security.
References
30 in the original paper- FAOSTAT. FAO statistical database. Rome: Food and Agriculture Organization; 2021.
- World Bank. Agriculture and food overview. Washington DC: World Bank; 2020.
- OECD. Innovation, productivity and sustainability in agriculture. Paris: OECD Publishing; 2019.
- Government of India. Agricultural statistics at a glance. New Delhi: Ministry of Agriculture; 2018.
- Singh R, Kumar P. Agricultural growth and productivity. Agric Econ Res Rev. 2018;31(1):1-10.
- FAO. The future of food and agriculture: trends and challenges. Rome: FAO; 2017.
- Chand R, Raju SS, Pandey LM. Growth crisis in agriculture. Econ Polit Wkly. 2007;42(26):2528-2533.
- Sharma VP. Growth and instability in Indian agriculture. Indian J Agric Econ. 2016;71(3):1-15.
- Gulati A, Saini S. Indian agriculture: unfolding structural changes. New Delhi: Springer; 2015.
- Birthal PS, Negi DS. Livestock and crop productivity. Agric Econ Res Rev. 2012;25(2):209-216.
- Pingali PL. Green revolution: impacts and future. Proc Natl Acad Sci USA. 2012;109(31):12302-12308.
- Kumar A, Sharma P, Joshi PK. Demand and supply trends. Agric Econ. 2012;43(3):257-269.
- Kumar P, Kumar A, Parappurathu S. Agricultural productivity trends. Agric Econ Res Rev. 2011;24:4358.
- Bhalla GS, Singh G. Economic liberalization and Indian agriculture. New Delhi: Sage Publications; 2009.
- Chand S, Raju SS. Instability in agricultural production. Agric Econ Res Rev. 2009;22:457-466.
- Gujarati DN, Porter DC. Basic econometrics. 5th ed. New York: McGraw-Hill; 2009.
- Joshi PK, Birthal PS, Minot N. Sources of agricultural growth in India. Agric Econ. 2006;34(3):211-221.
- Rao CHH. Agriculture, food security, poverty and environment. New Delhi: Oxford University Press; 2005.
- Birthal PS, Joshi PK, Gulati A. Vertical coordination in high-value commodities. Food Policy. 2005;30(3):251269.
- Joshi PK, Gulati A, Birthal PS, Tewari L. Agriculture diversification. Econ Polit Wkly. 2004;39(24):24572467.
- Evenson RE, Gollin D. Green revolution impact. Science. 2003;300(5620):758-762.
- Desai BM, Namboodiri NV. Agricultural productivity in India. New Delhi: Oxford University Press; 1997.
- Ramasamy C. Productivity factors. Indian J Agric Econ. 1995;50(4):678-689.
- Vaidyanathan A. Performance of Indian agriculture. New Delhi: Oxford University Press; 1994.
- Dillon JL, Hardaker JB. Farm management research. Rome: FAO; 1993.
- Timmer CP. Agricultural transformation. In: Handbook of development economics. Vol. 1. Amsterdam: Elsevier; 1988. p.275-331.
- Hazell PBR, Norton RD. Mathematical programming in agriculture. London: Macmillan; 1986.
- Heady EO, Dillon JL. Agricultural production functions. Ames: Iowa State University Press; 1961.
- Narayanamoorthy A. Fertilizer consumption trends. Agric Econ Res Rev. 2007;20:83-98.
- Sharma VP. Growth and instability in Indian agriculture. Indian J Agric Econ. 2016.