
Research article · 2026 · Full text
International Journal of Geography Geology and EnvironmentClimate vulnerability assessment of vegetation under rainfall variability in Andhra Pradesh using satellite time series data (2015-2025)
Volume 8(3) · Pages 71–84 · DOI: 10.22271/27067483.2026.v8.i3a.496 ↗
Research areasRemote Sensing in AgricultureHydrology and Drought AnalysisClimate change impacts on agriculture
Abstract
Author-writtenVegetation patterns change with climate conditions. Rainfall variability is especially important in regions that depend on the monsoon. This study examines how rainfall changes affect vegetation across the state of Andhra Pradesh, India, from 2015 to 2025. Satellite data were used to study both vegetation condition and rainfall distribution. Vegetation status was analysed using the MODIS Normalized Difference Vegetation Index (NDVI) dataset. Rainfall information was obtained from the Climate Hazards Group InfraRed Precipitation with Station data (CHIRPS) dataset. All data processing and analysis were carried out on the Google Earth Engine platform. Annual NDVI composites were prepared to study patterns of vegetation greenness. Changes in rainfall and rainfall anomalies were examined to identify climate fluctuations across the region. Long-term vegetation trends were analysed using linear regression, the Mann-Kendall non-parametric test, and Sen’s slope estimation. Vegetation health was evaluated through the Vegetation Condition Index. Pearson correlation analysis was also applied to explore the link between rainfall and vegetation greenness. Finally, a Climate Vulnerability Index was created by combining vegetation trends, rainfall trends, and vegetation condition indicators. The results show moderate spatial differences in rainfall across Andhra Pradesh. Coastal districts receive more rainfall than the semi-arid districts of the Rayalaseema region. NDVI values range from 0.445 to 0.529, which suggests a moderate level of vegetation cover in the state. Trend analysis shows an overall increase in vegetation, with a Mann-Kendall τ value of 0.363 and a Sen’s slope of 0.00657 per year. The NDVI-rainfall correlation indicates that vegetation growth is generally linked to rainfall availability. However, the strength of this relationship differs among districts. Vegetation Condition Index values varied between 0.43 and 0.57, which suggests moderate vegetation health. The Climate Vulnerability Index results indicate that some districts in the northern and coastal parts of Andhra Pradesh are relatively more sensitive to climate variability. In contrast, several districts in the Rayalaseema region and southern parts of the state show lower levels of vulnerability. The findings show that changes in rainfall play a key role in controlling vegetation patterns across the region. Combining satellite-based vegetation monitoring with climate analysis offers a practical way to study ecosystem resilience. This approach can also support climate adaptation planning in semi-arid agricultural areas of Andhra Pradesh, India.
Summary
Source-checkedPlain-language reading of the full paper, prepared with AI and checked against the text. Each point links to the authors' own words.
Why it matters
- Understanding vegetation response to climate shifts is critical for food security and ecological resilience in India, where approximately 60% of agriculture depends on rainfall. View evidence ↗
The question
- The study aims to conduct a comprehensive climate vulnerability assessment using a decade of satellite data to analyze how different vegetation types in Andhra Pradesh respond to rainfall fluctuations. View evidence ↗
What they did
- The research was conducted in Andhra Pradesh, India, analyzing data from the period 2015 to 2025. View evidence ↗
- The study utilized MODIS Normalized Difference Vegetation Index (NDVI) for vegetation status and the Climate Hazards Group InfraRed Precipitation with Station (CHIRPS) dataset for rainfall data. View evidence ↗
- Data processing and analysis were performed using the Google Earth Engine cloud platform. View evidence ↗
- Vegetation trends were analyzed via linear regression, the Mann-Kendall test, and Sen's slope estimation, while Pearson correlation was used to link rainfall to vegetation greenness. View evidence ↗
What they found
- Annual rainfall in the region varied between approximately 810 mm (lowest in 2016) and 1260 mm (peak in 2020). View evidence ↗
- Vegetation greenness, measured by NDVI, ranged from 0.445 to 0.529 during the study period. View evidence ↗
- The state showed a moderate positive trend in vegetation greenness, with a Mann-Kendall tau of 0.363 and an average NDVI increase of approximately 0.0066 units per year. View evidence ↗
- Vegetation health was found to be moderate across the state, with Vegetation Condition Index (VCI) values ranging from 0.43 to 0.57. View evidence ↗
- Most regions of Andhra Pradesh showed a positive correlation between rainfall and vegetation greenness, confirming rainfall's key role in productivity. View evidence ↗
- Districts in northern and coastal areas, such as Konaseema (CVI 0.507) and West Godavari (CVI 0.443), exhibited relatively higher climate vulnerability. View evidence ↗
- Lower climate vulnerability was observed in districts such as Annamayya (CVI 0.056) and Chittoor (CVI 0.059). View evidence ↗
What it means
- The authors conclude that combining satellite vegetation indices with rainfall and trend analysis is an effective framework for monitoring environmental changes and identifying vulnerable regions. View evidence ↗
- The authors state that future research should include factors like land use change, irrigation patterns, soil moisture, and temperature variability for a more comprehensive understanding. View evidence ↗
Visual summary
3 visualsIllustrations explain the paper; charts are replotted from the paper's own table values.
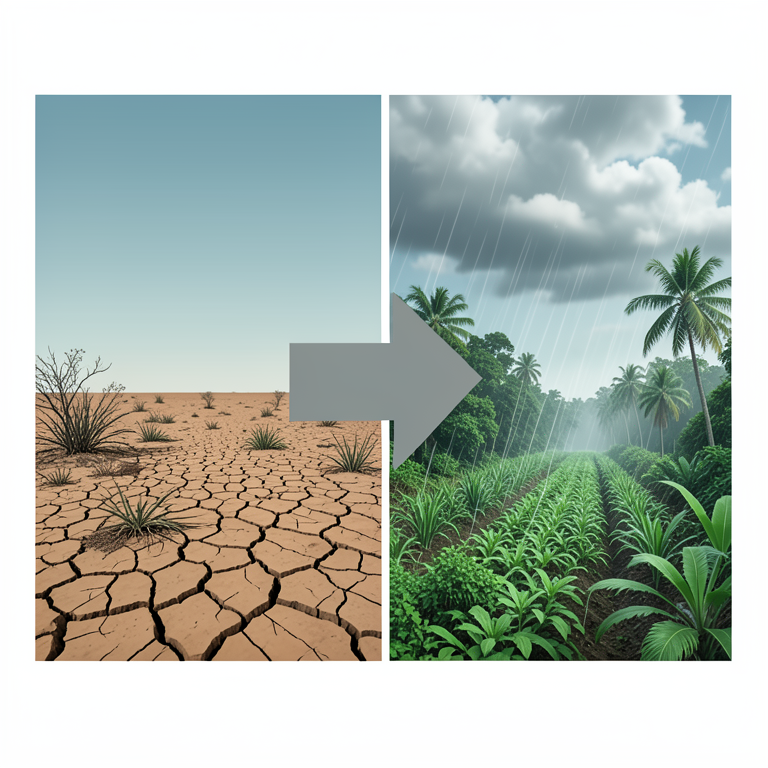
Rainfall-Vegetation Relationship
AI-generated conceptual illustration (Tropical landscape of Andhra Pradesh with mixed vegetation and agricultural fields). It explains the idea and does not show study data.
View source evidence ↗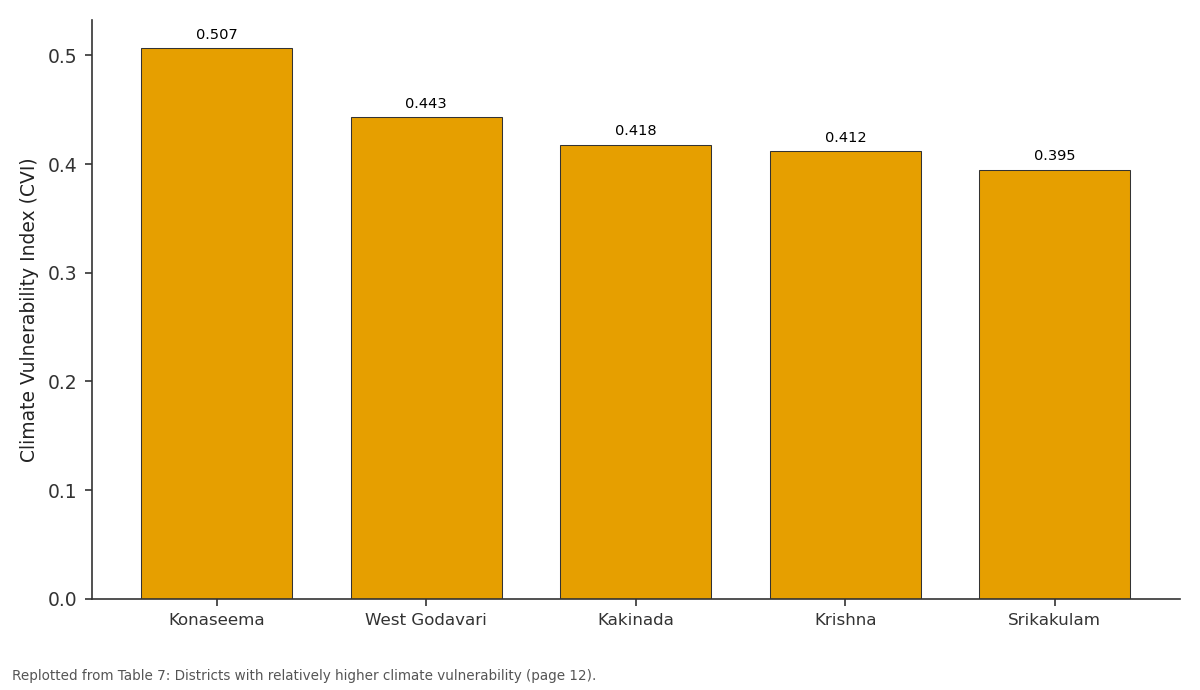
CVI: Konaseema vs West Godavari vs Kakinada vs Krishna vs Srikakulam
Replotted from Table 7 (page 12) of the original paper. Every bar is the paper's own table value.
View source evidence ↗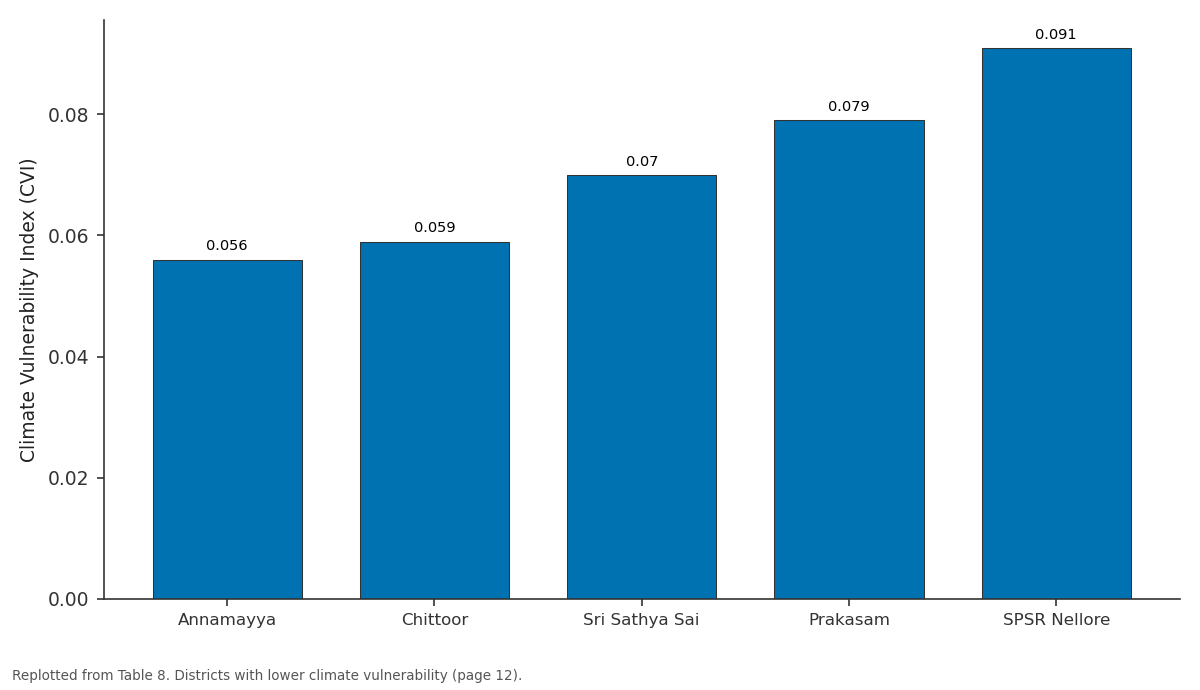
CVI: Annamayya vs Chittoor vs Sri Sathya Sai vs Prakasam vs SPSR Nellore
Replotted from Table 8 (page 12) of the original paper. Every bar is the paper's own table value.
View source evidence ↗Figures & tables
From the original paper Table 1Page 3
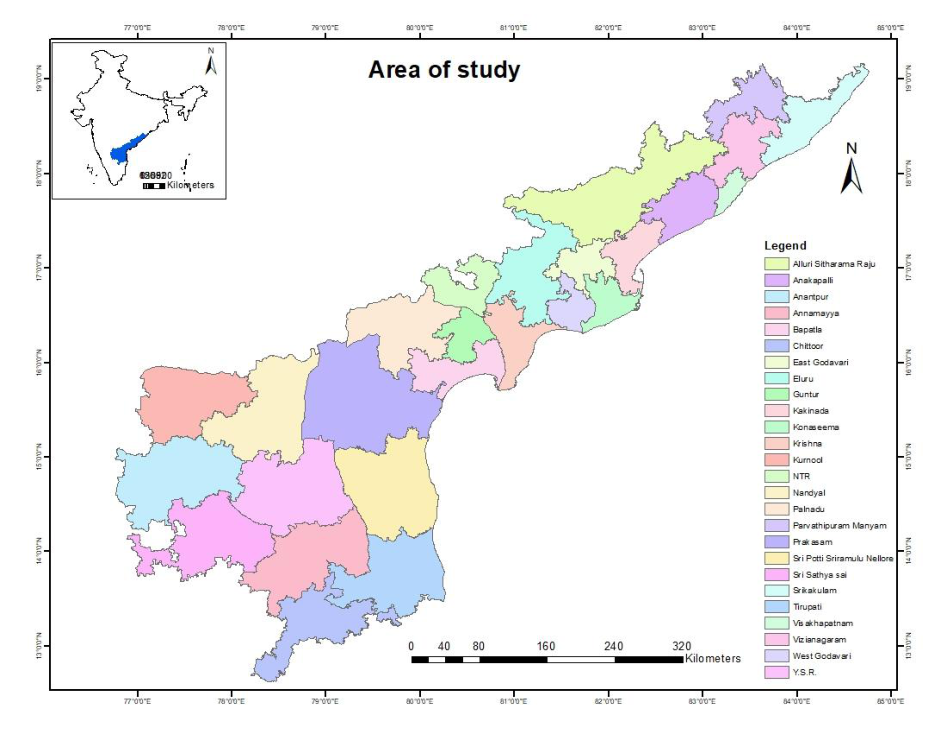 Figure 1Page 3
 Table 3Page 4
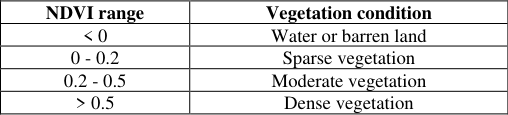 Table 2Page 4
 Table 4Page 5
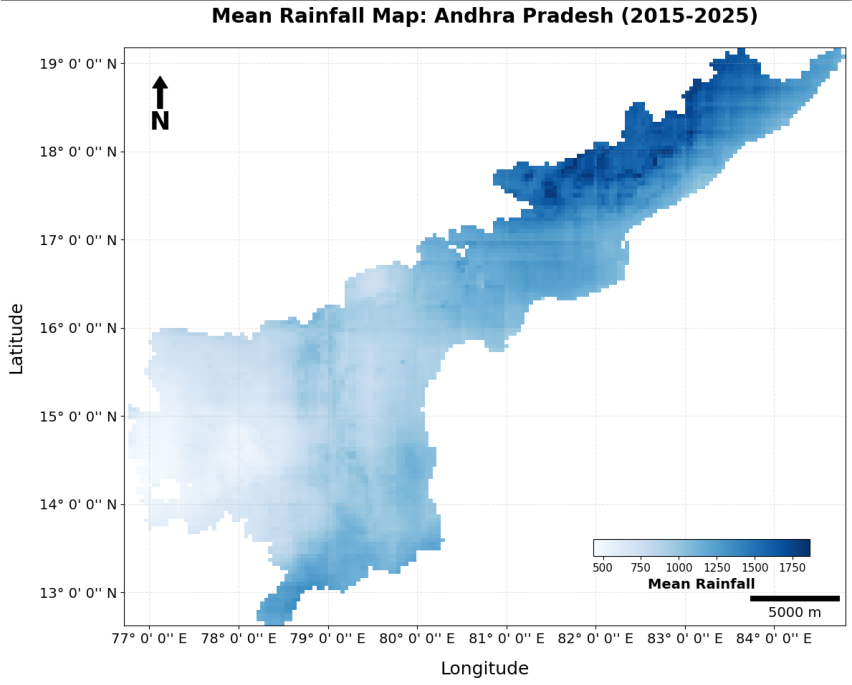 Figure 2Page 6
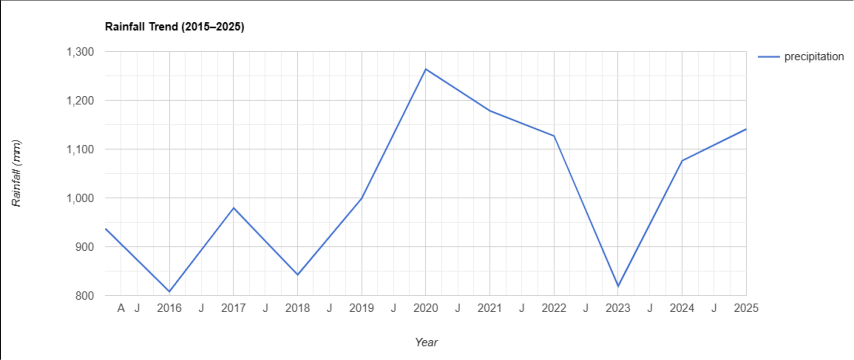 Figure 3Page 7
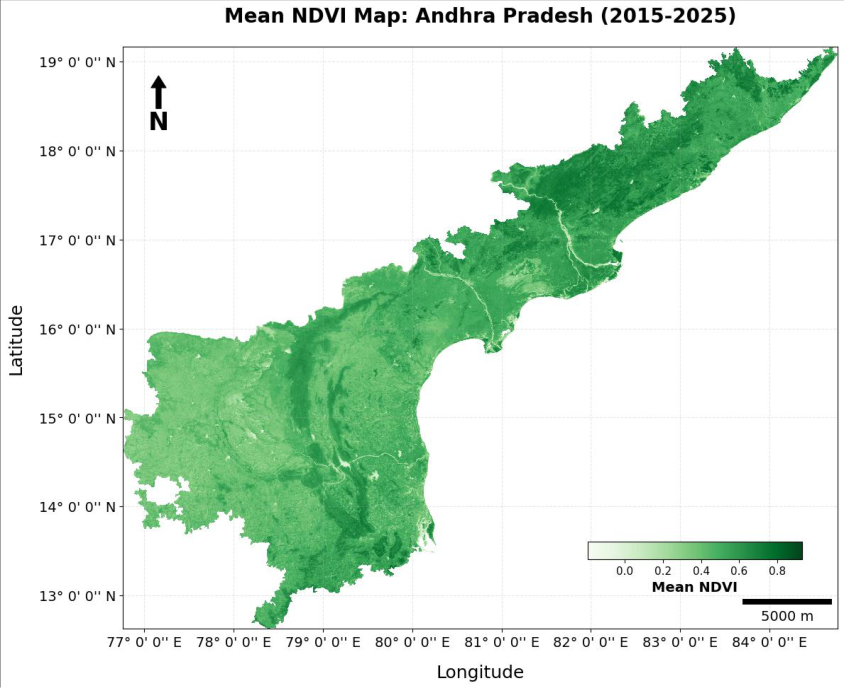 Figure 4Page 7
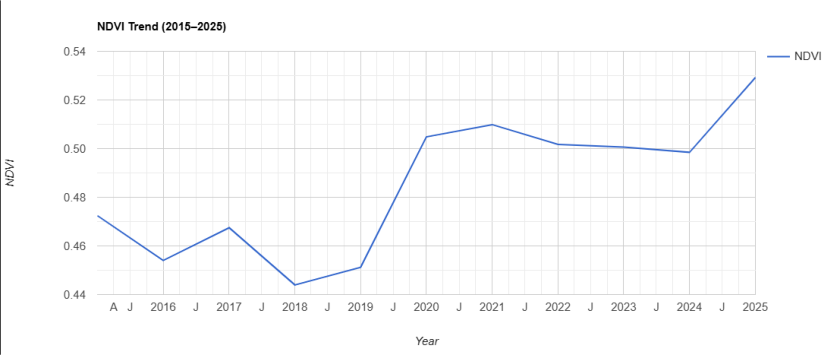 Figure 5Page 8
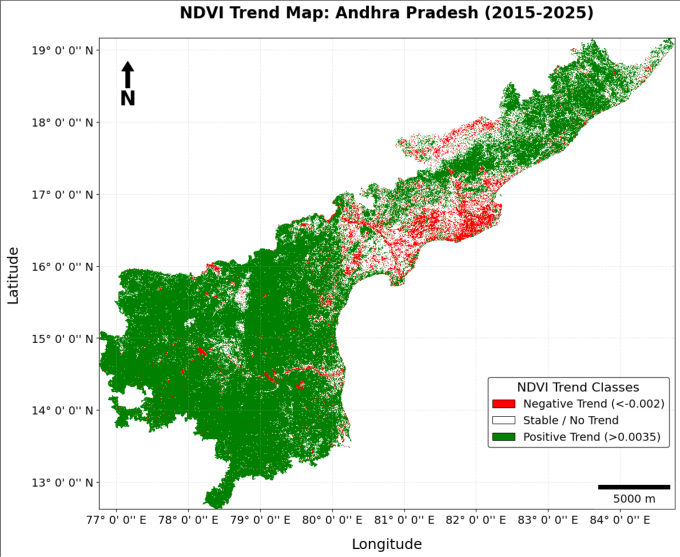 Figure 6Page 8
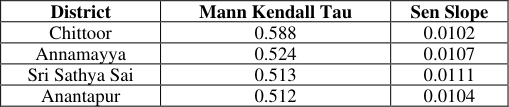 Table 5Page 9
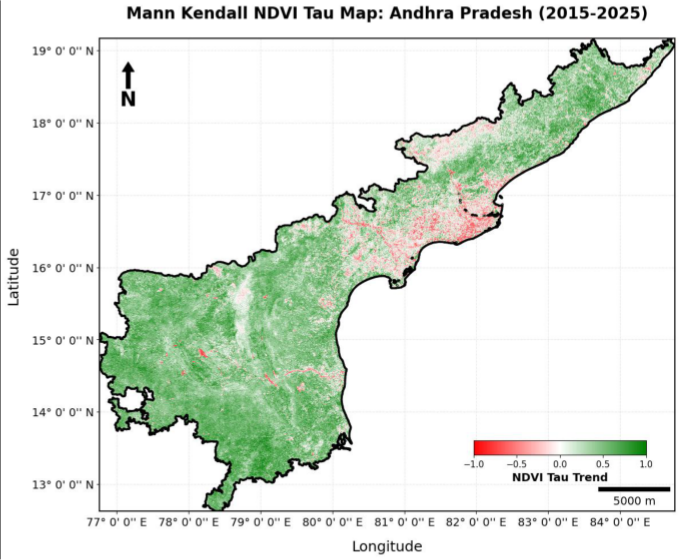 Figure 7Page 9
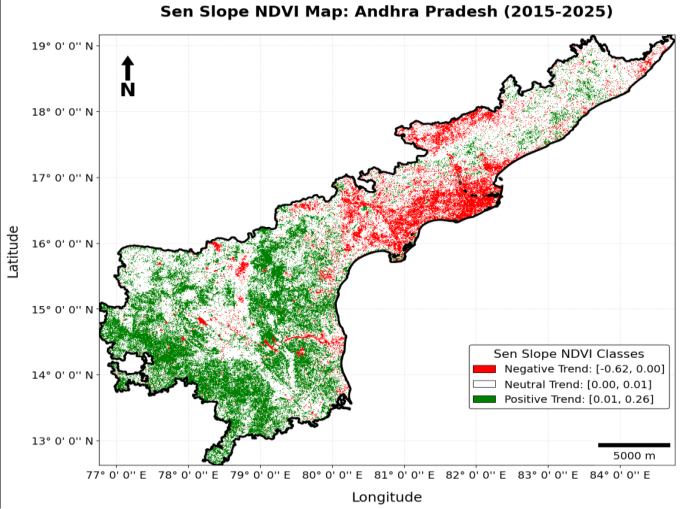 Figure 8Page 9
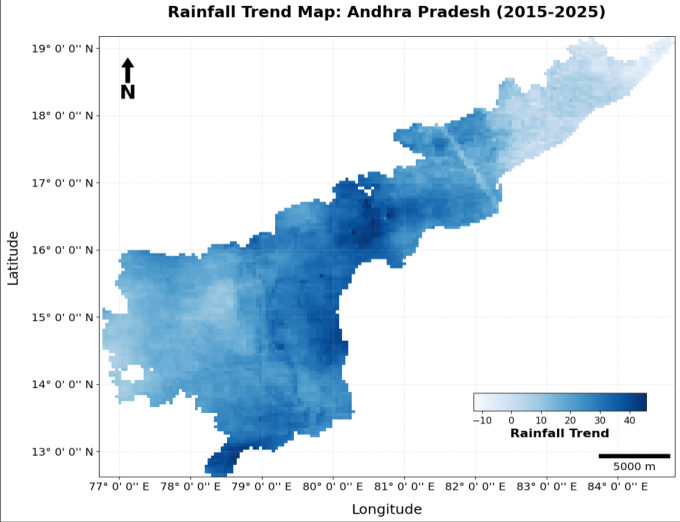 Figure 9Page 10
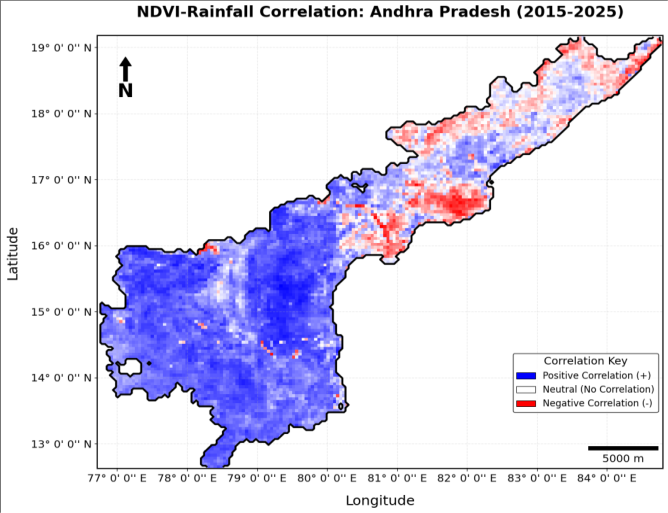 Figure 10Page 10
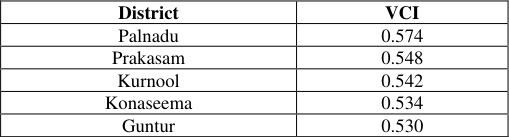 Table 6Page 11
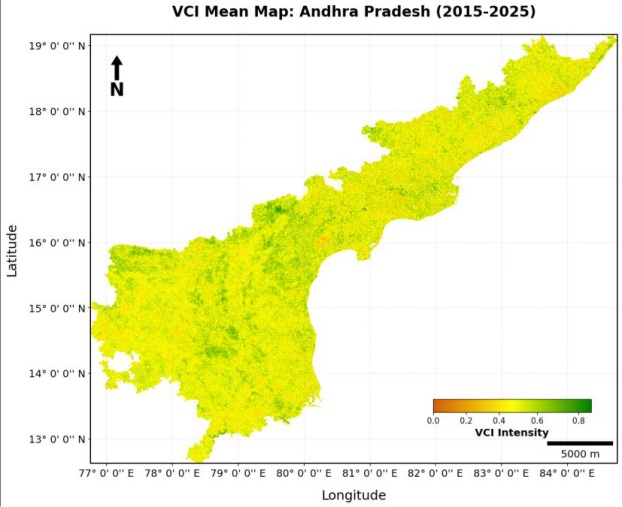 Figure 11Page 11
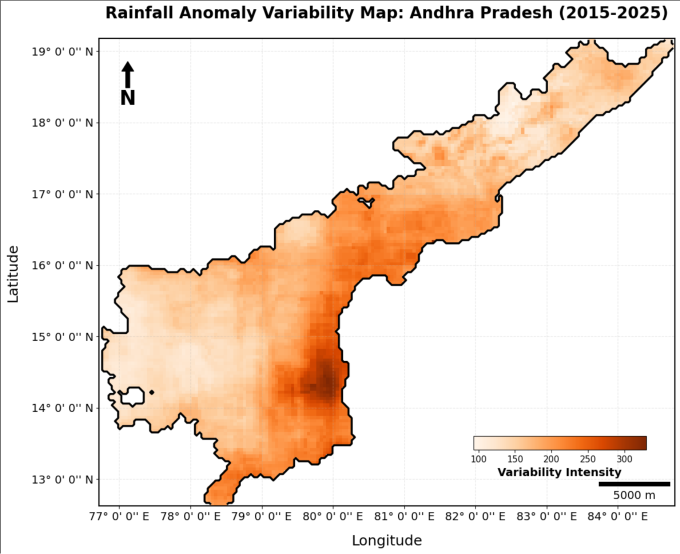 Figure 12Page 11
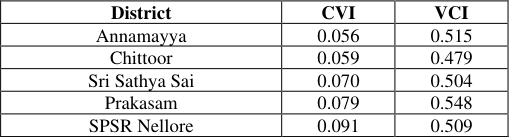 Table 8Page 12
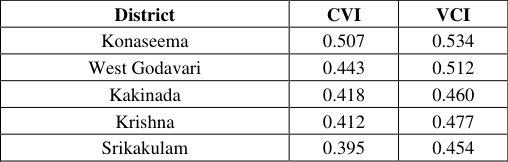 Table 7Page 12
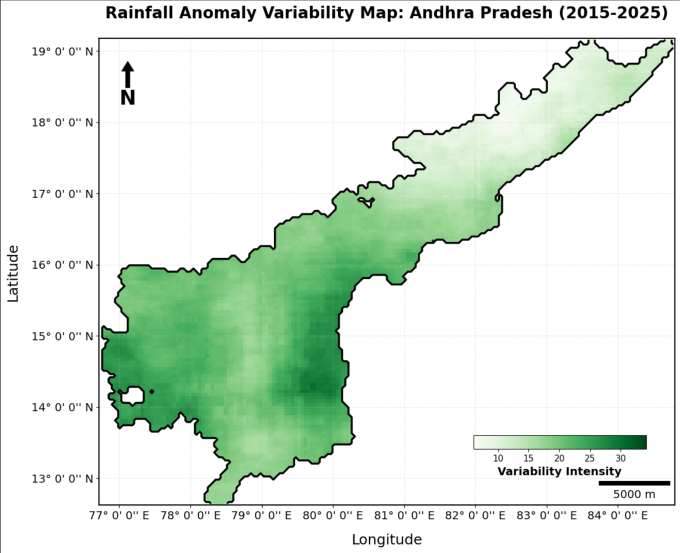 Figure 13Page 12
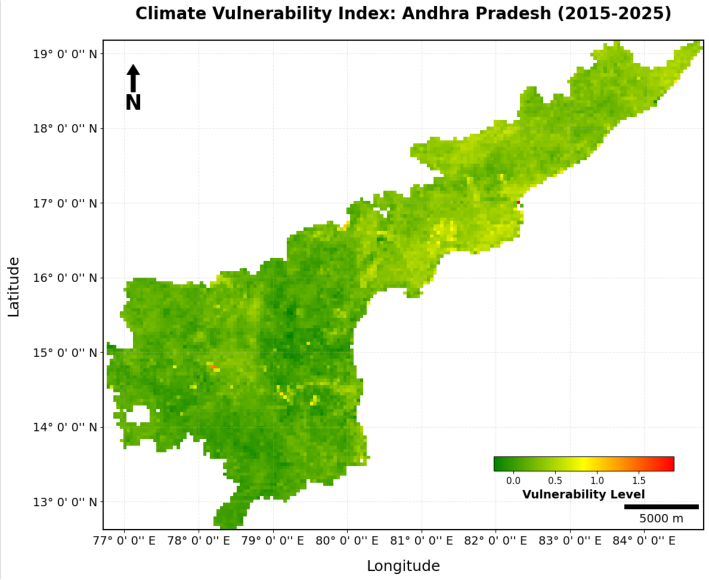 Figure 14Page 13
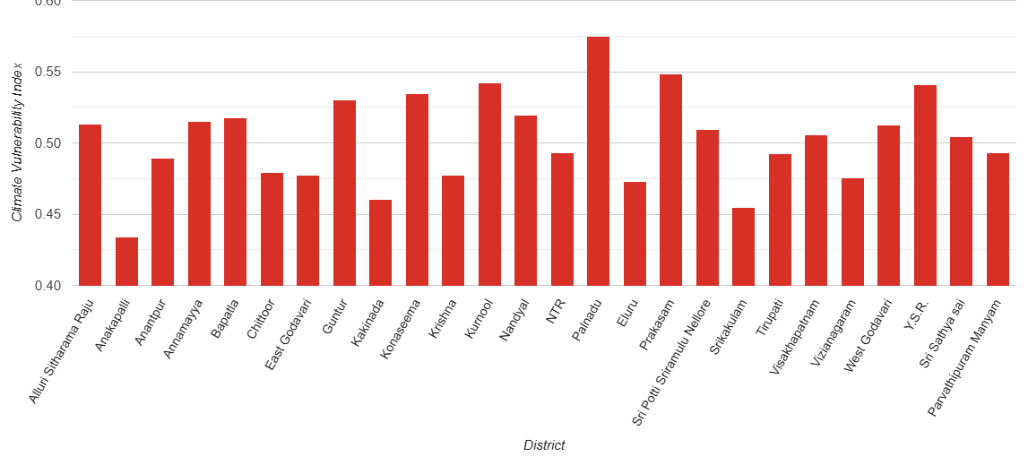 Figure 15Page 13
Introduction
The global climate is shifting rapidly, with increasing temperatures and erratic rainfall patterns disrupting terrestrial ecosystems [1] . Among these, vegetation serves as a vital indicator of environmental health, acting as a primary carbon sink and a regulator of hydrological cycles [2] . However, in semi-arid and tropical regions like Andhra Pradesh, India, the stability of these green covers is increasingly threatened by high rainfall variability [3] . Since nearly 60% of Indian agriculture remains rain-dependent, understanding how vegetation responds to these climatic shifts is essential for regional food security and ecological resilience [4,5] . Andhra Pradesh presents a complex landscape where seasonal monsoons dictate the phenological cycles of both natural forests and vast agricultural tracts [1] . In recent years, the frequency of extreme weather events, including prolonged dry spells and unseasonal heavy downpours, has intensified [1,6] .
These fluctuations lead to significant vegetation stress, often resulting in land degradation and loss of biomass [7] . For instance, districts such as Anantapur frequently face severe moisture deficits, which directly impact the photosynthetic activity and greenness of the local flora [7] . Remote sensing has emerged as a transformative tool for monitoring these dynamics across large spatial scales [4] . Satellite-derived indices, particularly the Normalized Difference Vegetation Index (NDVI), allow researchers to quantify vegetation health by measuring the contrast between near-infrared and red light reflectance [8] . By utilizing long-term time series data from platforms like Landsat or Sentinel, it is possible to track how vegetation "greenness" correlates with precipitation patterns over a decade [8] . Modern geospatial frameworks now integrate these spectral indices with climate variables to delineate vulnerability hotspots [7] . Despite existing studies on regional climate impacts, there is a lack of high-resolution, long-term assessments focusing specifically on the last decade (2015-2025) in Andhra Pradesh. This period is particularly significant as it encompasses a series of record-breaking heat years and shifting monsoon windows. This research aims to bridge this gap by conducting a comprehensive climate vulnerability assessment. We utilize a decade of satellite time series data to analyze the sensitivity of different vegetation types to rainfall fluctuations. The findings seek to provide a robust spatial framework for targeted land restoration and sustainable resource management in the state's most vulnerable ecosystems.
Literature Survey
The literature surrounding vegetation dynamics in Andhra Pradesh highlights a complex interplay between monsoon patterns and ecological health. Recent research indicates that while the state receives a significant portion of its annual rainfall during the Southwest monsoon, districts such as Anantapur and Chittoor remain chronically waterstressed, necessitating robust monitoring frameworks that go beyond simple precipitation totals [9] . Scholars have established the Normalized Difference Vegetation Index (NDVI) as a primary metric for quantifying biomass and photosynthetic activity across these semi-arid landscapes, proving its utility in distinguishing between natural forest cover and seasonal agricultural crops [10] . To improve the accuracy of drought detection, integrated systems now utilize a combination of NDVI, the Normalized Difference Water Index (NDWI), and the Vegetation Condition Index (VCI) for real-time assessments that reflect both chlorophyll content and leaf water potential [4] . National-scale studies have identified over 80 million hectares in India as highly vulnerable to rainfall-induced climate shifts, with the rain-shadow regions of Andhra Pradesh consistently appearing as high-risk zones in climate models [6] . District-level vulnerability indices further confirm that the state is among the most exposed to hydrometeorological extremes, which directly impacts local livelihoods and regional food security [11] . Long-term performance evaluations suggest that nearly 94% of the agricultural land in the region is susceptible to drought, emphasizing the need for high-resolution satellite monitoring to capture sub-district variations [12] . Furthermore, investigations into the lag effects of precipitation reveal a specific temporal delay between rainfall events and the subsequent greening of vegetation, a factor that is critical for developing early warning systems for crop failure [13] . The response of flora to extreme weather has also been a focal point, with evidence suggesting that maximum NDVI values offer a clearer picture of ecosystem recovery following heavy precipitation than mean averages, which can often smooth out critical stress events [14] . Validating these satellite observations against ground-based lysimeter data and soil moisture sensors remains a priority for ensuring the reliability of climate-vegetation models in tropical climates [15] . Global climatic drivers, such as El Niño and La Niña cycles, have been shown to cause significant inter-annual fluctuations in the state's vegetation vigor, often leading to "false springs" or delayed harvests [16] . These shifts are often exacerbated by land cover transformations in major river basins, which alter the local thermal environment and reduce the land's natural buffering capacity against heatwaves [17] . The application of the Standardized Precipitation Index (SPI) alongside spectral data has allowed researchers to delineate zones of high ecological resilience, providing a blueprint for where to focus reforestation efforts [18] . Advancements in impactbased forecasting are now being integrated into state-level policies to mitigate the risks posed by erratic rainfall, transitioning from reactive to proactive disaster management [19] . However, identifying desertification hotspots remains a challenge, particularly in the Rayalaseema region where soil erosion and moisture deficits lead to permanent vegetation decline [20] . Consequently, experts advocate for localized adaptation strategies informed by long-term geospatial time series to ensure sustainable land management and the protection of biodiversity in the face of a changing climate [21] .
Methodology 3.1 Study area
The study was conducted for the state of Andhra Pradesh (Figure 1) located in the southeastern part of India. The state lies between approximately 12°41'N to 19°54'N latitude and 76°46'E to 84°46'E longitude. Andhra Pradesh covers an area of about 162,975 square kilometers and includes 26 administrative districts. The region is characterized by a diverse physiography that includes fertile river deltas, the discontinuous mountain ranges of the Eastern Ghats, and the semi-arid peneplains of the Deccan Plateau. Bordered by the Bay of Bengal to the east, the state possesses the secondlongest coastline in India at roughly 974 km, which significantly influences its atmospheric moisture and vulnerability to tropical cyclonic activity. Climatically, Andhra Pradesh experiences a tropical environment primarily governed by the monsoonal cycle. The state is broadly categorized into distinct regions: Coastal Andhra, which features fertile alluvial plains, and Rayalaseema, characterized by rocky terrain and higher elevations. Average annual rainfall typically ranges from 600 mm in the western rain-shadow areas to over 1200 mm in the northern coastal districts. Precipitation is largely concentrated during the Southwest monsoon (June-September) and the Northeast monsoon (October-December), with the latter contributing significantly to the moisture regime of the southern coastal belt. The state is further delineated into six major Agro-Climatic Zones based on soil types, rainfall distribution, and cropping patterns: the North Coastal Zone, the Godavari Zone, the Krishna Zone, the Southern Zone, the Scarce Rainfall Zone (Rayalaseema), and the High-Altitude Tribal Areas [12] . The "Scarce Rainfall Zone" is of particular ecological concern, as it frequently records a low length of growing period (LGP) of only 70-90 days compared to 210-240 days in the delta plains [12] . Temperatures peak during the summer months, often exceeding 42 °C, while winter minimums generally remain between 15 °C and 25 °C [22] . This intricate mosaic of climatic and topographical features makes Andhra Pradesh an ideal laboratory for studying the sensitivity of vegetation to rainfall variability. Agriculture is the dominant land use in the region, and vegetation growth is largely dependent on rainfall availability and irrigation resources. Therefore, analysing the relationship between rainfall variability and vegetation dynamics is important for understanding ecosystem stability and climate vulnerability. The administrative boundary of Andhra Pradesh was used as the spatial boundary for all analyses.
Data sources
This study uses satellite remote sensing datasets and precipitation data available through cloud based geospatial platforms.
NDVI dataset: Vegetation dynamics were analysed using the MODIS Normalized Difference Vegetation Index (NDVI) product. Dataset details are given in Table 1. observations with station measurements and provides reliable rainfall estimates for climate studies.
| Dataset | Sensor | Resolution | Temporal resolution | Source |
|---|---|---|---|---|
| MOD13Q1 NDVI | MODIS | 250 m | 16 days | NASA |
| CHIRPS rainfall | Satellite + gauge | 5 km | Daily / monthly | Climate Hazards Center |
Table text extracted from the original PDF; superscript letters are shown inline. The original table image is below.
View original table image
Data preprocessing
All satellite datasets were processed using Google Earth Engine, which enables large scale geospatial analysis using cloud computing.
The following preprocessing steps were applied:
1. Import administrative boundary of Andhra Pradesh. Annual composite images were generated to reduce seasonal noise and provide a stable representation of vegetation conditions.
NDVI calculation
Vegetation greenness was measured using the Normalized Difference Vegetation Index (NDVI). NDVI is calculated using reflectance values from the red and near infrared bands of satellite imagery. The NDVI formula is:
(1) Where NIR = reflectance in near infrared band, Red = reflectance in red band. NDVI values range between -1 and +1. In this study, NDVI values mostly ranged between 0.44 and 0.53, indicating moderate vegetation density across the state.
Trend analysis
Long term vegetation trends were evaluated using linear regression analysis.
For each pixel, NDVI values were fitted to a linear model:
Mann-Kendall trend test
The Mann-Kendall test [23,24] is a non-parametric statistical method used to detect monotonic trends in time series data. The Mann-Kendall statistic S is calculated as:
Where and represent NDVI values at different time points.
The sign function is defined as
The Kendall τ coefficient is computed as: (5) Where n = number of observations In this study, the state level τ value was 0.363, indicating a moderate increasing trend in vegetation greenness.
Sen's slope estimator
Sen's slope estimator [24] was used to determine the magnitude of the vegetation trend. Sen's slope is calculated as the median of all pairwise slopes: The state level Sen slope obtained in this study is 0.00657, indicating that NDVI increased by approximately 0.0066 per year.
Vegetation Condition Index
Vegetation health was evaluated using the Vegetation Condition Index (VCI). VCI measures vegetation stress relative to historical NDVI values.
The VCI formula is: (7) Where VCI values range between 0 and 1. In this study, VCI values ranged from 0.43 to 0.57, indicating moderate vegetation health across most districts.
Rainfall anomaly
Rainfall anomaly analysis was conducted to examine deviations from long term average rainfall.
The rainfall anomaly formula is:
Where Positive anomaly values indicate above average rainfall, while negative values indicate rainfall deficits.
Rainfall-vegetation correlation
The relationship between rainfall and vegetation greenness was examined using Pearson correlation analysis. The Pearson correlation coefficient r is calculated as:
Where = rainfall values, = NDVI values Positive r values indicate that higher rainfall corresponds to higher vegetation greenness.
Climate Vulnerability Index
The Climate Vulnerability Index was used to assess the combined influence of rainfall variability and vegetation trends. The CVI integrates multiple indicators including NDVI trend, rainfall trend and vegetation condition index The index was normalized and combined using a weighted approach. (
Results and Discussion
Results and Discussion
Spatial distribution and variability of rainfall
Rainfall plays a critical role in controlling vegetation productivity in monsoon dominated regions such as Andhra Pradesh. The spatial distribution of average rainfall across the state during the study period is illustrated in Figure 2. The results show that rainfall is unevenly distributed across the region. Coastal districts and northern parts of the state generally receive higher rainfall compared to the semi-arid districts of Rayalaseema.
Vegetation dynamics and spatial patterns
Vegetation conditions were evaluated using MODIS derived NDVI data. The spatial distribution of average NDVI values across Andhra Pradesh is presented in Figure 4. Vegetation greenness declined slightly during the early part of the study period, reaching its lowest value in 2018. After this period, NDVI values increased significantly and reached approximately 0.505 in 2020. This increase coincides with the higher rainfall observed during the same period. Although NDVI experienced slight fluctuations between 2022 and 2024, vegetation conditions remained relatively stable. By 2025, NDVI increased to 0.529, which represents the highest vegetation greenness during the study period. The temporal patterns observed in NDVI suggest that vegetation growth across Andhra Pradesh responds strongly to rainfall availability and seasonal climatic variability.
NDVI trend analysis
Long term vegetation trends were examined using linear regression, Mann-Kendall trend analysis, and Sen's slope estimation. The spatial pattern of NDVI trends derived from linear regression is shown in Figure 6. The map indicates that most regions of Andhra Pradesh exhibit positive vegetation trends, suggesting gradual improvement in vegetation greenness over time. The magnitude of vegetation change was estimated using Sen's slope estimator. The Sen slope map is presented in Figure 8, which shows the rate of NDVI change across the state. The state level Sen slope value of 0.00657 indicates that NDVI increased by approximately 0.0066 units per year between 2015 and 2025. Although the rate of increase is modest, the consistent positive trend suggests gradual improvement in vegetation conditions across several districts.
District level vegetation trends
District level analysis reveals considerable spatial variation in vegetation trends. These districts are mainly located in the Rayalaseema region, where vegetation growth appears to have improved during the study period. The improvement may be associated with irrigation expansion, agricultural intensification, and groundwater utilisation.
Rainfall trends and vegetation response
Rainfall trends derived from linear regression analysis are presented in Figure 9. The rainfall trend map indicates spatial variation in precipitation changes across the state. Some regions show increasing rainfall trends, while others exhibit weaker or slightly negative trends. To examine the relationship between rainfall and vegetation growth, Pearson correlation analysis was performed. The resulting NDVI rainfall correlation map is shown in Figure 10. The results indicate that most regions of Andhra Pradesh exhibit positive correlation between rainfall and vegetation greenness, confirming that rainfall availability plays a key role in determining vegetation productivity. However, the strength of correlation varies spatially. Some districts show moderate correlation values, indicating that vegetation growth may also be influenced by factors such as irrigation practices, cropping patterns, and land management strategies.
Vegetation condition assessment
Vegetation resilience was further analysed using the Vegetation Condition Index. The spatial distribution of mean VCI values is presented in Figure 11. VCI values across Andhra Pradesh range from approximately 0.43 to 0.57, indicating moderate vegetation health across the state. District level VCI values provide insights into the relative stability of vegetation conditions. Table 6 summarises selected districts with higher vegetation condition values.
| District | VCI |
|---|---|
| Palnadu | 0.574 |
| Prakasam | 0.548 |
| Kurnool | 0.542 |
| Konaseema | 0.534 |
| Guntur | 0.530 |
Table text extracted from the original PDF; superscript letters are shown inline. The original table image is below.
View original table image
Rainfall anomaly and variability
Rainfall anomaly analysis was conducted to identify deviations from long term average rainfall. The spatial distribution of rainfall anomalies is presented in Figure 12. Positive anomaly values indicate areas receiving above average rainfall, whereas negative values represent rainfall deficits. The results reveal considerable spatial variation in rainfall anomalies across the state. Rainfall variability was further examined using the coefficient of variation of annual rainfall. The resulting rainfall variability map is shown in Figure 13. Areas with higher variability values indicate regions where rainfall fluctuates significantly from year to year. Such variability can increase ecological stress and influence vegetation productivity.
Climate vulnerability assessment
The Climate Vulnerability Index integrates NDVI trends, rainfall trends, and vegetation condition to evaluate the vulnerability of vegetation systems to climate variability.
The spatial distribution of CVI values across Andhra Pradesh is presented in Figure 14. Regions with higher CVI values represent areas where vegetation systems are more vulnerable to climatic fluctuations. District level CVI values presented in Figure 15 were extracted to identify areas with relatively higher vulnerability and given in Table 7.
| District | CVI | VCI |
|---|---|---|
| Konaseema | 0.507 | 0.534 |
| West Godavari | 0.443 | 0.512 |
| Kakinada | 0.418 | 0.460 |
| Krishna | 0.412 | 0.477 |
| Srikakulam | 0.395 | 0.454 |
Table text extracted from the original PDF; superscript letters are shown inline. The original table image is below.
View original table image
Conclusion
This study analysed the relationship between rainfall variability and vegetation dynamics across Andhra Pradesh during the period 2015 to 2025 using satellite remote sensing datasets and statistical trend analysis techniques. Vegetation patterns were examined using MODIS derived NDVI data, while rainfall variability was assessed using the CHIRPS precipitation dataset. The analysis was carried out using the Google Earth Engine platform, which enabled efficient processing of large scale geospatial datasets.
The spatial analysis revealed clear differences in rainfall
Figures and tables from the paper
| Tau value | Trend interpretation |
|---|---|
| τ > 0 | Increasing trend |
| τ < 0 | Decreasing trend |
| τ ≈ 0 | No trend |
Table text extracted from the original PDF; superscript letters are shown inline. The original table image is below.
View original table image
| NDVI range | Vegetation condition |
|---|---|
| < 0 | Water or barren land |
| 0 - 0.2 | Sparse vegetation |
| 0.2 - 0.5 | Moderate vegetation |
| > 0.5 | Dense vegetation |
Table text extracted from the original PDF; superscript letters are shown inline. The original table image is below.
View original table image
| VCI value | Vegetation condition |
|---|---|
| < 0.3 | Vegetation stress |
| 0.3 - 0.5 | Moderate condition |
| > 0.5 | Healthy vegetation |
Table text extracted from the original PDF; superscript letters are shown inline. The original table image is below.
View original table image
| District | Mann Kendall Tau | Sen Slope |
|---|---|---|
| Chittoor | 0.588 | 0.0102 |
| Annamayya | 0.524 | 0.0107 |
| Sri Sathya Sai | 0.513 | 0.0111 |
| Anantapur | 0.512 | 0.0104 |
Table text extracted from the original PDF; superscript letters are shown inline. The original table image is below.
View original table image
| District | CVI | VCI |
|---|---|---|
| Annamayya | 0.056 | 0.515 |
| Chittoor | 0.059 | 0.479 |
| Sri Sathya Sai | 0.070 | 0.504 |
| Prakasam | 0.079 | 0.548 |
| SPSR Nellore | 0.091 | 0.509 |
Table text extracted from the original PDF; superscript letters are shown inline. The original table image is below.
View original table image
References
24 in the original paper- Dwivedi CS, Pampattiwar ST, Pandey AC, Parida BR, Mitra D, Kumar N. Characterization of the coastal vulnerability in different geological settings: a comparative study on Kerala and Tamil Nadu coasts using FuzzyAHP. Sustainability. 2023;15(12). doi:10.3390/su15129543.
- Aneja VP, Schlesinger WH, Erisman JW, Behera SN, Sharma M, Battye W. Reactive nitrogen emissions from crop and livestock farming in India. Atmospheric Environment. 2012;47:92-103. doi:10.1016/j.atmosenv.2011.11.026.
- Banerjee S, et al. Groundwater potential mapping in India: a review of approaches and pathways for sustainable management. Cambridge Prisms: Drylands. 2025;2:e12. doi:10.1017/dry.2025.10008.
- Kaushalya R, Praveen Kumar V, Shubhasmita S. Assessing agricultural vulnerability in India using NDVI data products. International Archives of the Photogrammetry, Remote Sensing and Spatial Information Sciences. 2014;XL-8:39-46. doi:10.5194/isprsarchives-XL-8-39-2014.
- Ganapuram S, Mishra S, Nagarjan R, Venkataraman B. Micro-level drought vulnerability assessment in Peddavagu basin, a tributary of Krishna River, Andhra Pradesh, India. Earthzine (IEEE). 2012.
- Mohanty A, S W. Mapping India's climate vulnerability: a district level assessment. New Delhi; 2021.
- Badapalli PK, Nakkala AB, Kottala RB, Pujari PS, Gugulothu S. Aeolian sand migration induced land degradation and desertification hotspots identification in the semi-arid rain shadow regions of Anantapur, India. Scientific Reports. 2025;16(1):1875. doi:10.1038/s41598-025-31610-0.
- Harani P, Gautam S, Joshi SK, Ho CH. Spatio-temporal analysis of land use transformations and their environmental implications in the Thamirabarani River Basin, India. Frontiers in Remote Sensing. 2026;6. doi:10.3389/frsen.2025.1732414.
- Guhathakurta P, et al. Observed rainfall variability and changes over Andhra Pradesh state. Met Monograph ESSO/IMD. 2020;25.
- Tiwari MLPRGPRSK. Remote sensing indicators (NDVI, NDWI and VCI) for drought declaration in Andhra Pradesh state up to 2nd fortnight of August 2020 (Kharif season). Andhra Pradesh Space Applications Centre; 2020.
- Prasad KR, Rao K. Response of vegetation growth to the climatic parameters in different districts of Andhra Pradesh. 2019.
- Prasad B, Roy PS, Joshi PK, et al. Long-term agricultural performance and climate variability for drought assessment: a regional study from Telangana and Andhra Pradesh states, India. Geomatics, Natural Hazards and Risk. 2017;8(2):822-840. doi:10.1080/19475705.2016.1271831.
- Jyothi D, Pushpanjali B, Venkata Subrahmanyam M. Rainfall variation over Andhra Pradesh and comparison with all Indian rainfall during El Niño/La Niña. OAlib. 2023;10:1-16. doi:10.4236/oalib.1110115.
- Sandeep Kumar P, Krishnaveni M, Sivakumar D, Madhusudnacharyulu AS, Kumar V. Long-term statistical analysis of rainfall variability for climate adaptation planning in a semi-arid region. Global Journal of Environmental Science and Management. 2025;11(4):1379-1400. doi:10.22034/gjesm.2025.04.02.
- Liu W, Wang J, Xu F, Li C, Xian T. Validation of four satellite-derived soil moisture products using groundbased in situ observations over Northern China. Remote Sensing. 2022;14(6). doi:10.3390/rs14061419.
- Ca R, et al. Assessing vulnerability and adaptation of agriculture to climate change in Andhra Pradesh. Indian Journal of Agricultural Economics. 2017;72:375-384.
- Loan DT, Jian G, Ha NT, Guohua Z, Ha NTT, Nguyen H. Urban heat as a growing hazard: a spatiotemporal analysis of land-use/land-cover changes and land surface temperature in Ha Noi city, Viet Nam. Natural Hazards. 2026;122(6):228. doi:10.1007/s11069-025-07763-6.
- Nischitha V, Syed Ahmed A, Varikoden H, Revadekar J. The impact of seasonal rainfall variability on NDVI in the Tunga and Bhadra river basins, Karnataka, India. International Journal of Remote Sensing. 2014;35. doi:10.1080/01431161.2014.979301.
- Mohapatra M, et al. Short to medium range impact based forecasting of heavy rainfall in India. Mausam. 2023;74:311-344.
- Harani P, Gautam S, Joshi SK, Ho CH. Spatio-temporal analysis of land use transformations and their environmental implications in the Thamirabarani River Basin, India. Frontiers in Remote Sensing. 2026;6. doi:10.3389/frsen.2025.1732414.
- Graham CC. Localizing climate action in cities: applying historical ecology to urban climate governance. Global Environmental Change Advances. 2025;5:100024. doi:10.1016/j.gecadv.2025.100024.
- Rao VUM, et al. Agroclimatic atlas of Andhra Pradesh. 2013.
- Mondal A, Kundu S, Mukhopadhyay A. Rainfall trend analysis by Mann-Kendall test: a case study of northeastern part of Cuttack district, Orissa. International Journal of Geology, Earth and Environmental Sciences. 2012;2.
- Calma J, Fajardo SM. Climate trend analysis using Mann-Kendall and Sen's slope estimator tests in Central Luzon, Philippines. Interdisciplinary Research Review. 2025;20(1).