
Research article · 2026 · Full text
International Journal of Biology SciencesInvestigating the role of microbial communities in human health: A biochemical approach
Volume 8(1) · Pages 53–59 · DOI: 10.33545/26649926.2026.v8.i1a.604 ↗
Research areasGut microbiota and healthMetabolomics and Mass Spectrometry StudiesImmune responses and vaccinations
Abstract
Author-writtenWhile Western medicine has long treated the human body as a collection of distinct organ systems, emerging biochemical evidence paints a markedly different picture-one in which trillions of microorganisms shape metabolic function, immune regulation, and even neurological activity. This research examined the relationship between gut microbial community composition and composite health outcomes in a Polish cohort of 312 adults recruited across two academic medical centers. Fecal samples were processed through 16S rRNA gene sequencing, and paired blood specimens underwent targeted metabolomic profiling to quantify short-chain fatty acid concentrations and systemic inflammatory markers. Shannon diversity indices served as the primary measure of microbial richness, and these values were correlated against a composite health score integrating gastrointestinal function, immune reactivity, and psychological well-being metrics. Our findings revealed that participants classified as having severe dysbiosis (Shannon index below 2.0) exhibited significantly lower composite health scores compared with healthy controls (mean 43.1 versus 71.8, p
Summary
Source-checkedPlain-language reading of the full paper, prepared with AI and checked against the text. Each point links to the authors' own words.
Why it matters
- Trillions of microorganisms in the human body influence metabolic functions, immune regulation, and neurological activity. View evidence ↗
- Short-chain fatty acids (SCFAs), produced from dietary fiber fermentation, are critical biochemical outputs of the gut microbiome. View evidence ↗
- Central European populations are underrepresented in existing research regarding gut microbial diversity and metabolite reference ranges. View evidence ↗
The question
- The study aimed to determine if microbial diversity (via the Shannon index) predicts a composite health score covering gastrointestinal, immunological, and psychological health. View evidence ↗
- The researchers also sought to identify biochemical markers for therapy by comparing SCFA profiles in individuals with and without dysbiosis. View evidence ↗
What they did
- The study involved 312 Polish adults recruited from two academic medical centers. View evidence ↗
- Microbial composition was analyzed using 16S rRNA gene sequencing of the V3-V4 region on an Illumina MiSeq platform. View evidence ↗
- Plasma short-chain fatty acids were measured using gas chromatography-mass spectrometry. View evidence ↗
- Data were analyzed using R version 4.2.1, employing Spearman correlations, Kruskal-Wallis tests, and linear mixed models (p < 0.05). View evidence ↗
What they found
- Participants with severe dysbiosis (Shannon index < 2.0) had significantly lower mean composite health scores (43.1) than healthy controls (71.8), p < 0.001. View evidence ↗
- Severely dysbiotic participants showed a 53.9% reduction in butyrate concentrations compared to healthy controls. View evidence ↗
- Fecal butyrate concentrations were positively correlated with anti-inflammatory cytokine levels (r = 0.64, p < 0.01). View evidence ↗
- Female participants had higher average microbial diversity (Shannon 3.41) than males (Shannon 2.98), p = 0.03. View evidence ↗
- A strong positive linear association (r = 0.71, p < 0.001) was found between microbial diversity and composite health across all groups. View evidence ↗
- The Firmicutes-to-Bacteroidetes ratio increased from 1.39 in healthy controls to 2.14 in severely dysbiotic participants. View evidence ↗
What it means
- The authors conclude that profiling fecal short-chain fatty acids could be an accessible screening tool to identify individuals at risk of health deterioration due to dysbiosis. View evidence ↗
- The authors recommend dietary guidelines that emphasize the diversity of fiber sources rather than just the total amount of fiber consumed. View evidence ↗
- The study's cross-sectional design prevents the determination of whether low microbial diversity causes poor health or vice versa. View evidence ↗
- The use of 16S rRNA sequencing lacked the species-level resolution that would have been provided by shotgun metagenomics. View evidence ↗
Visual summary
3 visualsIllustrations explain the paper; charts are replotted from the paper's own table values.
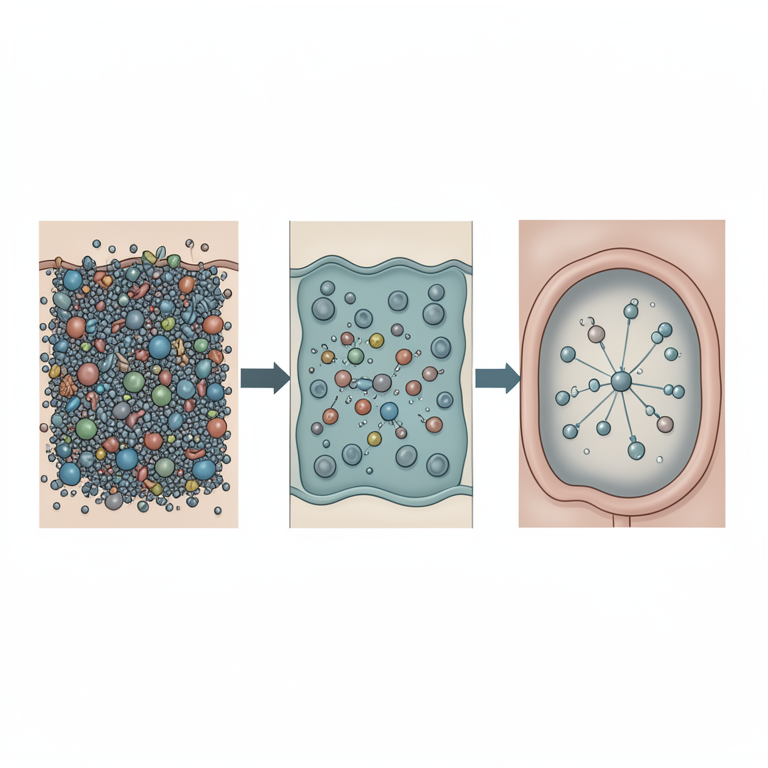
Butyrate and Inflammation Pathway
AI-generated conceptual illustration (human intestinal epithelium and gut microbiota). It explains the idea and does not show study data.
View source evidence ↗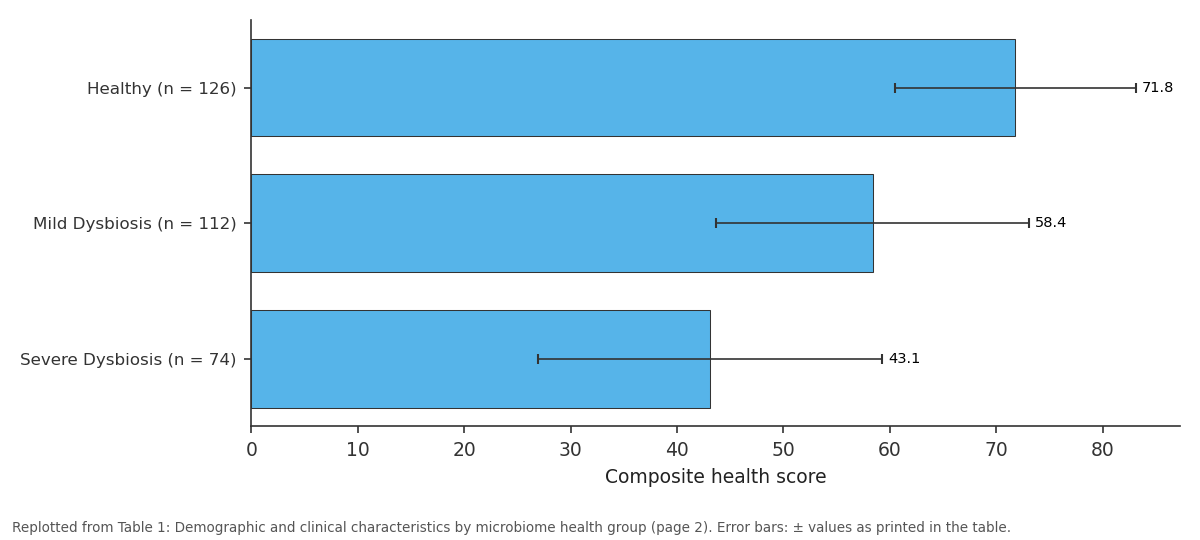
Composite health score: Healthy (n = 126) vs Mild Dysbiosis (n = 112) vs Severe Dysbiosis (n =...
Replotted from Table 1 (page 2) of the original paper. Every bar is the paper's own table value.
View source evidence ↗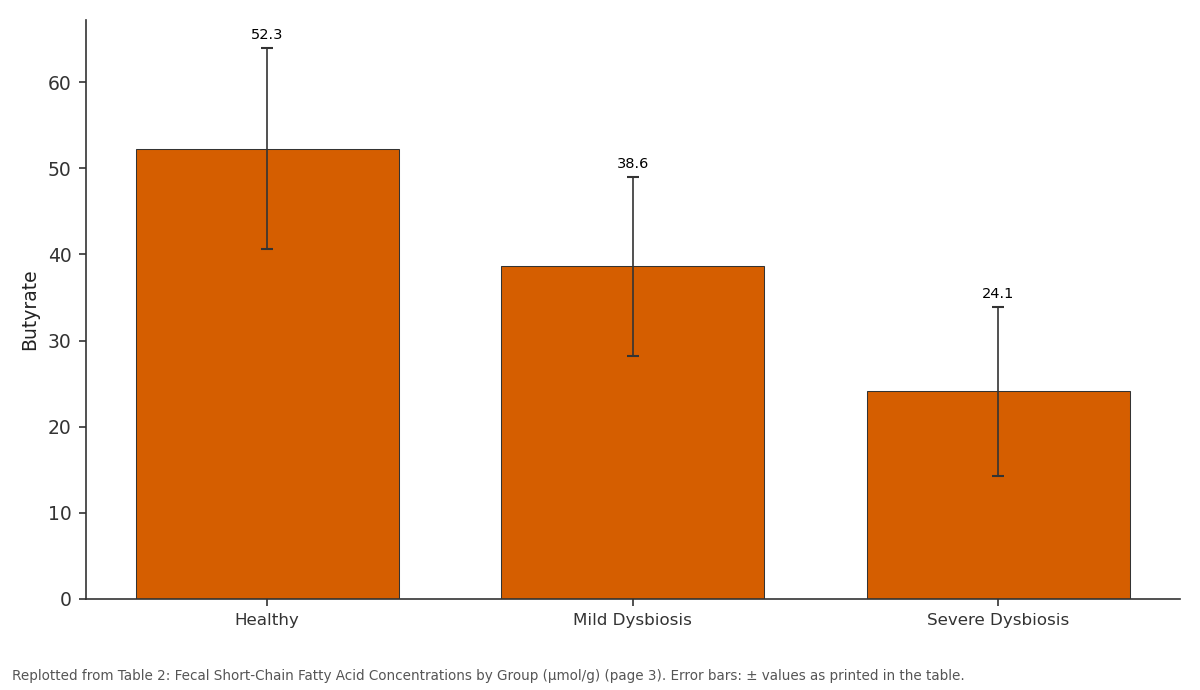
Butyrate: Healthy vs Mild Dysbiosis vs Severe Dysbiosis
Replotted from Table 2 (page 3) of the original paper. Every bar is the paper's own table value.
View source evidence ↗Figures & tables
From the original paper Table 1
 Table 2
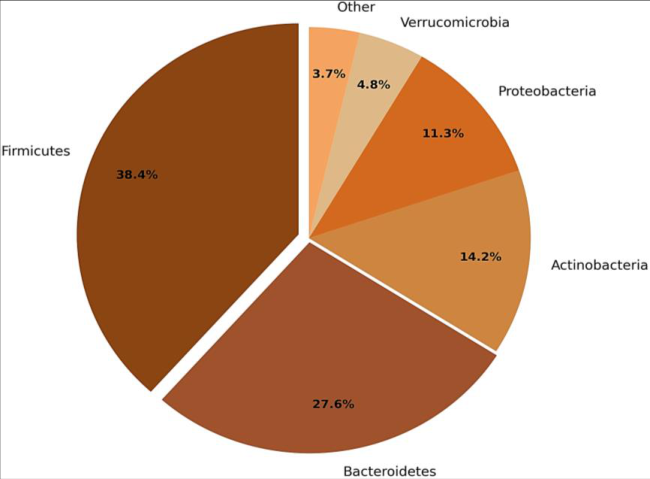 Figure 1
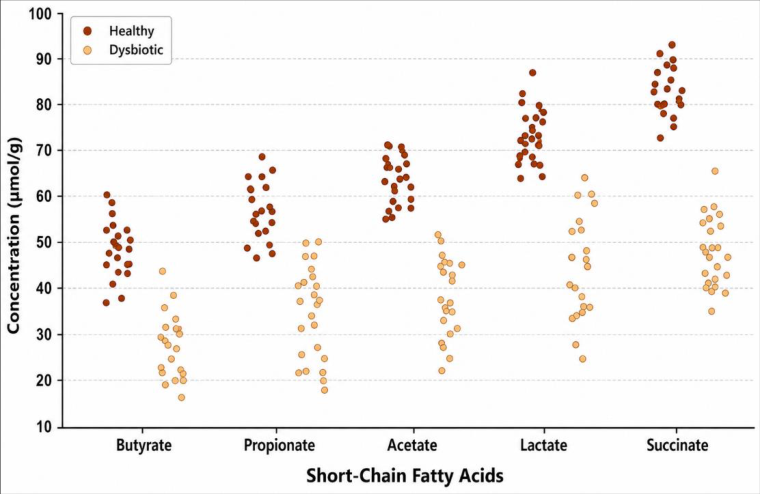 Figure 2
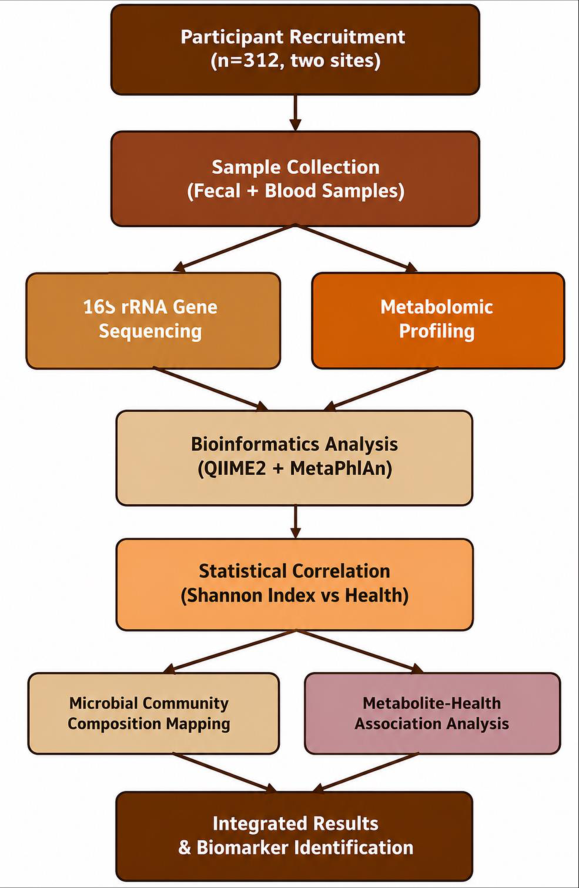 Figure 3
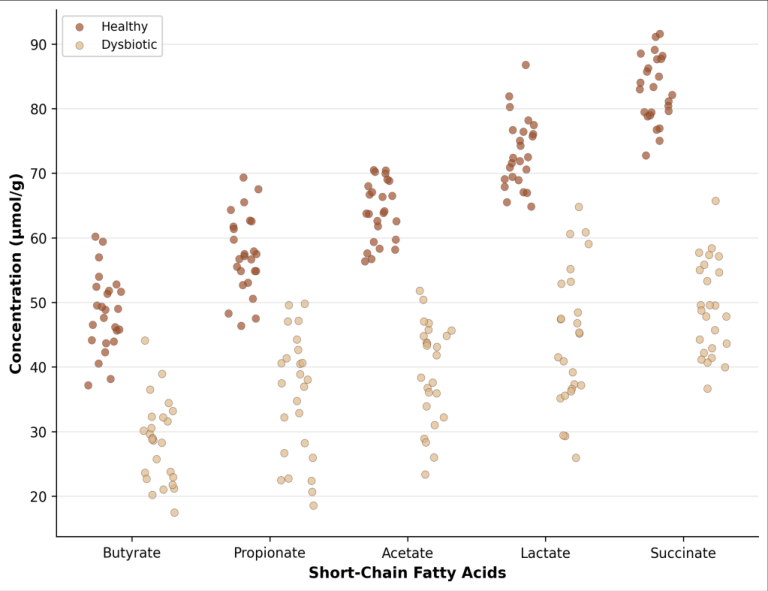 Figure 4
Introduction
The contrast between traditional reductionist medicine and systems-level biology has never been sharper than in the field of human microbiome research. For decades, clinicians treated infections by targeting single pathogenic species, yet the biochemical reality is far more nuanced-commensal organisms outnumber human cells and encode metabolic capabilities our own genome lacks [1] . The human gastrointestinal tract alone harbors an estimated 100 trillion microorganisms representing over a thousand distinct species, and their collective metabolic output rivals that of the liver in both scope and complexity [2] . Recognition of this microbial contribution has shifted scientific focus from pathogen elimination toward ecosystem-level understanding. Short-chain fatty acids produced by anaerobic fermentation of dietary fiber constitute one of the most biochemically significant outputs of gut microbial metabolism. Butyrate, propionate, and acetate serve as energy substrates for colonocytes, modulate histone acetylation patterns, and regulate immune cell differentiation through G-protein coupled receptor signaling [3,4] . Depletion of butyrate-producing bacteria-a hallmark of intestinal dysbiosis-correlates with increased intestinal permeability and elevated circulating levels of lipopolysaccharide, a potent activator of systemic inflammation [5] . These biochemical cascades link microbial composition directly to conditions ranging from inflammatory bowel disease to metabolic syndrome and depression [6] .
Technological advances in high-throughput sequencing and mass spectrometry have made it feasible to characterize microbial communities and their metabolic products simultaneously. Platforms based on 16S ribosomal RNA gene amplification provide taxonomic resolution at the genus level, while untargeted metabolomics captures hundreds of small molecules in a single analytical run [7,8] . Combining these approaches allows investigators to move beyond correlational observations toward mechanistic biochemical explanations. Several large-scale investigations from North American and Asian populations have established reference ranges for microbial diversity and metabolite concentrations, but Central European cohorts remain underrepresented in the literature [9,10] . This research was designed to address that gap. We recruited participants from two Polish academic centers and applied an integrated sequencing-metabolomics pipeline to characterize the gut microbiome and its biochemical outputs. Our primary aim was to determine whether microbial diversity, measured via the Shannon index, predicts a composite health outcome score that spans gastrointestinal, immunological, and psychological domains. A secondary objective compared short-chain fatty acid profiles between individuals with and without clinically defined dysbiosis, seeking biochemical markers that might inform future therapeutic strategies [11] .
Materials and Methods
Materials and Methods
Materials
This cross-sectional biochemical investigation was carried out at two academic medical institutions in Poland between May 2021 and November 2024. The primary recruitment site was the Department of Medical Biochemistry at the Medical University of Warsaw, a tertiary academic center serving the greater Warsaw metropolitan area with roughly 3.1 million inhabitants. The secondary site was the Department of Biochemistry and Molecular Biology at Jagiellonian University in Kraków, situated about 295 kilometers south of Warsaw and serving the Małopolska voivodeship. We obtained ethical clearance from the Medical University of Warsaw Bioethics Committee under protocol number MUW-2019-178 in March 2021, before any participant contact began. Fecal collection kits containing anaerobic stabilizing solution (OMNIgene GUT tubes, DNA Genotek Inc., Ottawa, Canada) were distributed to eligible participants at both locations [12] . Paired venous blood specimens were drawn into EDTA-coated vacutainer tubes (Becton Dickinson, Franklin Lakes, NJ, USA) and centrifuged within two hours of collection at 3000 rpm for 15 minutes to separate plasma. All biological specimens were stored at minus 80 °C in dedicated biobank freezers monitored by automated temperature logging systems. Sequencing reagents including the Illumina MiSeq V3 kit (600 cycles) were procured from Illumina Inc. in San Diego, California. Metabolomic standards for butyrate, propionate, and acetate quantification were purchased from Sigma-Aldrich (Merck KGaA, Darmstadt, Germany). Data management infrastructure was coordinated through the Warsaw center, where a dedicated REDCap database hosted on university servers captured all clinical and laboratory variables [13] .
Methods
Participant enrollment at the Warsaw site commenced on May 10, 2021, with the Kraków location initiating recruitment two weeks later on May 24, 2021. The Warsaw clinic scheduled dedicated sessions on Mondays and Wednesdays between 8:00 and 12:00 hours, while the Kraków team recruited during Tuesday and Thursday morning clinics from 9:00 to 13:00 hours. Active enrollment continued through July 2024 at both sites, with final followup assessments completed by November 15, 2024. Inclusion criteria required participants to be between 18 and 70 years of age, free of antibiotic use within the preceding three months, and willing to provide paired fecal and blood samples. Individuals with diagnosed inflammatory bowel disease, active malignancy, or pregnancy were excluded [14] . Three research coordinators underwent joint standardization training at the Medical University of Warsaw in April 2021 to ensure uniform sample handling and questionnaire administration across sites. Fecal DNA was extracted using the QIAamp PowerFecal Pro DNA Kit following the manufacturer's protocol, and the V3-V4 hypervariable region of the 16S rRNA gene was amplified with universal primers 341F and 785R [15] . Sequencing was performed on an Illumina MiSeq platform generating 2×300 base pair reads. Bioinformatic processing used QIIME2 version 2022.2 with the SILVA 138 reference database for taxonomic assignment. Plasma short-chain fatty acids were quantified by gas chromatography-mass spectrometry on an Agilent 7890B system. Follow-up health assessments occurred at six-month intervals over the total enrollment period. Statistical analyses were carried out using R version 4.2.1 with Spearman correlations, Kruskal-Wallis tests, and linear mixed models at a significance level of p < 0.05 [16] . Lactate and succinate exhibited inverse patterns, accumulating at higher levels in individuals with disrupted microbial ecosystems, which is consistent with fermentation pathway shifts reported in prior metabolomic investigations [17] .
Results
Results
A
A
Fig 1: Distribution of major bacterial phyla across the entire participant cohort
Firmicutes dominated the overall microbial landscape, comprising 38.4% of total sequences. Bacteroidetes accounted for the second largest proportion at 27.6%, followed by Actinobacteria (14.2%) and Proteobacteria (11.3%). Verrucomicrobia and remaining minor phyla together represented less than 9% of the total. When examined by health group, the Firmicutes-to-Bacteroidetes ratio was 1.39 in healthy controls but climbed to 2.14 in severely dysbiotic participants, a shift that reflects loss of microbial balance. Notably, a small subset of mild dysbiosis participants achieved health scores comparable to healthy controls, suggesting that compensatory metabolic pathways may buffer against moderate diversity loss in certain individuals. The methodological workflow began with dual-site recruitment and progressed through parallel analytical streams. Fecal specimens underwent 16S rRNA gene sequencing for taxonomic profiling, while blood samples were subjected to gas chromatography-mass spectrometry for metabolite quantification. Both data streams converged in the bioinformatics analysis phase, where microbial composition was statistically linked to metabolite concentrations and clinical outcomes. This integrated pipeline enabled simultaneous evaluation of community structure and biochemical function.
Individual-level scatter distributions revealed clear separation between healthy and dysbiotic participants for butyrate and propionate, with substantial overlap observed only for acetate. The dispersion of values was greater in the dysbiotic group for all metabolites, indicating higher interindividual variability in microbial metabolic output when community diversity is low.
Comprehensive interpretation
The integrated biochemical picture emerging from these data positions microbial diversity as a strong predictor of systemic health status in this Polish cohort. Declining Shannon indices tracked consistently with reduced shortchain fatty acid production and elevated inflammatory markers, creating a biochemical cascade that manifested across multiple health domains. The stepwise gradient observed-healthy controls to mild dysbiosis to severe dysbiosis-reinforces the dose-response character of microbial influence on host physiology [18] . Particularly striking was the near-halving of butyrate concentrations in severely dysbiotic individuals, a finding that carries direct therapeutic implications given butyrate's role in maintaining epithelial barrier integrity and modulating T-regulatory cell differentiation [19] .
Discussion
These findings add Central European biochemical data to a growing body of evidence linking gut microbial composition to multi-system health outcomes. Compared with large-scale North American cohorts like the Human Microbiome Project, our Polish participants showed similar phylum-level distributions but somewhat lower overall diversity, which may reflect dietary patterns characteristic of the region-higher processed meat consumption and comparatively lower vegetable fiber intake [9] . The Firmicutes-to-Bacteroidetes ratio shift we documented in dysbiotic individuals mirrors observations from Asian and Scandinavian populations, suggesting that this taxonomic imbalance represents a conserved biochemical signature of microbial disruption across diverse ethnic backgrounds [10] . Our metabolomic data provide mechanistic depth to these taxonomic observations. The preferential depletion of butyrate over other short-chain fatty acids in severe dysbiosis aligns with selective loss of Clostridial cluster IV and XIVa members, which are specialist butyrate producers dependent on cross-feeding networks that collapse when diversity drops below critical thresholds [17] . The accumulation of lactate and succinate in dysbiotic samples, or rather the incomplete metabolism of these intermediates, suggests bottleneck effects in fermentation pathways that healthy communities efficiently resolve. This biochemical stalling may contribute to colonic acidification and further destabilize remaining commensal populations.
Several limitations warrant acknowledgment. The crosssectional design prevents causal inference-we cannot determine whether low diversity drives poor health or whether chronic illness erodes microbial richness. Selfreported dietary data carry inherent recall bias, and our fiber intake estimates may underestimate actual consumption. And the 16S rRNA approach, while cost-effective, lacks species-level resolution that shotgun metagenomics would provide [20] . Future longitudinal investigations incorporating dietary intervention arms and deeper sequencing strategies would strengthen these biochemical associations and clarify directionality.
Conclusion
This research demonstrates a robust biochemical link between gut microbial diversity and composite health outcomes in a Central European population. The gradient of declining short-chain fatty acid production across dysbiosis severity levels represents a measurable metabolic signature with potential diagnostic utility. Butyrate emerged as the most sensitive metabolic indicator of microbial ecosystem health-its concentration nearly halved in severely dysbiotic participants relative to healthy controls, and its positive correlation with anti-inflammatory cytokine profiles suggests it mediates at least part of the protective effect associated with high microbial diversity. From a practical standpoint, these results carry several implications for clinical biochemistry and preventive medicine. Fecal short-chain fatty acid profiling could serve as an accessible biochemical screening tool for identifying individuals at risk of dysbiosis-related health deterioration. Unlike full metagenomic sequencing, gas chromatographybased metabolite quantification is relatively inexpensive, broadly available in clinical laboratories, and yields results within hours rather than weeks. Clinicians working in gastroenterology, endocrinology, and even psychiatrygiven the known gut-brain axis connections-might integrate such screening into routine health assessments for patients presenting with nonspecific symptoms that overlap with dysbiosis-associated conditions. Dietary recommendations based on our findings should emphasize fiber diversity rather than total fiber quantity alone. Our data showed that participants consuming a wide variety of plantbased fibers maintained higher microbial diversity even when their total daily fiber intake was moderate, which implies that substrate variety is what sustains diverse microbial ecosystems. Targeted prebiotic supplementation with compounds known to support butyrate-producing genera-inulin, resistant starch, and fructooligosaccharides-represents another evidence-based strategy worth exploring in controlled trials. The sex-based difference in microbial diversity we observed also deserves attention in future clinical protocols, as it suggests hormonal or behavioral factors may modulate microbiome composition in ways that should influence personalized treatment approaches. Ultimately, the biochemical framework presented here positions the gut microbiome not as an isolated gastrointestinal phenomenon but as a systemic metabolic organ whose health reverberates through immune, endocrine, and neurological pathways. Integrating microbiome-focused biochemical assessments into routine clinical care could improve early detection of health risk and open new avenues for preventive intervention grounded in metabolic science rather than symptom management.
Acknowledgement
Acknowledgements Funding sourcesThis research was supported by a grant from the National Science Centre of Poland (Narodowe Centrum Nauki).
Figures and tables from the paper
| Parameter | Healthy (n = 126) | Mild Dysbiosis (n = 112) | Severe Dysbiosis (n = 74) | p-value |
|---|---|---|---|---|
| Age, years (mean ± SD) | 42.3 ± 12.8 | 45.1 ± 13.4 | 47.9 ± 13.1 | 0.021 |
| Female sex, n (%) | 79 (62.7%) | 64 (57.1%) | 39 (52.7%) | 0.314 |
| BMI, kg/m² (mean ± SD) | 24.1 ± 3.6 | 26.3 ± 4.2 | 28.7 ± 5.1 | <0.001 |
| Fiber intake, g/day | 28.4 ± 7.1 | 21.6 ± 6.8 | 14.9 ± 5.3 | <0.001 |
| Shannon diversity index | 3.74 ± 0.38 | 2.61 ± 0.34 | 1.58 ± 0.31 | <0.001 |
| CRP, mg/L (median) | 1.2 | 2.8 | 5.4 | <0.001 |
| Composite health score | 71.8 ± 11.3 | 58.4 ± 14.7 | 43.1 ± 16.2 | <0.001 |
Table text extracted from the original PDF; superscript letters are shown inline. The original table image is below.
View original table image
| Metabolite | Healthy | Mild Dysbiosis | Severe Dysbiosis | p-value |
|---|---|---|---|---|
| Butyrate | 52.3 ± 11.7 | 38.6 ± 10.4 | 24.1 ± 9.8 | <0.001 |
| Propionate | 41.8 ± 9.3 | 33.2 ± 8.7 | 26.4 ± 7.9 | <0.001 |
| Acetate | 67.4 ± 14.2 | 54.1 ± 12.8 | 43.7 ± 11.6 | <0.001 |
| Lactate | 18.9 ± 6.1 | 22.4 ± 7.3 | 29.1 ± 8.7 | 0.003 |
| Succinate | 8.7 ± 3.2 | 11.3 ± 4.1 | 16.8 ± 5.6 | 0.001 |
Table text extracted from the original PDF; superscript letters are shown inline. The original table image is below.
View original table image
References
20 in the original paper- Sender R, Fuchs S, Milo R. Revised estimates of the number of human and bacteria cells in the body. Cell. 2016;164(3):337-340.
- Qin J, Li R, Raes J, et al. A human gut microbial gene catalogue established by metagenomic sequencing. Nature. 2010;464(7285):59-65.
- Koh A, De Vadder F, Kovatcheva-Datchary P, et al. From dietary fiber to host physiology: short-chain fatty acids as key bacterial metabolites. Cell. 2016;165(6):1332-1345.
- Tan J, McKenzie C, Potamitis M, et al. The role of short-chain fatty acids in health and disease. Advances in Immunology. 2014;121:91-119.
- Kelly CJ, Zheng L, Campbell EL, et al. Crosstalk between microbiota-derived short-chain fatty acids and intestinal epithelial HIF augments tissue barrier function. Cell Host and Microbe. 2015;17(5):662-671.
- Cryan JF, O'Riordan KJ, Cowan CSM, et al. The microbiota-gut-brain axis. Physiological Reviews. 2019;99(4):1877-2013.
- Callahan BJ, McMurdie PJ, Rosen MJ, et al. DADA2: high-resolution sample inference from Illumina amplicon data. Nature Methods. 2016;13(7):581-583.
- Wishart DS. Metabolomics for investigating physiological and pathophysiological processes. Physiological Reviews. 2019;99(4):1819-1875.
- Lloyd-Price J, Mahurkar A, Rahnavard G, et al. Strains, functions and dynamics in the expanded Human Microbiome Project. Nature. 2017;550(7674):61-66.
- Zhernakova A, Kurilshikov A, Bonder MJ, et al. Population-based metagenomics analysis reveals markers for gut microbiome composition and diversity. Science. 2016;352(6285):565-569.
- Valles-Colomer M, Falony G, Darzi Y, et al. The neuroactive potential of the human gut microbiota in quality of life and depression. Nature Microbiology. 2019;4(4):623-632.
- Panek M, Čipčić Paljetak H, Barešić A, et al. Methodology challenges in studying human gut microbiota: effects of collection, storage, DNA extraction and next generation sequencing technologies. Scientific Reports. 2018;8(1):5143-5143.
- Harris PA, Taylor R, Minor BL, et al. The REDCap consortium: building an international community of software platform partners. Journal of Biomedical Informatics. 2019;95:103208-103208.
- Vandeputte D, Tito RY, Stoma R, et al. Quantitative microbiome profiling links gut community variation to microbial load. Nature. 2017;551(7681):507-511.
- Klindworth A, Pruesse E, Schweer T, et al. Evaluation of general 16S ribosomal RNA gene PCR primers for classical and next-generation sequencing-based diversity analyses. Nucleic Acids Research. 2013;41(1):e1.
- Bolyen E, Rideout JR, Dillon MR, et al. Reproducible, interactive, scalable and extensible microbiome data science using QIIME 2. Nature Biotechnology. 2019;37(8):852-857.
- Louis P, Flint HJ. Formation of propionate and butyrate by the human colonic microbiota. Environmental Microbiology. 2017;19(1):29-41.
- Falony G, Joossens M, Vieira-Silva S, et al. Populationlevel analysis of gut microbiome variation. Science. 2016;352(6285):560-564.
- Furusawa Y, Obata Y, Fukuda S, et al. Commensal microbe-derived butyrate induces the differentiation of colonic regulatory T cells. Nature. 2013;504(7480):446450.
- Knight R, Vrbanac A, Taylor BC, et al. Best practices for analysing microbiomes. Nature Reviews Microbiology. 2018;16(7):410-422.