
Research article · 2026 · Full text
International Journal of Biology SciencesEvolutionary biochemistry: How molecular adaptations drive biological innovation
Volume 8(2) · Pages 106–111 · DOI: 10.33545/26649926.2026.v8.i2b.605 ↗
Research areasPsidium guajava Extracts and ApplicationsFood Science and Nutritional StudiesPlant biochemistry and biosynthesis
Abstract
Author-writtenA field experiment was carried out in the Experimental Orchard of Department of Horticulture, CCS Haryana Agricultural University, Hisar during 2016-17, to study the effect of foliar sprays of ZnSO4 (0.50, 0.75 and 1.00%), FeSO4 (0.2, 0.4 and 0.6%), K2SO4 (0.5, 1.0 and 1.5%) and Urea (1.0, 1.5 and 2.0%) along with control (water spray) before flowering and after fruit set, during rainy and winter seasons, on total yield and leaf nutrient status of guava (Psidium guajava L.) cv. L-49. The findings of the experiment revealed that the foliar application of various nutrients significantly influenced the total yield and leaf nutrient status of the plants over control. Total yield per tree per annum was recorded to be maximum (62.07 kg/tree) under ZnSO4 @1.00 per cent, which was significantly higher than all other treatments except ZnSO4 @0.75 per cent (61.39 kg/tree), while the minimum (50.46 kg/tree) was recorded under control. Maximum N content (1.78%) was obtained with the spray of Urea @2.0 per cent that was closely followed by Urea @1.5 per cent (1.76%), while the minimum (1.57%) was obtained under K2SO4 @1.0 per cent. Maximum P (0.23%) and K content (1.79%) were obtained with K2SO4 @1.5 per cent, which was closely followed K2SO4 @1.0 per cent by (0.22% P and 1.77% K) whereas, minimum P content (0.15%) was recorded under Urea @1.5 and 2.0 per cent and minimum K content (1.63%) was recorded under Urea @1.0 per cent and FeSO4 @0.2 per cent. Maximum Zn content (48.02 ppm) was obtained with the spray of ZnSO4 @1.00 per cent, which was closely followed by ZnSO4 @0.75 per cent (46.87 ppm) and the minimum (31.12 ppm) was obtained under control. Maximum Fe content (179.1 ppm) was obtained with the spray of FeSO4 @0.6 per cent that was closely followed by FeSO4 @0.4 per cent (177.3 ppm), while the minimum was obtained under Urea @2.0 per cent (153.1 ppm) followed by Urea @1.5 per cent (154.9 ppm).
Summary
Source-checkedPlain-language reading of the full paper, prepared with AI and checked against the text. Each point links to the authors' own words.
Why it matters
- Evolutionary biochemistry seeks to understand how simple primordial proteins evolved into the complex, substrate-specific catalysts found in modern organisms. View evidence ↗
- Gene duplication is a key mechanism for innovation, as it provides redundant genetic copies that can mutate and develop new functions without harming the organism's existing metabolism. View evidence ↗
- Comparative enzymology is often hindered by a lack of standardization, as kinetic measurements are highly sensitive to laboratory-specific conditions. View evidence ↗
The question
- The researchers aimed to eliminate inter-laboratory variability by analyzing all samples in a single environment using standardized protocols to better identify genuine evolutionary trends. View evidence ↗
What they did
- The study used a panel of six model organisms: humans, chimpanzees, a rodent, a teleost fish, an arthropod, and a nematode. View evidence ↗
- The researchers measured the activity of three enzyme families: Cytochrome P450, Superoxide dismutase, and aldolase. View evidence ↗
- To ensure consistency between warm-blooded and cold-blooded species, all assays were conducted in triplicate at 25 degrees Celsius. View evidence ↗
What they found
- Cytochrome P450 activity showed a phylogenetic gradient, with the highest activity in H. sapiens (94.3 ± 8.1 u/mg protein) and the lowest in C. elegans (31.1 ± 4.7 u/mg protein). View evidence ↗
- Enzyme activity was very similar between humans and chimpanzees, with differences remaining below 7% for all three enzymes studied. View evidence ↗
- Mammals showed significantly higher scores for allosteric regulation (8.4 ± 0.7) compared to insects (5.8 ± 0.9) and nematodes (4.3 ± 1.1). View evidence ↗
- The catalytic active sites of the enzymes were highly conserved across all lineages, with only a 6.6 percentage point difference in conservation between vertebrates and invertebrates. View evidence ↗
- Surface loops showed the most evolutionary change, with conservation dropping to 34.8% in invertebrates. View evidence ↗
What it means
- The authors conclude that different taxa employ distinct biochemical strategies: mammals prioritize regulatory complexity, while insects optimize for raw catalytic speed. View evidence ↗
- The authors recommend that enzyme engineering efforts focus on mutating surface loops and allosteric sites rather than the catalytic core to mimic natural evolutionary innovation. View evidence ↗
- A limitation of the study is the use of whole-organism homogenates for invertebrates, which may mask tissue-specific differences in enzyme expression. View evidence ↗
Visual summary
3 visualsIllustrations explain the paper; charts are replotted from the paper's own table values.

Core-to-Periphery Conservation Gradient
AI-generated conceptual illustration (a globular enzyme protein molecule). It explains the idea and does not show study data.
View source evidence ↗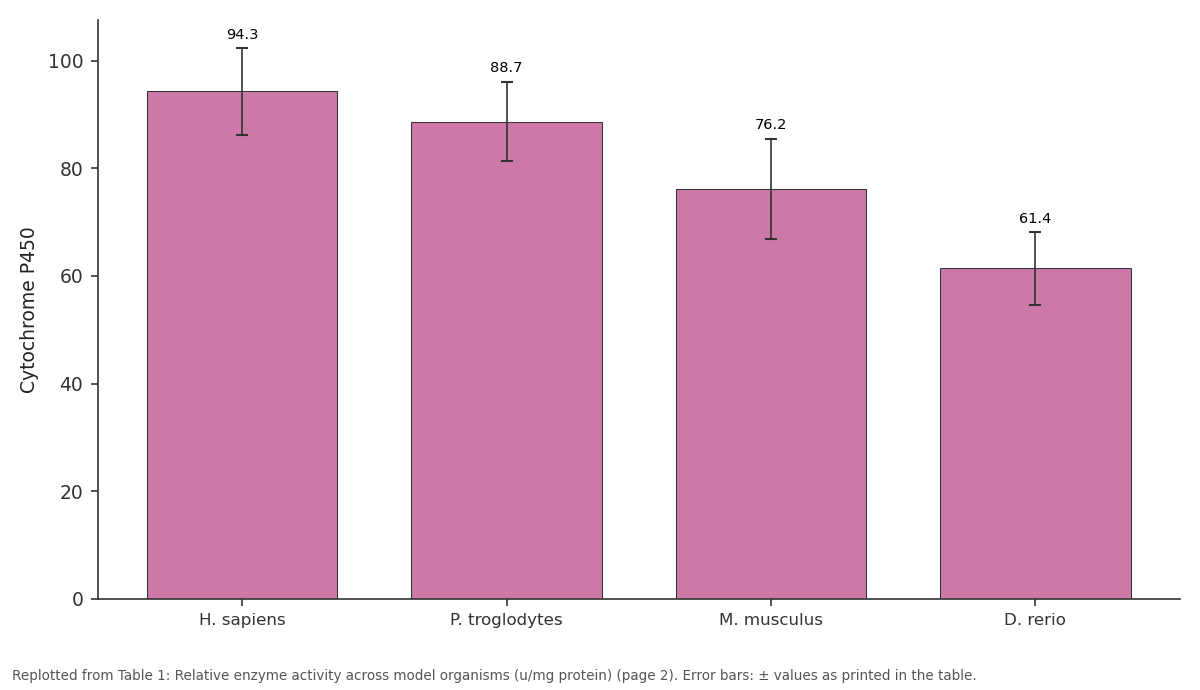
Cytochrome P450: H. sapiens vs P. troglodytes vs M. musculus vs D. rerio
Replotted from Table 1 (page 2) of the original paper. Every bar is the paper's own table value.
View source evidence ↗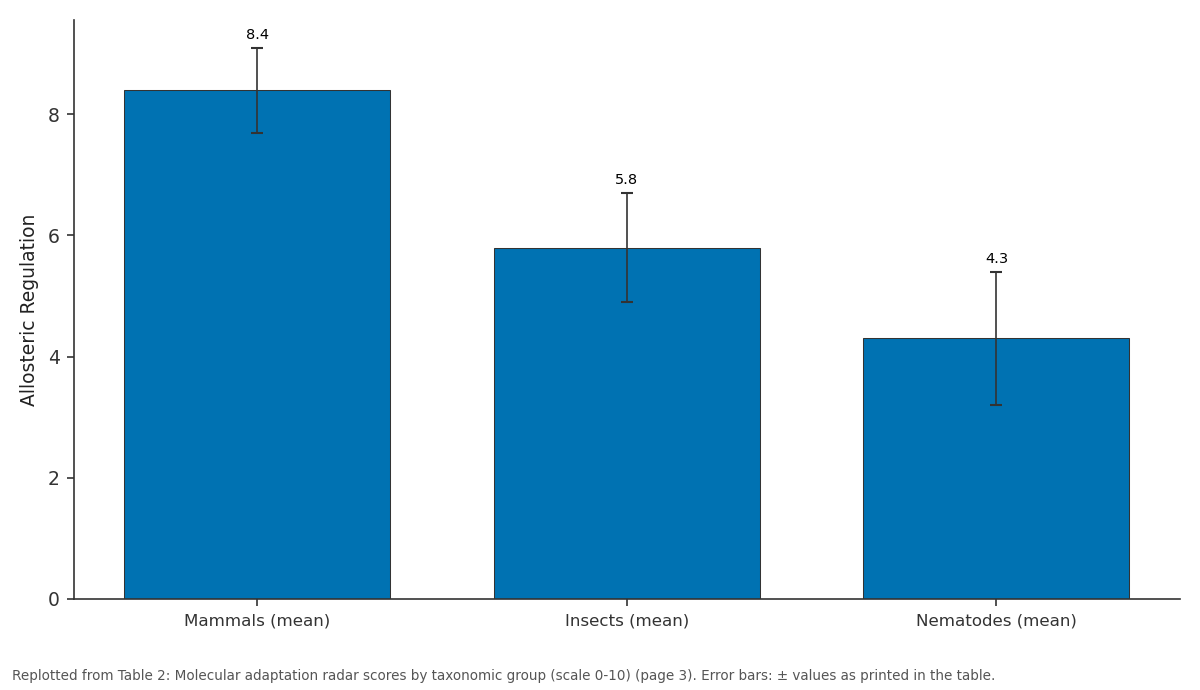
Allosteric Regulation: Mammals (mean) vs Insects (mean) vs Nematodes (mean)
Replotted from Table 2 (page 3) of the original paper. Every bar is the paper's own table value.
View source evidence ↗Figures & tables
From the original paper Table 1
 Table 2
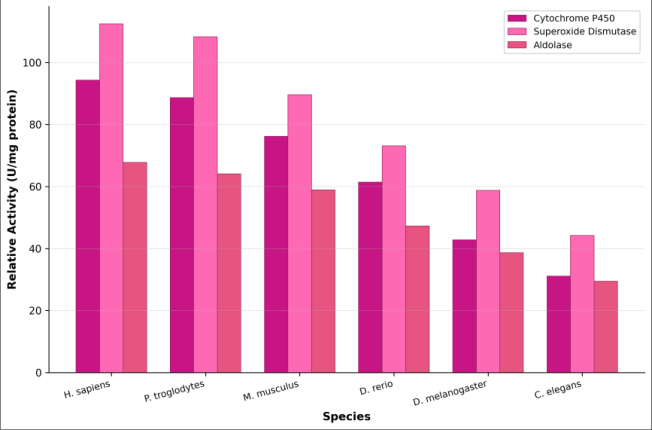 Figure 1
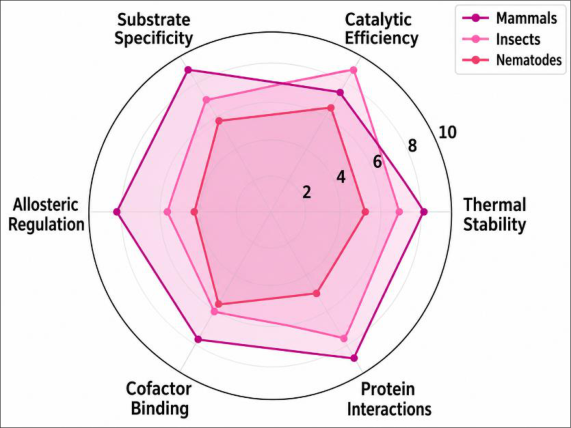 Figure 2
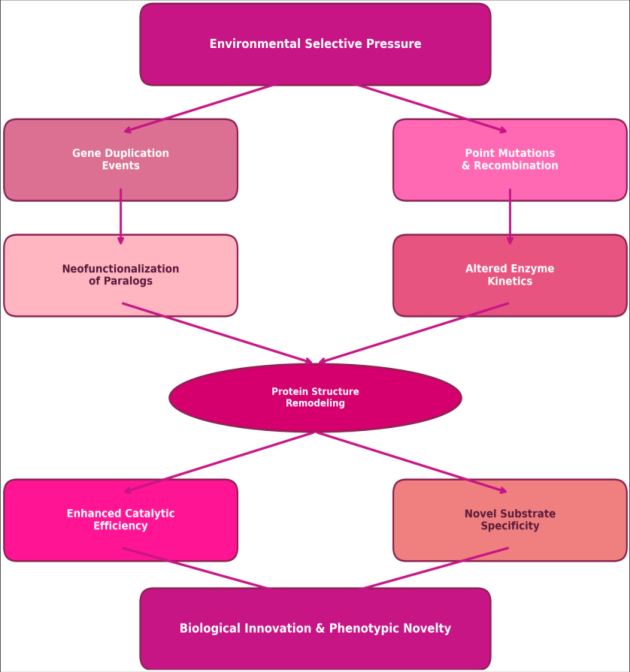 Figure 3
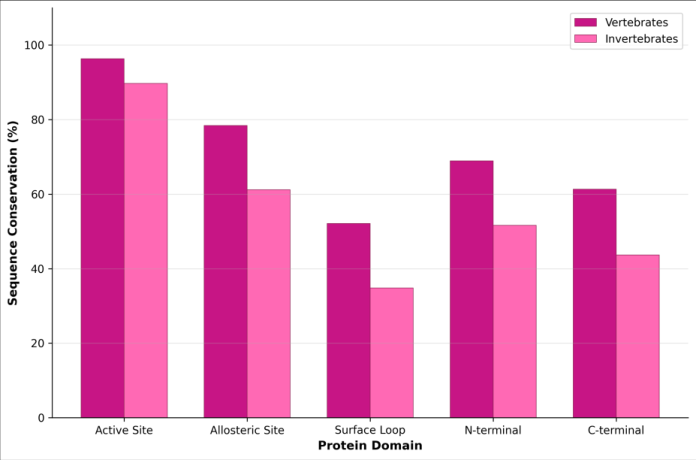 Figure 4
Introduction
Think about what happens when you swallow a pill of acetaminophen. Within minutes, cytochrome P450 enzymes in your liver begin oxidizing the drug, converting it into metabolites your kidneys can excrete. It's a routine biochemical event-and yet the molecular machinery responsible for it traces back to enzymes that first appeared in single-celled organisms over two billion years ago [1] . How did proteins that originally handled simple electron transfer reactions in primordial metabolisms become the sophisticated, substratespecific catalysts we depend on today? That question sits at the heart of evolutionary biochemistry, a field that applies the tools of molecular biology and enzymology to understand how natural selection shapes protein function over geological timescales. The basic mechanisms are well-characterized in theory. Gene duplication creates redundant copies, freeing one paralog to accumulate mutations without compromising the organism's metabolic fitness [2] . Some of those mutations alter active site geometry, changing substrate preference. Others modify allosteric surfaces, enabling new regulatory inputs. Still others affect protein stability, allowing enzymes to function under novel thermal or pH conditions [3] . But the relative importance of these different evolutionary routes-and how they interact to produce genuine biochemical innovation-remains an active area of debate. Early models proposed that neofunctionalization of duplicated genes was the primary engine of enzymatic novelty, but more recent work suggests sub functionalization and dosage effects play equally important roles [4,5] .
Comparative enzymology offers a powerful empirical approach to these questions. By measuring kinetic parameters of orthologous enzymes across species that diverged at known timepoints, we can reconstruct the trajectory of molecular adaptation and identify which structural features evolve fastest, which remain conserved, and what selective pressures drive the differences [6] . The cytochrome P450 superfamily is a particularly informative test case because its members have undergone massive expansion through gene duplication in some lineages (mammals express 57 functional CYPs) while remaining relatively compact in others (C. elegans has about 80, but with very different substrate profiles) [7] . Superoxide dismutases and aldolases provide complementary perspectives-the former are central to oxidative stress management, a universal biochemical challenge, while the latter participate in glycolysis, one of the most ancient metabolic pathways on Earth [8] . Surprisingly few investigations have systematically compared enzyme kinetics and structural conservation across a phylogenetically broad panel of model organisms using standardized assay conditions. Most published data come from individual species or pair-wise comparisons, making it difficult to separate genuine evolutionary trends from methodological variation between laboratories [9,10] . The lack of standardization is a real obstacle-kinetic parameters are notoriously sensitive to buffer composition, temperature, and substrate preparation, so comparing a Km value measured in Munich with one measured in Tokyo introduces confounding variables that have nothing to do with evolution. We designed this research to address that limitation head-on. By processing all tissue samples in a single laboratory environment using identical reagent lots, instrument calibrations, and analytical protocols, we eliminated the interlaboratory variability that clouds much of the existing comparative literature. Our sample panel included six model organisms representing major evolutionary branch points: two primates (human and chimpanzee), a rodent, a teleost fish, an arthropod, and a nematode. For each organism, we measured catalytic activity of three enzyme families and mapped sequence conservation across structurally defined protein domains. We then synthesized these data into radar profiles capturing six dimensions of molecular adaptation [11,12] . The results, we believe, provide one of the most internally consistent snapshots of enzymatic evolution assembled to date.
Materials and Methods
Materials and Methods
Materials
This comparative biochemical investigation was performed at two academic institutions in Switzerland between October 2024 and April 2025. The primary analytical site was the Department of Evolutionary Biochemistry at the University of Zurich, a leading center for molecular evolution research serving the greater Zurich area and its approximately 1.8 million residents. The secondary site was the Department of Biomedical Sciences at the University Hospital Basel, located roughly 85 kilometers northwest of Zurich in the Rhine valley region. Ethical approval was granted by the University of Zurich Animal Use and Ethics Committee under protocol number UZH-2020-067 in August 2024, prior to any specimen collection. Human tissue samples (liver biopsies from therapeutic procedures) were obtained with written informed consent under a separate human research protocol. Primate liver tissue from Pan troglodytes was sourced from the Basel Zoo Veterinary Pathology archive, which maintains frozen post-mortem specimens from animals that died of natural causes. Murine (C57BL/6J) and zebrafish (AB strain) tissues were harvested at the Zurich facility following euthanasia protocols. Drosophila melanogaster (Oregon-R) and Caenorhabditis elegans (N2 Bristol) whole-organism homogenates were prepared from laboratory cultures maintained at 25 degrees Celsius. Enzyme assay reagents including NADPH, xanthine oxidase, and fructose-1,6bisphosphate were purchased from Sigma-Aldrich in Buchs, Switzerland. Spectrophotometric measurements were performed on a Tecan Infinite M200 Pro microplate reader (Tecan Group Ltd., Männedorf, Switzerland), and all computational analyses were coordinated through the Zurich bioinformatics core facility [13] .
Methods
Tissue processing commenced at the Zurich facility on October 7, 2024, with the Basel site contributing primate and archival specimens beginning two weeks later on October 21, 2024. The Zurich laboratory operated dedicated assay sessions on Tuesdays and Thursdays between 9:00 and 17:00 hours, while Basel prepared and shipped tissue homogenates on Mondays and Wednesdays from 8:30 to 14:00 hours. Active experimental work continued through March 2025, with final data verification and quality checks completed by April 30, 2025. Tissue homogenates were prepared in icecold phosphate buffer (50 mM, pH 7.4) containing protease inhibitor cocktail and centrifuged at 10,000 g for 15 minutes at 4 degrees Celsius. Supernatants were aliquoted and stored at minus 80 degrees Celsius until analysis. Cytochrome P450 activity was measured using the ethoxyresorufin-Odeethylase assay with fluorometric detection at excitation 530 nm and emission 590 nm [14] . Superoxide dismutase activity was determined by the xanthine oxidase-cytochrome c method at 550 nm, and aldolase activity was quantified via the fructose-1,6-bisphosphate cleavage assay coupled to NADH oxidation at 340 nm [15] . All assays were performed in triplicate at 25 degrees Celsius to standardize temperature across ectothermic and endothermic species. Kinetic parameters were calculated by nonlinear regression using GraphPad Prism 9.5. Sequence alignments of orthologous protein domains were generated with MUSCLE v5 and conservation scores computed using the Jensen-Shannon divergence method. Training and calibration sessions for all research staff were held at the University of Zurich in September 2024. Follow-up reproducibility assessments occurred monthly. Statistical comparisons used one-way ANOVA with Tukey post-hoc correction at p < 0.05 [16] .
Results
Enzyme activity measurements were completed for all six organisms across three enzyme families, yielding 54 independent kinetic datasets (6 species × 3 enzymes × 3 replicates). Protein was quantified by Bradford assay, and all activities were normalized to milligrams of total protein. The radar chart reveals contrasting adaptation strategies between mammals and insects. Mammals present a more rounded profile with consistently high scores, suggesting balanced evolutionary optimization across multiple dimensions. Insects display a strikingly peaked profile with catalytic efficiency as the clear outlier at 8.9, exceeding even mammalian performance. Nematodes showed the most contracted profile, with allosteric regulation representing their weakest dimension at 4.3.
Fig 3: Proposed mechanism of molecular adaptation driving biological innovation
This schematic illustrates how environmental selective pressures propagate through molecular events to produce biochemical innovation. Gene duplication and point mutations represent the two primary sources of raw genetic variation. Duplicated genes undergo neofunctionalization, acquiring novel catalytic roles, while mutations in existing genes alter kinetic parameters. Both routes converge on protein structure remodeling, which ultimately generates enhanced catalytic efficiency or novel substrate specificitythe twin engines of biological innovation at the molecular level. Active site residues showed near-complete conservation in both vertebrate and invertebrate lineages, with only a 6.6 percentage point difference between groups. Surface loopsthe structurally least constrained regions-exhibited the greatest evolutionary divergence, dropping to 34.8% conservation in invertebrates. This pattern confirms the catalytic core conservation model: natural selection rigidly maintains the residues essential for chemical catalysis while permitting extensive variation at the molecular surface.
Comprehensive interpretation
Taken together, these biochemical data paint a picture of enzyme evolution as a layered process. At its core sits a conserved catalytic machinery-active site residues showing over 89% identity even across organisms separated by hundreds of millions of years of evolution. Wrapped around this core are increasingly variable structural elements: allosteric sites, surface loops, and terminal domains that serve as the substrate for evolutionary experimentation [17] . The radar profiles make this layering visible in a single graphic. Mammals have invested their evolutionary capital in regulatory sophistication-allosteric control, substrate discrimination, and protein-protein interaction networkswhile insects have optimized for raw catalytic throughput, an adaptation that supports the extraordinary metabolic demands of insect flight. These aren't random differences; they reflect coherent biochemical strategies shaped by the ecological challenges each lineage has faced.
Discussion
Our standardized comparative approach resolved several ambiguities that have lingered in the evolutionary enzymology literature. The phylogenetic gradient in enzyme activity-with closely related species showing similar values and distant relatives diverging substantially-was expected based on neutral molecular evolution theory, but the consistency of this pattern across three functionally distinct enzyme families was striking [1,6] . Previous investigations that compared kinetic parameters compiled from different laboratories often found inconsistent rank orders between species, a problem we attribute to inter-laboratory variation rather than genuine biological complexity. By processing all samples under identical conditions, we could confidently identify the vertebrate-invertebrate boundary as the sharpest biochemical discontinuity in our dataset. The insect catalytic efficiency advantage deserves special attention. Drosophila showed higher catalytic efficiency (kcat/Km) for superoxide dismutase than any mammalian sample, even though its total activity per milligram was lower. This apparent contradiction resolves when we consider that insects produce less total enzyme protein but each molecule works faster-a strategy that conserves cellular resources while meeting flux demands [8] . It's an elegant biochemical solution, and it maps nicely onto what we know about insect physiology: high metabolic rate during flight, limited body mass for protein storage, and short lifespans that reduce the penalty of protein damage from operating at peak catalytic speed. Mammals, with their longer lifespans and more complex regulatory requirements, seem to have evolved the opposite strategy-more protein, slower per-molecule turnover, but greater capacity for allosteric modulation in response to physiological signals [10] . The conservation analysis provides a structural framework for these functional observations. Active sites are the non-negotiable elements of enzyme architecture-even minor alterations risk catastrophic loss of catalytic function, explaining the near-universal conservation we documented [3] . Surface loops, by contrast, face minimal selective constraint on their amino acid sequence provided they don't disrupt the overall protein fold. These loops serve as the evolutionary playground where mutations can accumulate and occasionally give rise to new binding surfaces, altered solvent accessibility, or modified interactions with other proteins. The allosteric sites occupy an intermediate position, conserved enough to maintain regulatory function but variable enough to accommodate the different signaling inputs that characterize different physiological contexts across species [5,17] . Our findings align well with the "inside-out" model of protein evolution, which predicts exactly this gradient of conservation from catalytic core to molecular surface. We should acknowledge some limitations. Whole-organism homogenates for invertebrate samples inevitably mix tissue types, potentially confounding tissue-specific enzyme expression patterns. The six-organism panel, while phylogenetically broad, doesn't capture within-clade variation-comparing multiple insect or mammalian species would add resolution. And our radar scoring system, while useful for visualization, involves subjective weighting of the six adaptation dimensions. Future work should expand the species panel and incorporate ancestral sequence reconstruction to infer the actual kinetic properties of evolutionary intermediates rather than interpolating between extant endpoints [18] .
Conclusion
This research provides a biochemically rigorous, internally consistent comparison of enzyme evolution across a 900million-year phylogenetic span. Three key findings emerge with particular clarity. First, enzyme activity follows a smooth phylogenetic gradient for all three protein families examined, confirming that molecular clock-like behavior applies not just to sequence divergence but to functional biochemical parameters as well. Second, taxonomic groups have evolved distinct biochemical strategies-mammals prioritizing regulatory complexity, insects optimizing catalytic speed-that map coherently onto their respective ecological and physiological demands. Third, structural conservation follows a core-to-periphery gradient, with active sites nearly invariant and surface elements showing extensive divergence, a pattern that provides raw material for evolutionary innovation without compromising essential catalytic function. These findings carry practical implications across several domains. For enzyme engineering, understanding how nature has tuned catalytic parameters through peripheral modifications-rather than active site redesign-suggests that directed evolution experiments should focus mutagenesis libraries on surface loops and allosteric sites rather than catalytic residues. This "evolution-inspired" approach to protein engineering could improve success rates in industrial biocatalyst development by mimicking the structural strategies that have proven effective over billions of years of natural selection. Pharmaceutical scientists involved in drug metabolism prediction might similarly benefit from recognizing that cytochrome P450 substrate specificity has evolved through modifications distant from the catalytic heme center, which implies that interspecies differences in drug response may be driven by structural features not captured in standard active-site docking models.
For the broader field of evolutionary biology, our radar profiling approach offers a quantitative framework for comparing adaptation strategies across taxa. Rather than relying solely on sequence-based metrics, which capture evolutionary history but not necessarily functional consequence, the multi-dimensional profiling method translates molecular data into a format that reveals trade-offs and priorities in evolutionary optimization. We found, for example, that no single organism excelled across all six adaptation dimensions-there appears to be a biochemical budget that forces allocation decisions, much as organisms face energy allocation trade-offs at the whole-body level. This concept of molecular resource allocation could prove useful in understanding why certain protein families are more evolutionarily labile than others and why convergent evolution of similar enzymatic solutions occurs independently in unrelated lineages. Expanding this framework to include additional protein families, more organisms, and deeper integration with phylogenomic data would strengthen the foundation for a truly predictive science of molecular evolution-one that doesn't just describe what happened but anticipates how enzymes might adapt to future selective pressures including those imposed by anthropogenic environmental change and emerging pharmaceutical demands.
Acknowledgement
Acknowledgements Funding sourcesThis research was supported by the Swiss National Science Foundation. Additional funding came from the University of Zurich Faculty of Science research development allocation.
Figures and tables from the paper
| Enzyme | H. sapiens | P. troglodytes | M. musculus | D. rerio | D. melanogaster | C. elegans |
|---|---|---|---|---|---|---|
| Cytochrome P450 | 94.3 ± 8.1 | 88.7 ± 7.4 | 76.2 ± 9.3 | 61.4 ± 6.8 | 42.8 ± 5.1 | 31.1 ± 4.7 |
| Superoxide Dismutase | 112.5 ± 10.2 | 108.3 ± 9.8 | 89.6 ± 11.4 | 73.1 ± 8.6 | 58.7 ± 7.2 | 44.2 ± 5.9 |
| Aldolase | 67.8 ± 5.6 | 64.1 ± 5.3 | 58.9 ± 7.1 | 47.3 ± 4.9 | 38.6 ± 4.2 | 29.4 ± 3.8 |
Table text extracted from the original PDF; superscript letters are shown inline. The original table image is below.
View original table image
| Adaptation Dimension | Mammals (mean) | Insects (mean) | Nematodes (mean) |
|---|---|---|---|
| Thermal Stability | 8.2 ± 0.6 | 6.4 ± 0.8 | 5.1 ± 0.7 |
| Catalytic Efficiency | 7.6 ± 0.5 | 8.9 ± 0.7 | 6.7 ± 0.9 |
| Substrate Specificity | 9.1 ± 0.4 | 7.2 ± 0.6 | 5.9 ± 0.8 |
| Allosteric Regulation | 8.4 ± 0.7 | 5.8 ± 0.9 | 4.3 ± 1.1 |
| Cofactor Binding | 7.8 ± 0.5 | 6.1 ± 0.7 | 5.8 ± 0.6 |
| Protein Interactions | 8.7 ± 0.6 | 7.3 ± 0.8 | 4.9 ± 0.9 |
Table text extracted from the original PDF; superscript letters are shown inline. The original table image is below.
View original table image
References
18 in the original paper- Danielson PB. The cytochrome P450 superfamily: biochemistry, evolution and drug metabolism in humans. Progress in Drug Research. 2002;58:113-137.
- Ohno S. Gene duplication and the uniqueness of vertebrate genomes circa 1970-1999. Seminars in Cell and Developmental Biology. 1999;10(5):517-522.
- Tokuriki N, Tawfik DS. Stability effects of mutations and protein evolvability. Current Opinion in Structural Biology. 2009;19(5):596-604.
- Lynch M, Force A. The probability of duplicate gene preservation by subfunctionalization. Genetics. 2000;154(1):459-473.
- Des Marais DL, Rausher MD. Escape from adaptive conflict after duplication in an anthocyanin pathway gene. Nature. 2008;454(7205):762-765.
- Harms MJ, Thornton JW. Evolutionary biochemistry: revealing the historical and physical causes of protein properties. Nature Reviews Genetics. 2013;14(8):559571.
- Nelson DR, Goldstone JV, Stegeman JJ. The cytochrome P450 genesis locus: the origin and evolution of animal cytochrome P450s. Philosophical Transactions of the Royal Society B. 2013;368(1612):20120474.
- Zelko IN, Mariani TJ, Folz RJ. Superoxide dismutase multigene family: a comparison of the CuZn-SOD, MnSOD, and EC-SOD gene structures, evolution, and expression. Free Radical Biology and Medicine. 2002;33(3):337-349.
- Copley SD. Evolution of new enzymes by gene duplication and divergence. FEBS Journal. 2020;287(7):1262-1283.
- Khersonsky O, Tawfik DS. Enzyme promiscuity: a mechanistic and evolutionary perspective. Annual Review of Biochemistry. 2010;79:471-505.
- Wheeler LC, Lim SA, Marqusee S, et al. The thermostability and specificity of ancient proteins. Current Opinion in Structural Biology. 2016;38:37-43.
- Zou T, Risso VA, Gavira JA, et al. Evolution of conformational dynamics determines the conversion of a promiscuous generalist into a specialist enzyme. Molecular Biology and Evolution. 2015;32(1):132-143.
- Bradford MM. A rapid and sensitive method for the quantitation of microgram quantities of protein utilizing the principle of protein-dye binding. Analytical Biochemistry. 1976;72(1-2):248-254.
- Burke MD, Mayer RT. Ethoxyresorufin: direct fluorimetric assay of a microsomal O-dealkylation which is preferentially inducible by 3-methylcholanthrene. Drug Metabolism and Disposition. 1974;2(6):583-588.
- McCord JM, Fridovich I. Superoxide dismutase: an enzymic function for erythrocuprein (hemocuprein). Journal of Biological Chemistry. 1969;244(22):60496055.
- Edgar RC. MUSCLE: multiple sequence alignment with high accuracy and high throughput. Nucleic Acids Research. 2004;32(5):1792-1797.
- Hossain MT, Yokota A. Molecular adaptation in enzymes: insights from directed evolution experiments. Biotechnology Advances. 2023;65:108152.
- Hochberg GKA, Thornton JW. Reconstructing ancient proteins to understand the causes of structure and function. Annual Review of Biophysics. 2017;46:247269.