
Research article · 2026 · Full text
International Journal of Geography Geology and EnvironmentPopulation growth and its impact on land use land cover: Mokokchung District, Nagaland
Volume 8(3) · Pages 37–43 · DOI: 10.22271/27067483.2026.v8.i3a.492 ↗
Research areasLand Use and Ecosystem ServicesGroundwater and Watershed AnalysisConservation, Biodiversity, and Resource Management
Abstract
Author-writtenRapid population growth and increasing pressure over natural resources have characterised the 21st century. Population growth has led to increasing demand for food, settlement, and social infrastructure, which led to overexploitation of natural resources. The study of LULC change detection becomes vital in this context to understand the level of resource exploitation. The study area of Mokokchung district has experienced remarkable population growth over the past few decades, which has far-reaching impact on the land use pattern of the district. The study area experiences a population growth of approximately 86.52 per cent during 1991-2021, which indicates a rapid growth of population in the district. For the study purpose, Landsat satellite images for the years 1991, 2001, 2011, and 2021 were analysed, and along with that, population data for the same years were obtained from the census of India and other statistical sources. To analyse the relationship between the two variables, Pearson's correlation method was employed. The finding revealed a strong relationship between the two variables, which highlights the growing impact of anthropogenic activities on land.
Summary
Source-checkedPlain-language reading of the full paper, prepared with AI and checked against the text. Each point links to the authors' own words.
Why it matters
- Population growth is a primary driver of environmental depletion because it increases the demand for food, housing, and social infrastructure. View evidence ↗
- Converting natural landscapes like forests and agricultural land into urban areas negatively affects biodiversity, soil quality, local climate, and water availability. View evidence ↗
- Mokokchung district has seen significant population growth in recent decades, which has notably altered its land use patterns. View evidence ↗
The question
- The study aims to determine the correlation between population growth and land use land cover (LULC) changes in the Mokokchung district of Nagaland. View evidence ↗
What they did
- The researchers used Landsat 4 (1991), Landsat 5 (2001, 2011), and Landsat 8 (2021) satellite imagery to analyze LULC changes. View evidence ↗
- Satellite images were processed using supervised image classification with the Maximum Likelihood Classification (MLC) algorithm. View evidence ↗
- Population data from the Census of India and other sources were analyzed alongside LULC data using Pearson's correlation method. View evidence ↗
What they found
- Mokokchung district experienced a rapid population growth of approximately 86.52% between 1991 and 2021. View evidence ↗
- Built-up areas grew consistently from 32 km² in 1991 to 129 km² in 2021, representing a 75% increase. View evidence ↗
- Dense vegetation cover fluctuated over the study period, starting at 946 km² in 1991 and sharply declining to 503 km² by 2021. View evidence ↗
- There is a strong positive correlation (rho = 0.514) between population growth and the expansion of built-up areas, indicating urban sprawl. View evidence ↗
- Population growth showed a positive correlation (rho = 0.705) with the increase in barren land. View evidence ↗
- Population growth is negatively correlated with dense vegetation (rho = -0.533), agricultural land (rho = -0.464), and water bodies (rho = -0.273). View evidence ↗
What it means
- The authors conclude that it is essential to maintain a proper balance between population growth and land use land cover transformation. View evidence ↗
- The authors recommend periodic and systematic LULC assessments to provide policymakers with the data needed for effective resource management strategies. View evidence ↗
Visual summary
1 visualsIllustrations explain the paper; charts are replotted from the paper's own table values.
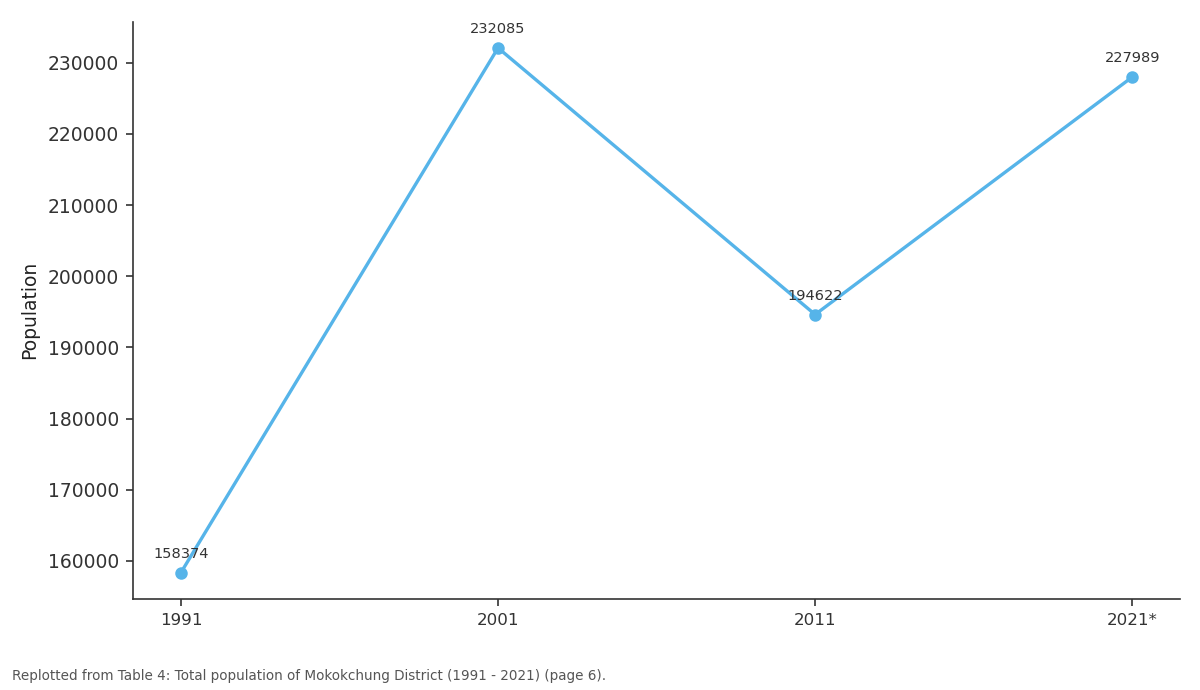
Population: 1991 vs 2001 vs 2011 vs 2021*
Replotted from Table 4 (page 6) of the original paper. Every bar is the paper's own table value.
View source evidence ↗Figures & tables
From the original paper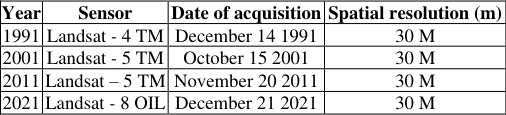 Table 1
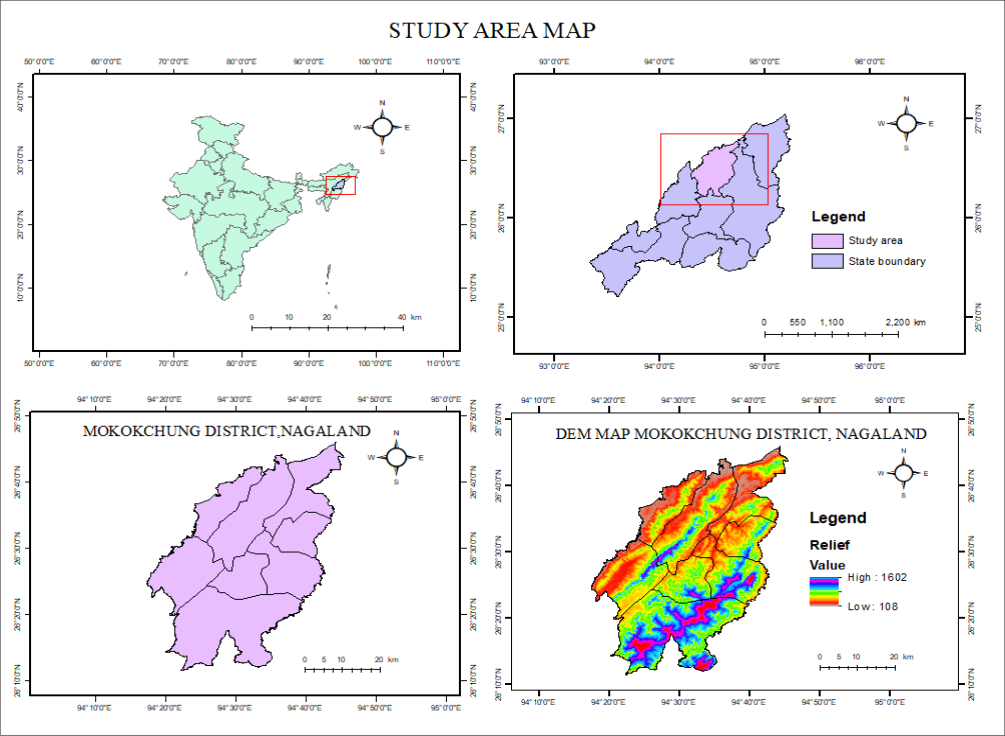 Figure 1
 Table 2
 Table 3
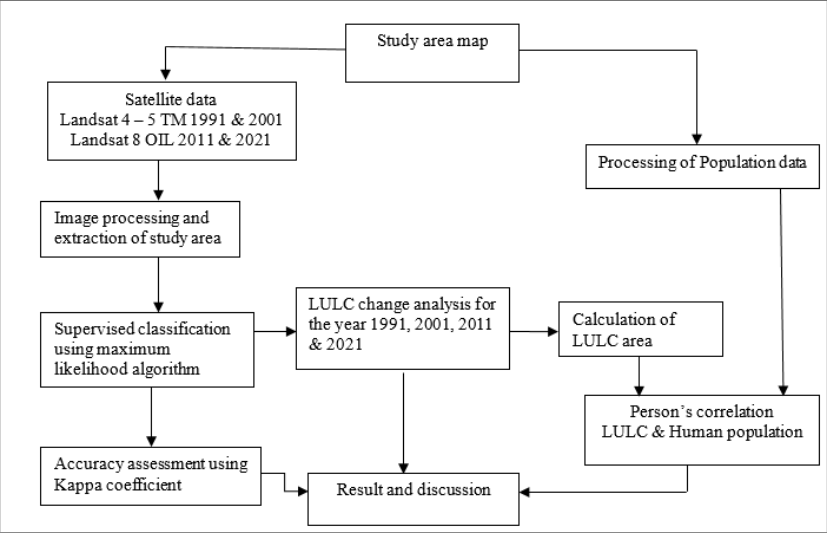 Figure 2
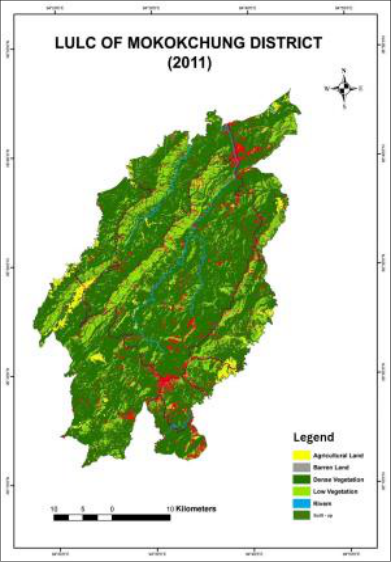 Figure 3
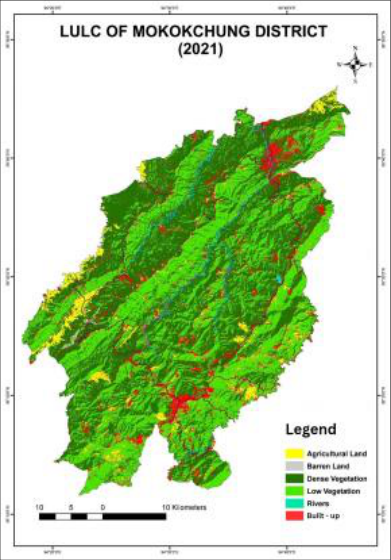 Figure 3
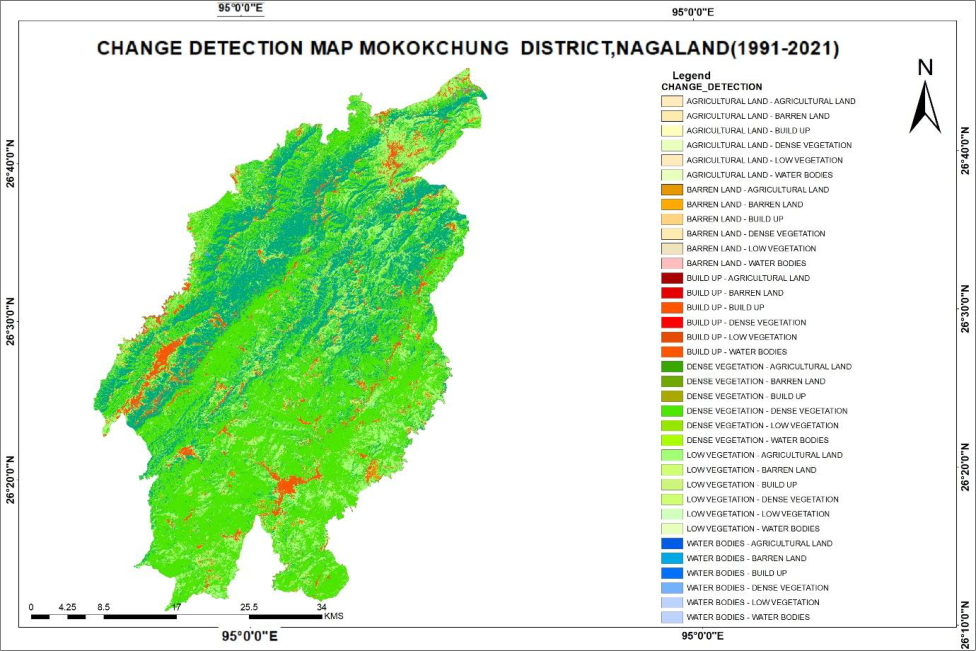 Figure 4
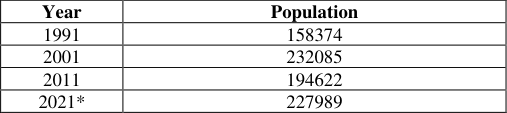 Table 4
 Table 5
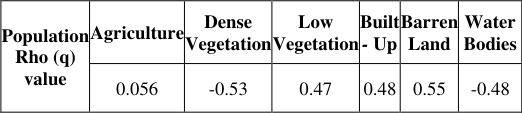 Table 6
Introduction
Population growth emerges as one of the main drivers of environmental depletion in the present context, as it triggers demand for space, food production, settlement areas, and other necessary social infrastructure. This escalating pressure often leads to the conversion of natural landscape into man-made structures (agricultural land, settlements, and built-up areas). Such growing changes in land use and land cover illustrate the correlation between population growth and anthropogenic alteration of the environment, which makes population growth a key driver in comprehending spatial and environmental conversion. Alteration in LULC has significant consequences on ecological stability and sustainable development. The conversion of forest, agricultural land, and open space into urban and semi-urban areas has far-reaching impacts on the quality of soil, water availability, local climate, and biodiversity. Examining the relationship between these two variables elucidates the impact of anthropogenic activities on land systems over time. Human needs continue to expand over time, and to fulfil these needs, humans have to a great extent explored the inaccessible land, which has brought a drastic change to the land use and land cover classes. Throughout the years, built-up areas have undergone swift expansion, whereas, on the other hand, forest cover has consistently declined across the globe. The combined impact of population growth and economic development over the past few centuries has exacerbated human strain on land resources, and the prevailing trends indicate that such situations are likely to persist in the future. The present study aims to examine the correlation between population growth and LULC change in the Mokokchung district of Nagaland. To achieve the desired objective, satellite imagery for the years 1991, 2001, 2011, and 2021 was analysed to evaluate the spatial-temporal changes in different LULC classes over the decades. Population data for the same years were obtained from the Census of India and different statistical data sources. The finding discloses a significant decrease in dense vegetation cover alongside a considerable increase in built-up areas during the study period. This change reflects the influence of population growth and evolving socio-economic conditions, which collectively play a crucial role in transforming the land use pattern of the district.
Study area
The Naga Hills, a discontinuous continuation of the eastern Himalayan Mountains, encompass the hill ranges where the district of Mokokchung is situated. The hill ranges extend from northeast to southwest, running approximately parallel to one other. The average elevation of the hills above mean sea level varies from 1,000 to 1,200 meters. Mokokchung, situated at an elevation of 1,326 meters above mean sea level, functions as the district headquarters. The district is partitioned into six principal ranges. Asetkong, Jangpetkong, Japukong, Langpangkong, Ongpangkong, and Tsurangkong are included. The trajectories of Jangpetkong and Japukong are almost parallel. The easternmost range is Langpangkong, the southernmost is Ongpangkong, and the central range is Asetkong. The hill ranges on the eastern side of the district are generally of higher elevation than those on the western side. The region is predominantly enveloped in dense jungles and deciduous trees, which yield substantial fuel and timber. The principal occupation of the residents is agriculture, with paddy being the predominant crop cultivated in the valley region. The primary food of the population consists of rice.
Classification of satellite image
Satellite image categorisation follows a systematic and structured pipeline which aims to convert raw satellite images into relevant LULC data. Supervised image classification was employed to classify the satellite images. The Maximum Likelihood Classification (MLC) algorithm has been applied for all the study years.
Firstly, the sample data which represents each of the LULC classes were selected after which the image processing software was assigned to learn the samples and label all the pixels based on the spectral characteristics. The study employs six LULC classes, which are classified below.
Accuracy assessment
To assess the accuracy of the LULC map derived from the Landsat image, 30 reference points were chosen using stratified random sampling techniques. The chosen reference points were substantiated the image Kappa coefficient statistic was employed to examine the reliability between User Accuracy (UA), Producer Accuracy (PA), and Overall Accuracy (OA). For accuracy assessment the following equations were used Overall Accuracy = Over the study period, built-up area demonstrates the most consistent growth, with over 75% growth in built-up areas over the past decades. Low vegetation cover also exhibits expansion in area by over 42.47% during the same period. Dense vegetation cover records a decline of approximately 88.07% during the same period. This showcases the combined influence of population growth and growing anthropogenic activities on the LULC dynamics of the study area.
Change detection
The objective of change detection is to compare spatial representation of two points in time by controlling all variances caused by differences in variables that are not of interest and to measure change caused by differences in the variable of interest (Green et al. 1994) [5] . Change detection is essential as it helps in analysing spatial and temporal
Correlation between population growth and land use and land cover change
Population growth remains as one of the main drivers for LULC change as growing population creates increasing demand for resources, which significantly impacts the environment and socio-economic structure of a given place. To examine the relationship between population growth and LULC change, Pearson's correlation coefficient, rho (ρ), was employed. The correlation matrix reflects a strong relationship between population growth and different LULC classes. Built-up area exhibits a strong positive correlation with population growth with rho (ρ) = 0.514, which highlights a close relation between increasing population and urban sprawling. A positive correlation was observed between population and barren land with rho (ρ) = 0.705. This correlation is attributed to deforestation, which is driven by the practice of Jhum cultivation, road construction, fuel wood extraction, and social infrastructural expansion. Similarly, low vegetation cover shows positive correlation with rho (ρ) = 0.416, which is mainly due to decrease in Jhum cycle, deforestation, and settlement expansion. Conversely, dense vegetation cover, agricultural land, and water bodies shows a negative correlation with population growth with correlation rho (ρ) = -0.533, -0.464, and -0.273 respectively. This inverse correlation shows that increasing pressure of population growth contributes to decline in dense vegetation cover and degradation or encroachment of water bodies within the study area. Decline in agricultural land is driven by factors such as urban expansion, social infrastructural growth, and shift in socio-economic preferences.
Conclusion
The study was conducted in Mokokchung district of Nagaland, which is one of the rapidly developing districts of the state. The study employs Geospatial techniques to examine the dynamics of LULC along with population data to evaluate the inter-relationship between the two variables. The finding reveals a substantial and measurable change in LULC during the study period (1991-2021). The analysis reflects that population growth positively correlates with built-up areas, barren land, and low vegetation cover whereas dense vegetation, agricultural land, and water bodies exhibit a negative correlation. Built-up and barren land exhibit a stronger association with population growth, with a correlation coefficient rho (ρ) of 0.514 and 0.705 respectively suggesting increasing demand for housing, infrastructure, and related development activities with growing population, which led to environmental degradation and expansion in barren land.
Population growth is dynamic in nature and despite efforts being made to regulate this, it becomes impossible to completely control population growth. Therefore, it becomes important that a proper balance between population growth and LULC transformation is essential. A periodic and systematic LULC assessment along with accurate data is crucial for informed decision making. Such analysis will help policymakers and resource planners in formulating effective strategies for resource management.
Figures and tables from the paper
| Year | Sensor | Date of acquisition | Spatial resolution (m) |
|---|---|---|---|
| 1991 | Landsat - 4 TM | December 14 1991 | 30 M |
| 2001 | Landsat - 5 TM | October 15 2001 | 30 M |
| 2011 | Landsat – 5 TM | November 20 2011 | 30 M |
| 2021 | Landsat - 8 OIL | December 21 2021 | 30 M |
Table text extracted from the original PDF; superscript letters are shown inline. The original table image is below.
View original table image
| LULC class | Class description |
|---|---|
| Agriculture land | plantation, shifting cultivation area |
| Dense vegetation cover | Reserved and conserved area, semi evergreen and deciduous forest |
| Low vegetation cover | Sparse vegetation, ground cover percentage, scrub forest |
| Built - up areas | Settlement area (rural and urban), road, different social infrastructure |
| Water bodies | Rivers, ponds, fisheries, wetlands etc. |
| Barren land | Fallow land, extremely low vegetation cover. |
Table text extracted from the original PDF; superscript letters are shown inline. The original table image is below.
View original table image
| Year | Population |
|---|---|
| 1991 | 158374 |
| 2001 | 232085 |
| 2011 | 194622 |
| 2021* | 227989 |
Table text extracted from the original PDF; superscript letters are shown inline. The original table image is below.
View original table image
References
10 in the original paper- Barana B, Toma S, Bajigo A. Population growth and environmental changes: conclusions drawn from the contradictory experiences of developing countries. International Journal of Environmental Monitoring and Analysis. 2020;8(5):161-169. DOI:10.11648/j.ijema.20200805.15
- Bora R, Bora AK. Population pressure and changing land use land cover in Morigaon district, Assam, India: a geospatial analysis. Indian Journal of Science and Technology. 2024;17(24):2547-2556. DOI:10.17485/IJST/v17i24.899
- Gogoi PP, Vinoj V, Swain D, Roberts G, Dash J, Tripathy S. Land use and land cover change effect on surface temperature over Eastern India. Scientific Reports. 2019;9(1):1-10.
- Green K, Kempka D, Lackey L. Using remote sensing to detect and monitor land cover and land use change. Photogrammetric Engineering and Remote Sensing. 1994;60:331-337.
- Islam K, Jashimuddin M, Nath B, Nath TK. Land use classification and change detection by using multitemporal remotely sensed imagery: the case of Chunati Wildlife Sanctuary, Bangladesh. Egyptian Journal of Remote Sensing and Space Science. 2018;21(1):37-47.
- Jamir S, Zulumanen, Yaden S. A study of population growth in Mokokchung district, Nagaland. Gradiva. 2025;11:278-284.
- Khan N, Raza M, Shakoor MSA, et al. Dynamic of population growth and its effect on land use/land cover of Bahraich district in Uttar Pradesh. Journal of Environmental Studies and Sciences. 2023;13:124-140. DOI:10.1007/s13412-022-00805-6
- Lillesand TM, Kiefer RW. Remote sensing and image interpretation. New York: Wiley; 1994.
- Long H, Tang G, Li X, Heilig GK. Socio-economic driving forces of land-use change in Kunshan, the Yangtze River Delta economic area of China. Journal of Environmental Management. 2007;83(3):351-364.
- Pongen L, Jamir S, Rawat MS, Yaden S. Analyzing land use and land cover changes and its dynamics in Mokokchung district, Nagaland. International Journal of Scientific Research in Science, Engineering and Technology. 2025;12:214-220. DOI:10.32628/IJSRSET2512111