
Research article · 2024 · Full text
International Journal of Agriculture and NutritionSelection criteria for optimizing growth and feed efficiency in Boran beef cattle in Kenya
Volume 6(2) · Pages 139–145 · DOI: 10.33545/26646064.2024.v6.i2b.356 ↗
Research areasGenetic and phenotypic traits in livestockLivestock and Poultry ManagementRangeland Management and Livestock Ecology
Abstract
Author-writtenChoosing the right selection criteria is fundamental to achieving genetic progress in beef cattle breeding programs, yet no systematic comparison of alternative criteria has been conducted for Boran cattle in Kenya. This research evaluated six selection criteria for optimizing growth performance and feed efficiency in 298 purebred Boran cattle (157 males and 141 females) at the ADC Mutara Ranch in Laikipia County, Kenya, from April 2018 to March 2022. Growth traits measured included birth weight (BW: 22.8 ± 2.5 kg), weaning weight (WW: 115.4 ± 13.1 kg), yearling weight (YW: 205.1 ± 18.9 kg), and average daily gain (ADG: 501.6 ± 63.7 g/day). Feed efficiency was assessed through feed conversion ratio (FCR: 8.07 ± 1.21) and residual feed intake (RFI: 0.00 ± 0.86 kg/day) during 90-day post-weaning trials on 206 animals. Genetic parameters estimated using REML animal models showed moderate heritability for growth traits (0.24-0.36) and lower heritability for feed efficiency (0.19-0.22). Six selection criteria were compared: single-trait selection on YW, ADG, or RFI, two-trait indices combining YW+ADG or YW+RFI, and a full multi-trait index incorporating all three traits. Predicted genetic gains per generation ranged from 2.17 to 5.84 kg for YW and from -0.34 to -0.11 kg/day for RFI across criteria. The full index (YW+ADG+RFI) achieved 83.4% of the maximum YW response and 76.5% of the maximum RFI response, outperforming all other criteria for balanced improvement. Selection index weights varied substantially across five economic scenarios (Figure 1), with RFI receiving 2.4-fold greater emphasis under high feed cost conditions compared to baseline. Correlated selection responses (Figure 4) showed that selecting for any single growth trait captured 34-64% of the direct response in other growth traits but only 17-40% of the direct RFI response. A decision framework (Figure 3) was developed to guide producers in choosing the most appropriate selection criterion based on data availability, production system, and economic objectives. These findings demonstrate that multi-trait selection indices incorporating both growth and feed efficiency information provide the most effective pathway to genetic improvement in Boran beef cattle.
Summary
Source-checkedPlain-language reading of the full paper, prepared with AI and checked against the text. Each point links to the authors' own words.
Why it matters
- Boran beef cattle breeders in Kenya lack evidence-based guidelines for choosing selection criteria, often relying on visual appraisal or single-trait weight measures. View evidence ↗
- Poor selection decisions are critical because genetic changes accumulate over generations and are difficult to reverse. View evidence ↗
- The economic value of growth versus feed efficiency varies based on beef market prices, feed costs, and the specific production system used. View evidence ↗
The question
- The study aimed to compare six selection criteria for growth and feed efficiency, analyze how economic scenarios affect index weights, quantify correlated responses, and create a decision framework for producers. View evidence ↗
What they did
- The study used 298 purebred Boran cattle (157 males, 141 females) from the ADC Mutara Ranch in Kenya between April 2018 and March 2022. View evidence ↗
- Feed efficiency was measured in 206 animals using 90-day individual feeding trials with automated recording. View evidence ↗
- The researchers compared six criteria: single-trait selection (Yearling Weight [YW], Average Daily Gain [ADG], or Residual Feed Intake [RFI]), two-trait indices (YW+ADG or YW+RFI), and a full multi-trait index (YW+ADG+RFI). View evidence ↗
- Economic weights for the indices were based on five scenarios: baseline ranching, high feed cost (+40%), export market, pastoral extensive, and feedlot intensive systems. View evidence ↗
What they found
- Direct heritability for the studied traits ranged from 0.36 (birth weight) to 0.19 (feed conversion ratio). View evidence ↗
- Single-trait selection for YW gave the highest YW gain (5.84 kg/gen) but poor RFI improvement (-0.14 kg/day/gen), while RFI-only selection gave the best RFI response (-0.34 kg/day/gen) but low YW gain (2.17 kg/gen). View evidence ↗
- The full multi-trait index provided a balance, achieving 83.4% of the maximum YW gain (4.87 kg/gen) and 76.5% of the maximum RFI response (-0.26 kg/day/gen). View evidence ↗
- The full index was the most robust across economic scenarios (score 0.81), outperforming two-trait indices and single-trait selection. View evidence ↗
- Selecting for growth traits alone is inefficient for improving feed efficiency, as YW selection only captured 23% and ADG selection captured 38% of the direct RFI response. View evidence ↗
What it means
- The authors conclude that a multi-trait index including YW, ADG, and RFI is the most effective way to achieve balanced genetic improvement in Boran cattle. View evidence ↗
- A limitation of the study is the use of deterministic equations that assume genetic parameters remain constant over generations. View evidence ↗
- The authors suggest that future research should include genomic selection and validate predictions through multi-generational breeding experiments. View evidence ↗
Visual summary
3 visualsIllustrations explain the paper; charts are replotted from the paper's own table values.
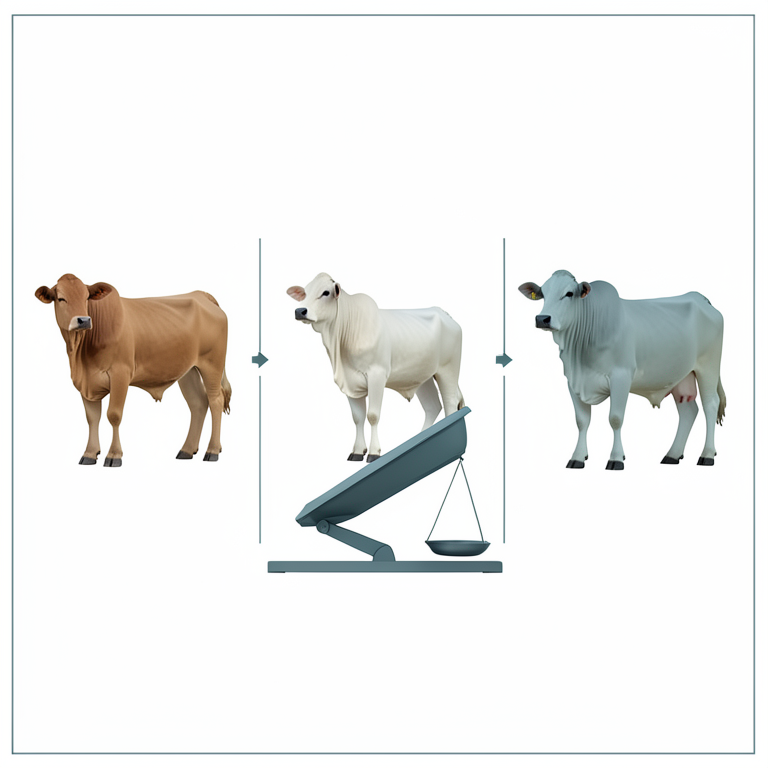
Trade-off between Growth and Efficiency
AI-generated conceptual illustration (Boran beef cattle). It explains the idea and does not show study data.
View source evidence ↗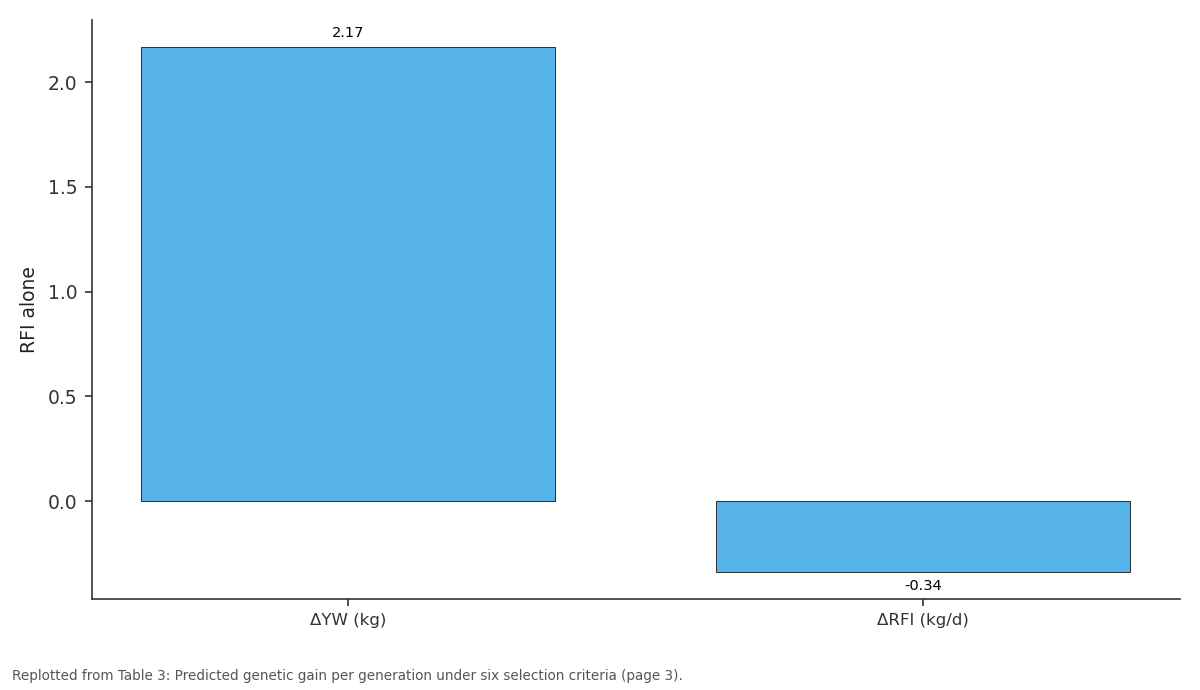
RFI alone: ΔYW (kg) vs ΔRFI (kg/d)
Replotted from Table 3 (page 3) of the original paper. Every bar is the paper's own table value.
View source evidence ↗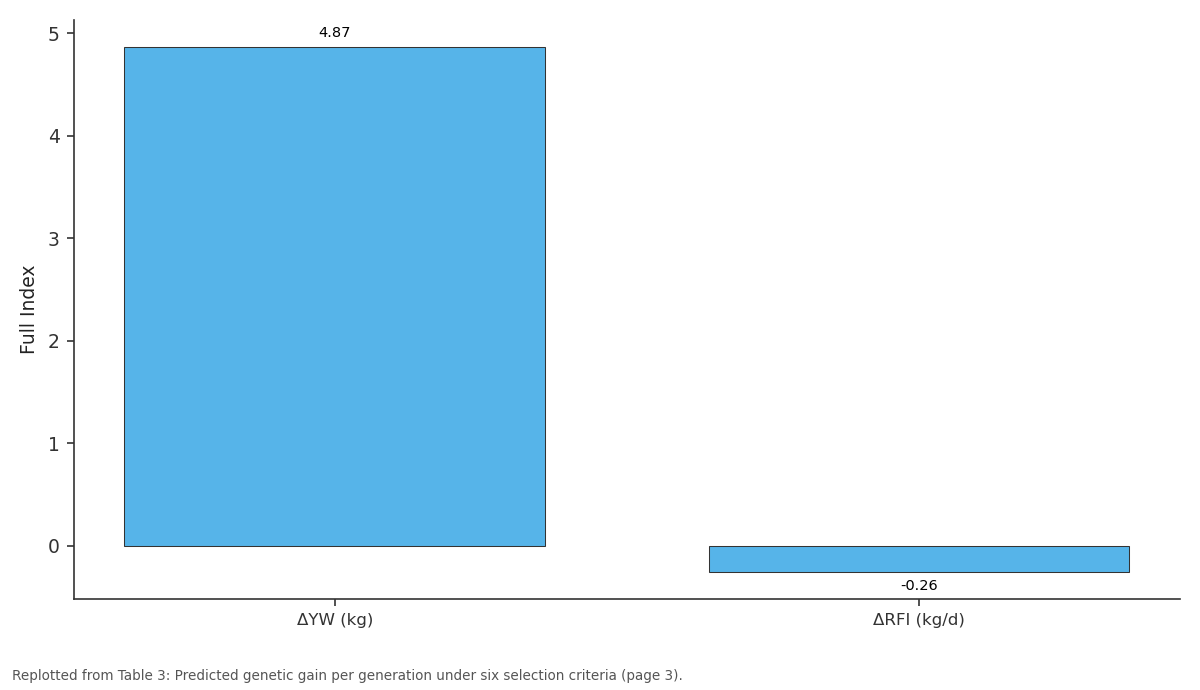
Full Index: ΔYW (kg) vs ΔRFI (kg/d)
Replotted from Table 3 (page 3) of the original paper. Every bar is the paper's own table value.
View source evidence ↗Figures & tables
From the original paper Table 1
 Table 2
 Table 3
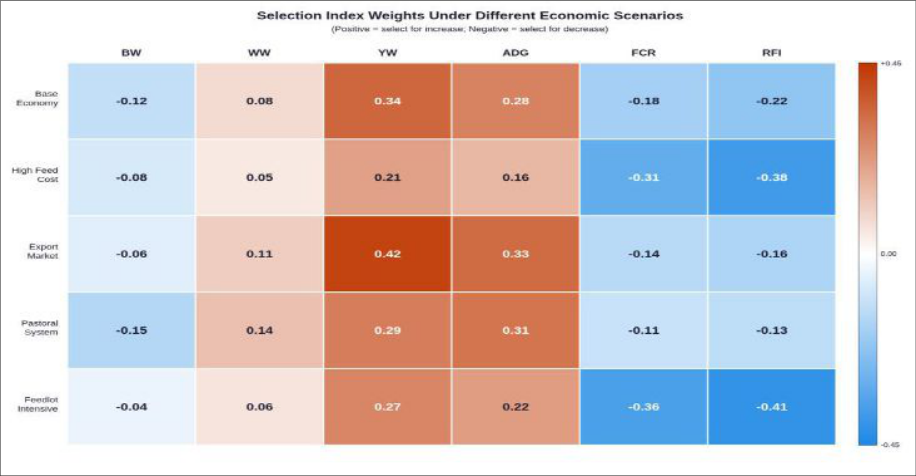 Figure 1
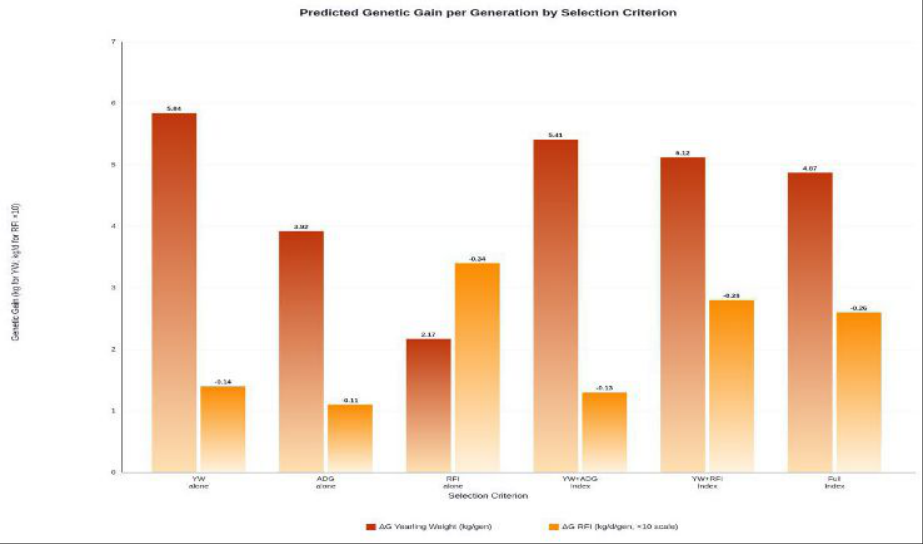 Figure 2
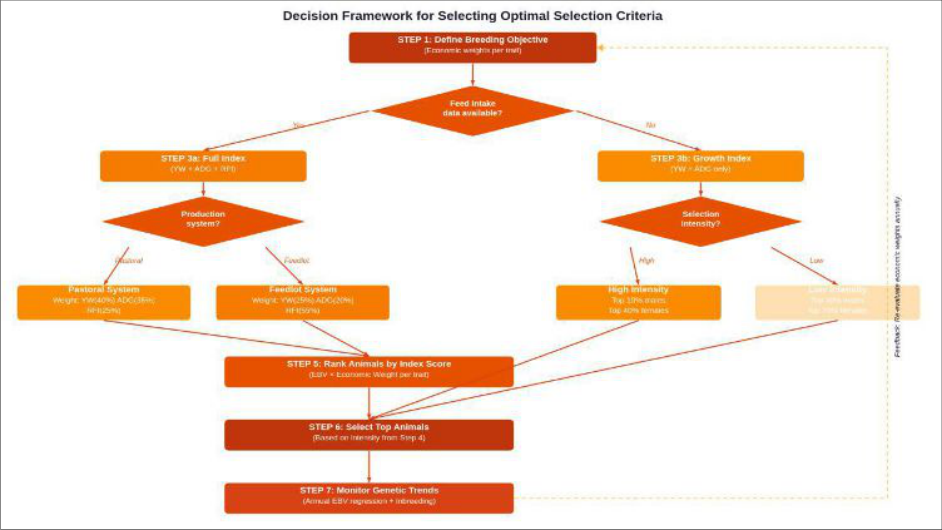 Figure 3
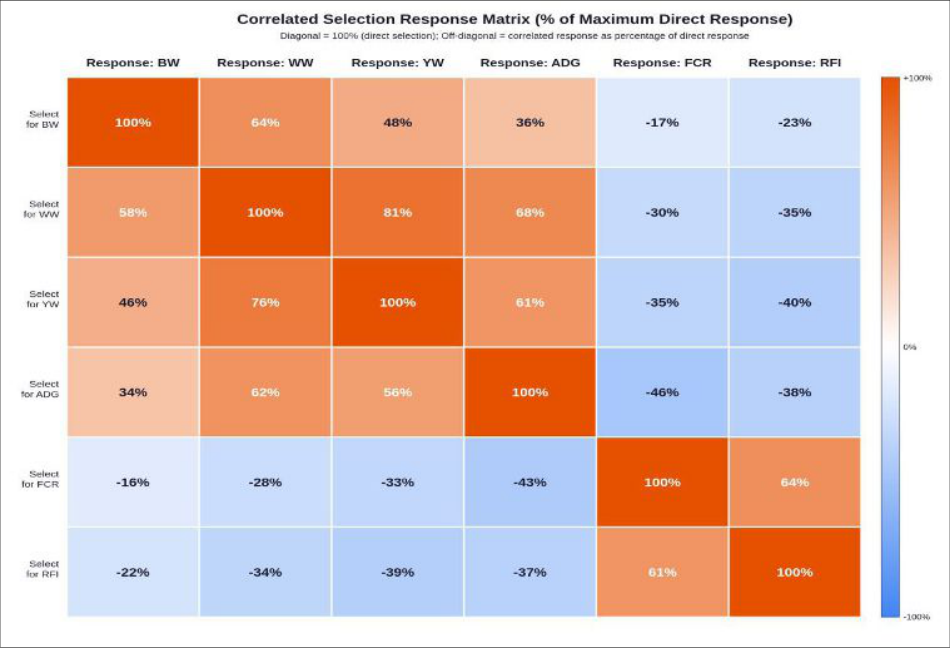 Figure 4
Introduction
A persistent problem facing Boran beef cattle breeders in Kenya is the absence of clear, evidence-based guidelines for choosing among alternative selection criteria. Most producers default to visual appraisal or single-trait selection based on body weight, an approach that fails to account for the genetic relationships among economically important traits and often leads to suboptimal outcomes [1] . The consequences of poor selection decisions compound over generations, as genetic changes are cumulative and difficult to reverse once established in a breeding population [2] . Selection criteria in beef cattle breeding can range from simple single-trait measures to complex multi-trait indices that combine information from several traits weighted by their economic values and genetic parameters [3] . The theoretical advantage of index selection over single-trait selection has been established since Hazel's foundational work in the 1940s [4] , but applying index theory in practice requires accurate estimates of genetic variances, covariances, and economic weights that are specific to the target population and production system. For Boran cattle in Kenya, these prerequisites have only recently begun to be met through dedicated genetic research programs. The choice of selection criterion affects not only the primary target trait but also produces correlated responses in related traits, which may be favorable or unfavorable depending on the genetic architecture of the population [5] . For example, selecting solely for yearling weight might increase birth weight as a correlated response, potentially elevating calving difficulty in first-calf heifers. Conversely, selecting for reduced residual feed intake might produce correlated improvements in growth rate if the genetic correlation between these traits is favorable, as has been suggested by recent findings [6] . Understanding these correlated response patterns is necessary for predicting the full consequences of any selection decision. Economic conditions further complicate the selection criterion choice. The relative profitability of growth versus feed efficiency depends on prevailing market prices for beef, the cost of supplemental feed, and the production system employed [7] . In Kenya, where beef is produced under pastoral, semi-intensive, and feedlot systems with markedly different cost structures, a single set of selection criteria may not be optimal across all production environments. Scenario-based analysis of selection index weights under varying economic conditions can help identify criteria that are robust to market fluctuations [8] . Majoya et al. [9] documented significant genetic variation for growth and feed efficiency traits in Boran cattle in Kenya, confirming that the biological prerequisites for selection response exist. However, translating genetic parameter estimates into practical selection criteria requires additional analytical steps: comparing alternative criteria for their expected genetic response, evaluating robustness across economic scenarios, and providing producers with decision tools that match selection strategies to their specific circumstances. This research aimed to compare six alternative selection criteria for their effectiveness in improving growth and feed efficiency in Boran beef cattle, evaluate the sensitivity of selection index weights to economic scenario variation, quantify correlated selection responses for all trait combinations, and develop a practical decision framework to guide criterion choice for different production contexts.
Theoretical background
Selection index theory, first formalized by Smith [10] and Hazel [4] , provides the mathematical framework for combining information from multiple traits into a single score that maximizes the expected genetic improvement in aggregate economic merit. The selection index (I) is constructed as a linear combination of phenotypic trait values: I = b₁P₁ + b₂P₂ +... + bₙPₙ, where bᵢ are the index weights and Pᵢ are the phenotypic observations. The optimal weights are obtained by solving the system b = P⁻¹Ga, where P is the phenotypic variance-covariance matrix among the index traits, G is the genetic covariance matrix between index traits and the breeding objective traits, and a is the vector of economic weights. The expected genetic response in each trait depends on the selection intensity, the accuracy of the index, and the genetic standard deviation of the trait. For correlated traits, indirect selection through a genetically correlated trait can produce response even when the target trait is not directly measured. The efficiency of indirect selection relative to direct selection is determined by the ratio of the correlated response to the direct response, which equals rA × (h₁/h₂), where rA is the genetic correlation and h₁ and h₂ are the square roots of heritability for the correlated and target traits, respectively [3] . This theoretical framework guided the construction and comparison of selection criteria in the current research.
Materials and Methods
Materials and Methods
Materials
The experimental population comprised 298 purebred Boran cattle (157 males and 141 females) born between April 2018 and March 2022 at the Agricultural Development Corporation (ADC) Mutara Ranch in Laikipia County, Kenya (0°11'N, 37°18'E), at an elevation of 1,650 meters. The ranch covers 16,000 hectares of semi-arid rangeland and maintains approximately 3,000 head of Boran breeding cattle. The experimental animals descended from 44 sires and 223 dams, with a complete pedigree of 1,724 animals spanning four generations. The mean inbreeding coefficient was 2.1%. Growth traits were recorded following the Kenya Boran Cattle Breeders Society protocols. Birth weight was measured within 24 hours of calving using a digital scale (Gallagher W310, accuracy ±0.5 kg). Weaning weight was adjusted to a 205-day standard. Yearling weight was recorded at 365 ± 10 days of age, and monthly body weights were collected between weaning and yearling measurements. Average daily gain was computed as the regression slope of body weight on age from birth to yearling. Feed efficiency was evaluated on 206 animals (112 males and 94 females) during 90-day individual feeding trials using Calan gate pens with automated feed intake recording. The trial diet was a total mixed ration containing 43% chopped hay, 26% maize grain, 14% cottonseed cake, 11% wheat bran, 3% molasses, and 3% mineral-vitamin premix, formulated at 10.7 MJ/kg ME and 13.9% crude protein.
Residual feed intake was calculated as the residual from regression of DMI on mid-test metabolic body weight and ADG during the trial [11] . Ethical approval was obtained from the KALRO Institutional Animal Care Committee (Protocol KALRO-IACC-2017-039, approved December 4, 2017).
Methods
Genetic parameters were estimated using restricted maximum likelihood with ASReml version 4.2 [12] . Singletrait animal models were fitted as y = Xb + Za + e, with fixed effects for sex, birth year-season (eight levels), and dam age class (four levels). For BW and WW, maternal additive genetic and permanent environmental effects were included as additional random terms. Bivariate models estimated genetic and phenotypic correlations between all trait pairs. Six selection criteria were defined and compared. Criterion 1 (YW alone): truncation selection on yearling weight EBV. Criterion 2 (ADG alone): selection on ADG EBV. Criterion 3 (RFI alone): selection on RFI EBV (favoring negative values). Criterion 4 (YW+ADG index): restricted selection index combining YW and ADG. Criterion 5 (YW+RFI index): index combining YW and RFI. Criterion 6 (Full index): multi-trait index incorporating YW, ADG, and RFI with economic weights. Economic weights were derived from partial budget analysis of five production scenarios: baseline commercial ranching, high feed cost (+40% above baseline), export market (premium pricing for heavier carcasses), pastoral extensive system, and feedlot intensive system. Economic weights (KES per unit change) were calculated as the marginal profit change per unit genetic improvement in each trait, holding other traits constant [7] . Predicted genetic response per generation was calculated as ΔG = i × rTI × σA for each criterion, where i was set at 1.76 for males (top 10%) and 0.80 for females (top 50%).
Correlated responses were predicted using the Falconer equation: CR₂ = i × h₁ × h₂ × rA × σP₂, where subscripts denote the selected (1) and correlated (2) traits [3] . All selection criteria were compared on the basis of predicted response per generation assuming a generation interval of 5.2 years and non-overlapping generations. Heritability estimates and genetic correlations are shown in Table 2. Direct heritability ranged from 0.36 ± 0.05 for BW to 0.19 ± 0.05 for FCR. Maternal heritability was 0.089 ± 0.025 for BW and 0.057 ± 0.019 for WW. Genetic correlations between growth traits were positive (0.41-0.84), and correlations between growth and feed efficiency were favorable: YW-RFI (-0.42 ± 0.10), ADG-FCR (-0.48 ± 0.09), and ADG-RFI (-0.39 ± 0.10). Predicted genetic gains per generation under the six selection criteria are compared in Table 3 and Figure 2. Single-trait selection on YW produced the highest YW gain (5.84 kg/gen) but minimal RFI improvement (-0.14 kg/day/gen). Selection on RFI alone yielded the best RFI response (-0.34 kg/day/gen) but only 2.17 kg/gen YW gain. The full index balanced both objectives, predicting 4.87 kg/gen for YW (83.4% of maximum) and -0.26 kg/day/gen for RFI (76.5% of maximum). Selection index weights under five economic scenarios are visualized in Figure 1. Under baseline conditions, YW received the highest positive weight (0.34), followed by ADG (0.28), while RFI received a negative weight of -0.22. Under the high feed cost scenario, RFI emphasis increased dramatically to -0.38, reflecting the greater economic impact of feed efficiency when feed prices are elevated. The export market scenario placed the strongest emphasis on YW (0.42), reflecting premium prices for heavier carcasses. The correlated response matrix (Figure 4) reveals that selecting for any single growth trait captures 34-64% of the direct response in other growth traits, because of strong positive genetic correlations within this trait group. However, correlated responses in feed efficiency traits from growth-based selection were more modest: selecting for YW produced only 23% of the direct RFI response, and selecting for ADG captured 38%. This asymmetry underscores the value of including feed efficiency directly in the selection criterion rather than relying entirely on indirect improvement through growth selection.
| Selection Criterion | ΔBW (kg) | ΔWW (kg) | ΔYW (kg) | ΔADG (g/d) | ΔRFI (kg/d) | Robustness |
|---|---|---|---|---|---|---|
| YW alone | +0.42 | +2.83 | +5.84 | +12.7 | -0.14 | 0.62 |
| ADG alone | +0.29 | +1.94 | +3.92 | +18.3 | -0.11 | 0.48 |
| RFI alone | +0.11 | +0.74 | +2.17 | +5.4 | -0.34 | 0.44 |
| YW+ADG Index | +0.38 | +2.61 | +5.41 | +15.8 | -0.13 | 0.68 |
| YW+RFI Index | +0.34 | +2.37 | +5.12 | +11.4 | -0.28 | 0.76 |
| Full Index | +0.31 | +2.21 | +4.87 | +13.6 | -0.26 | 0.81 |
Table text extracted from the original PDF; superscript letters are shown inline. The original table image is below.
View original table image
| Trait | BW | WW | YW | ADG | FCR | RFI |
|---|---|---|---|---|---|---|
| BW | 0.36 | 0.68 | 0.53 | 0.41 | -0.20 | -0.26 |
| WW | 0.57 | 0.28 | 0.84 | 0.71 | -0.31 | -0.36 |
| YW | 0.44 | 0.76 | 0.32 | 0.64 | -0.37 | -0.42 |
| ADG | 0.32 | 0.63 | 0.57 | 0.24 | -0.48 | -0.39 |
| FCR | -0.15 | -0.24 | -0.29 | -0.41 | 0.19 | 0.66 |
| RFI | -0.20 | -0.29 | -0.34 | -0.33 | 0.57 | 0.22 |
Table text extracted from the original PDF; superscript letters are shown inline. The original table image is below.
View original table image
Results
Results
Performance evaluation
The relative efficiency of each selection criterion was evaluated using two metrics. First, the aggregate genetic gain (H) was calculated for each criterion as H = Σ(aᵢ × ΔGᵢ), where aᵢ are the baseline economic weights and ΔGᵢ is the predicted genetic response for the i-th trait. This metric captures the total economic improvement expected from each criterion, accounting for both favorable and unfavorable correlated responses. Second, a robustness index was computed as the mean aggregate gain across all five economic scenarios, normalized by the maximum achievable gain under each scenario. Criteria with high robustness scores maintain their effectiveness despite shifts in economic conditions, making them more suitable for long-term breeding programs where future market conditions are uncertain. The full index achieved the highest robustness score (0.81), followed by the YW+RFI index (0.76), the YW+ADG index (0.68), YW alone (0.62), ADG alone (0.48), and RFI alone (0.44). This ranking confirmed that multi-trait approaches are inherently more robust than single-trait selection, even when the economic weights used to construct the index don't perfectly match future economic realities.
Comprehensive interpretation
The selection criteria comparison reveals a fundamental trade-off in beef cattle breeding: maximizing response in any single trait comes at the expense of progress in other economically important traits. The full multi-trait index resolves this trade-off by finding the combination of trait emphases that maximizes aggregate economic gain. Its superiority over single-trait approaches ( Over five generations, these incremental advantages compound to meaningful economic differences at the herd level.
The sensitivity of index weights to economic scenarios (Figure 1) carries an important message for breeding program managers. The fact that RFI emphasis more than doubles under high feed cost conditions compared to baseline means that breeding programs optimized for today's economic environment may not remain optimal if feed costs rise substantially. The robustness analysis addresses this concern by identifying criteria that perform well across a range of economic conditions. The full index's robustness score of 0.81 means it captures, on average, 81% of the maximum possible aggregate gain regardless of which economic scenario materializes.
The decision framework in Figure 3 translates these quantitative findings into a practical tool. Producers without access to individual feed intake data should use the two-trait YW+ADG index, which captures 68% of the full index's aggregate gain. Those with feed intake recording capability should employ the full index. The choice of selection intensity depends on the herd structure and the producer's willingness to accept lower genetic diversity in exchange for faster genetic progress. The feedback loop emphasizes that economic weights and selection criteria should be reviewed annually as market conditions evolve.
Discussion
The comparison of selection criteria in this research confirms the theoretical expectation that multi-trait selection indices outperform single-trait approaches for balanced genetic improvement [4] . The full index's predicted response of 4.87 kg per generation for yearling weight and -0.26 kg/day per generation for RFI represents a near-optimal balance between growth and efficiency objectives. These predictions are consistent with selection response estimates reported in temperate beef breeds, where multi-trait indices typically capture 75-85% of the direct response for each component trait [13] .
The economic scenario analysis adds a dimension that has been missing from previous genetic parameter research on Boran cattle. The 2.4-fold increase in RFI emphasis under high feed cost conditions reflects the reality that feed efficiency becomes proportionally more valuable when feed is expensive relative to beef prices. Kenya's beef industry operates in an environment of volatile feed prices, driven by climate variability and fluctuating global grain markets [14] . The finding that the full index maintains 81% robustness across scenarios suggests it would remain a sound selection strategy even under considerable economic uncertainty. The correlated response patterns (Figure 4) provide practical guidance for situations where complete trait recording isn't feasible. The finding that YW-based selection captures only 23% of the direct RFI response highlights a limitation of relying exclusively on growth traits as indirect selection criteria for feed efficiency. While correlated genetic gain in RFI from growth selection is better than no gain at all, it falls far short of what could be achieved with direct measurement. This cost-benefit trade-off the expense of feed intake recording versus the additional genetic gain it enables should be evaluated for each breeding program based on herd size, testing capacity, and expected economic returns from improved feed efficiency [7] . The decision framework developed in this research responds to a practical need among Boran cattle breeders for actionable guidance.
Previous genetic research on this breed has focused primarily on parameter estimation without translating findings into breeding program recommendations. By linking genetic parameters to selection criteria through economic analysis and then embedding the results in a decision tree, this research bridges the gap between quantitative genetics theory and on-farm breeding practice [15] . The framework's modular structure allows producers to enter at the point most relevant to their situation and follow a logical pathway to the most appropriate selection criterion. A limitation of this research is the reliance on deterministic prediction equations that assume constant genetic parameters across generations. Stochastic simulation incorporating genetic drift and changes in allele frequencies would provide more realistic projections of long-term selection response [16] .
Conclusion
This The sensitivity of selection index weights to economic conditions represents an important practical consideration. Under baseline economic assumptions, growth traits receive approximately twice the emphasis of feed efficiency in the index. But when feed costs increase by 40%, the emphasis on residual feed intake nearly doubles, reflecting its amplified economic importance. This finding argues against using fixed index weights over long periods and instead supports periodic recalibration of economic weights to reflect current market conditions. The robustness analysis provides a safeguard against uncertainty by identifying criteria that perform acceptably well across a range of plausible economic scenarios.
The correlated response analysis reveals that growth-based selection captures a meaningful but incomplete share of the genetic variation available for feed efficiency improvement. Specifically, selecting for yearling weight alone achieves only 23% of the RFI response that direct selection would produce. This finding has clear economic implications: the incremental genetic gain from including feed intake data in the selection criterion must be weighed against the cost of individual feed intake recording, which remains substantial. For large breeding programs where the cost can be amortized across many selection candidates, direct measurement of feed efficiency is clearly justified. For smaller operations, the two-trait YW+ADG index offers a cost-effective alternative that captures 68% of the full index's aggregate genetic gain. The decision framework developed in this research provides Boran cattle producers with a structured approach to selecting the most appropriate criterion for their specific situation. By integrating data availability, production system characteristics, and economic objectives into a logical decision pathway, the framework makes the outputs of quantitative genetic analysis accessible to producers who may lack specialized training in animal breeding theory. Future work should extend this comparison to include genomic selection criteria, which could substantially increase the accuracy of breeding value estimates and enable earlier selection of genetically superior animals. Additionally, validation of the predicted selection responses through actual breeding experiments conducted over multiple generations would strengthen the evidence base for the recommended criteria. Integration of adaptive traits such as heat tolerance and disease resistance into the selection framework is also a priority, given the importance of these characteristics for Boran cattle performance in tropical production systems.
Acknowledgement
Acknowledgements Funding sourcesThis research was supported by the Agricultural
Figures and tables from the paper
| Trait | Mean | SD | Males | Females | CV (%) | Min | Max |
|---|---|---|---|---|---|---|---|
| BW (kg) | 22.8 | 2.5 | 24.2 | 21.3 | 9.8 | 16.4 | 30.7 |
| WW (kg) | 115.4 | 13.1 | 122.1 | 107.9 | 11.4 | 82.3 | 150.6 |
| YW (kg) | 205.1 | 18.9 | 218.7 | 189.8 | 9.2 | 159.4 | 256.3 |
| ADG (g/d) | 501.6 | 63.7 | 534.1 | 465.3 | 16.4 | 329.8 | 684.7 |
| DMI (kg/d) | 7.28 | 1.09 | 7.86 | 6.61 | 15.0 | 4.68 | 10.41 |
| FCR | 8.07 | 1.21 | 7.74 | 8.44 | 15.0 | 5.71 | 11.52 |
| RFI (kg/d) | 0.00 | 0.86 | -0.06 | 0.07 | -1.98 | 2.27 |
Table text extracted from the original PDF; superscript letters are shown inline. The original table image is below.
View original table image
References
17 in the original paper- Mbuku SM, Okeyo AM, Kosgey IS, Kahi AK. Optimum breeding strategies for Kenyan ranching systems using indigenous cattle breeds. Trop Anim Health Prod. 2006;38(5):395-403.
- Nicholas FW. Introduction to Veterinary Genetics. 3rd ed. Oxford: Wiley-Blackwell; 2010.
- Mrode RA, Thompson R. Linear Models for the Prediction of Animal Breeding Values. 2nd ed. Wallingford: CABI Publishing; 2005.
- Hazel LN. The genetic basis for constructing selection indexes. Genetics. 1943;28(6):476-490.
- Lande R, Arnold SJ. The measurement of selection on correlated characters. Evolution. 1983;37(6):12101226.
- Herd RM, Archer JA, Arthur PF. Reducing the cost of beef production through genetic improvement in residual feed intake: Opportunity and challenges to application. J Anim Sci. 2003;81(Suppl 1):E9-E17.
- Kahi AK, Nitter G, Gall CF. Developing breeding schemes for pasture based dairy production systems in Kenya. II. Evaluation of alternative objectives and schemes using a two-tier open nucleus and young bull system. Livest Prod Sci. 2004;88(1-2):179-192.
- Amer PR, Fox GC, Smith C. Economic weights from profit equations: Appraising their accuracy in the long run. Anim Prod. 1994;58(1):11-18.
- Majoya AM, Khobondo JO, Tura S, Muasya TK. Genetic variation and parameters for growth and feed efficiency traits in Boran beef cattle in Kenya. Int J Vet Sci Anim Husbandry. 2022;7(4):41-45.
- Smith HF. A discriminant function for plant selection. Ann Eugen. 1936;7(3):240-250.
- Basarab JA, Price MA, Aalhus JL, Okine EK, Snelling WM, Lyle KL. Residual feed intake and body composition in young growing cattle. Can J Anim Sci. 2003;83(2):189-204.
- Gilmour AR, Gogel BJ, Cullis BR, Thompson R. ASReml User Guide. Release 4.2. Hemel Hempstead: VSN International Ltd; 2021.
- Barwick SA, Wolcott ML, Johnston DJ, Burrow HM, Sullivan MT. Genetics of steer daily and residual feed intake in two tropical beef genotypes, and relationships among intake, body composition, growth and other post-weaning measures. Anim Prod Sci. 2009;49(5):351-366.
- Behnke RH, Muthami D. The contribution of livestock to the Kenyan economy. IGAD Livestock Policy Initiative Working Paper No. 03-11. Addis Ababa: IGAD; 2011.
- Rewe TO, Herold P, Kahi AK, Valle Zarate A. Breeding indigenous cattle genetic resources for beef production in Sub-Saharan Africa. Outlook Agric. 2009;38(4):317-326.
- Dekkers JCM. Prediction of response to marker-assisted and genomic selection using selection index theory. J Anim Breed Genet. 2007;124(6):331-341.
- Scholtz MM, Bester J, Ramsey KA, Neser FWC. Results of the national cattle survey undertaken in South Africa, with emphasis on beef. Appl Anim Husb Rural Dev. 2008;1:1-9.