
Research article · 2026 · Full text
International Journal of Geography Geology and EnvironmentUrbanization dynamics and land use change analysis using GIS and remote sensing: A case study of Jhajjar district
Volume 8(2) · Pages 150–155 · DOI: 10.22271/27067483.2026.v8.i2a.490 ↗
Research areasLand Use and Ecosystem ServicesSoil and Land Suitability AnalysisRemote-Sensing Image Classification
Abstract
Author-writtenThe rapid expansion of urban areas necessitates precise monitoring and assessment to understand its impact on land use and land cover (LULC). This study employs Geographic Information Systems (GIS) and remote sensing techniques to analyze urbanization trends in Jhajjar district over two decades (2004-2024). Utilizing multi-temporal LANDSAT and Sentinel-2 satellite imagery, along with Survey of India (SOI) topographical maps and Google Earth Pro data, this study conducts supervised classification and vector extraction to assess urban sprawl. Various GIS tools, including ArcGIS, ERDAS Imagine, and QGIS, are used to delineate LULC patterns and urban expansion. Findings reveal that non-agricultural land accounts for 18.85% of the total geographical area, with built-up areas comprising 10.2%, indicating moderate urbanization. Additionally, wasteland (2.5%) and fallow land (2.2%) highlight potential areas for sustainable land management. The study emphasizes the necessity of integrating satellite-based analysis with ground surveys for an accurate environmental impact assessment. The results offer critical insights for urban planners and policymakers to formulate sustainable land use strategies and manage urban growth effectively.
Summary
Source-checkedPlain-language reading of the full paper, prepared with AI and checked against the text. Each point links to the authors' own words.
Why it matters
- Urbanization is a dynamic process that can cause significant socio-economic and environmental changes by altering land use and land cover (LULC) patterns. View evidence ↗
- The growth of built-up areas in the region has shifted land use patterns, which affects natural ecosystems, open spaces, and agricultural land. View evidence ↗
The question
- The study aims to analyze urbanization trends in the Jhajjar district between 2004 and 2024 using satellite imagery and topographical maps. View evidence ↗
What they did
- LULC classifications were performed using a supervised classification algorithm, and urban features were then converted from raster to vector format. View evidence ↗
- The study utilized ArcGIS, QGIS, and ERDAS Imagine software to demarcate land use and land cover and to create maps. View evidence ↗
What they found
- In 2004, the district was predominantly agricultural, with multiple crop land at 77.1% (146,400.21 ha) and single crop land at 12.3% (23,413.84 ha). View evidence ↗
- While 62.6% (118,826.1 ha) of multiple crop land remained unchanged, other portions were converted to single crop land (6.8%, 12,903.1 ha), wasteland (1.6%, 3,035.3 ha), and fallow land (1.3%, 2,393.4 ha). View evidence ↗
- Water bodies remained stable at 1.5% (2,884.5 ha), though some waterlogged areas (0.1%, 213.6 ha) were converted to multiple crop land. View evidence ↗
What it means
- The authors conclude that there is an urgent need for sustainable urban planning to balance environmental conservation with development. View evidence ↗
- The authors recommend proactive strategies that prioritize ecological balance, efficient land use, and the preservation of agricultural land. View evidence ↗
Visual summary
1 visualsIllustrations explain the paper; they do not show study data.
LULC Transition Flow
AI-generated conceptual illustration (Satellite-view landscape of Jhajjar district, Haryana). It explains the idea and does not show study data.
View source evidence ↗Figures & tables
From the original paper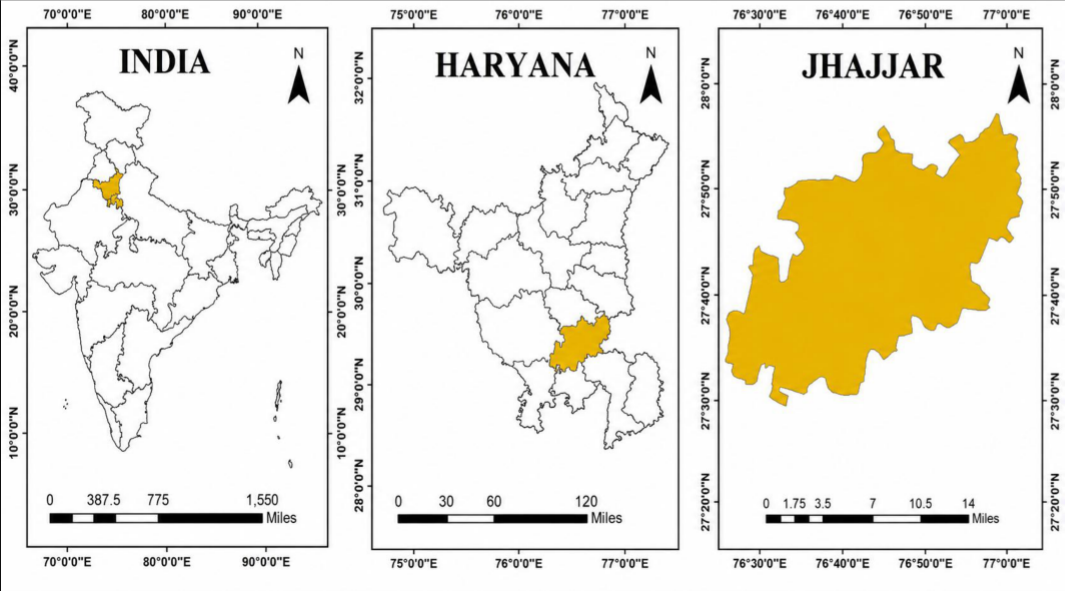 Figure 1
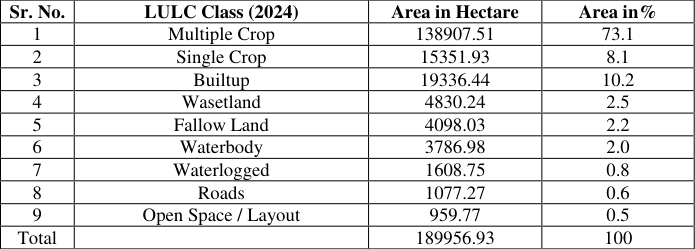 Table 1
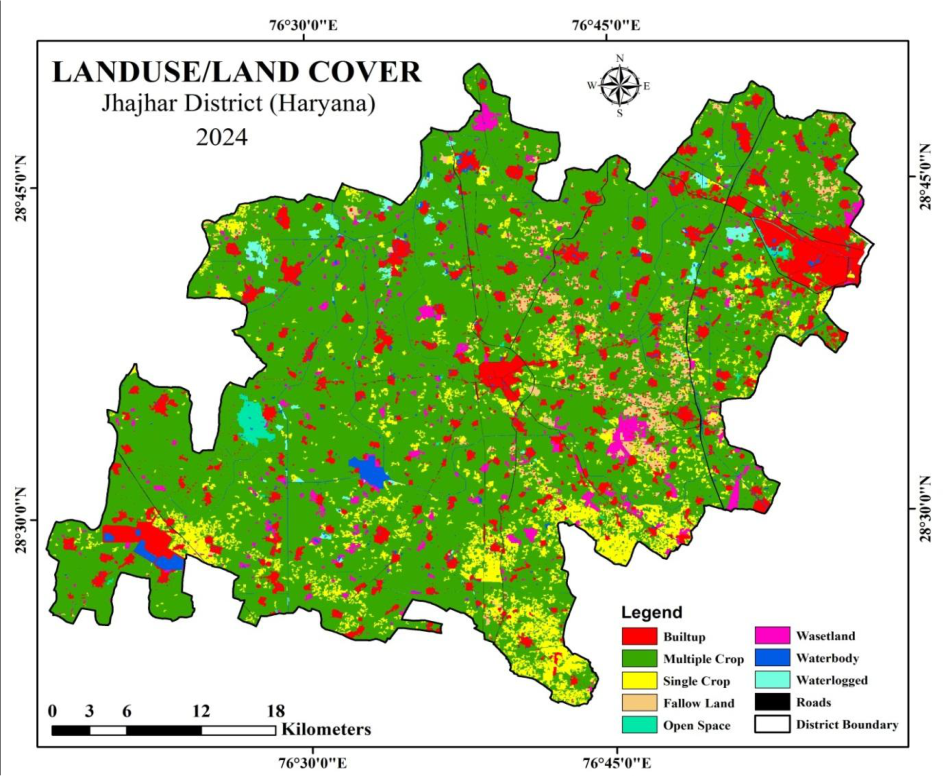 Figure 2
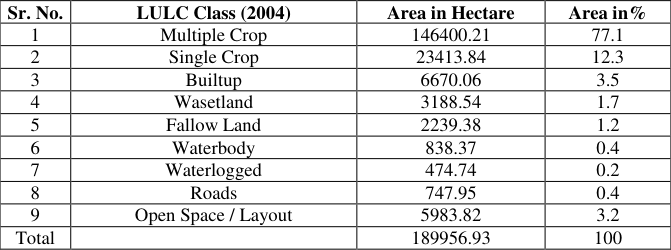 Table 2
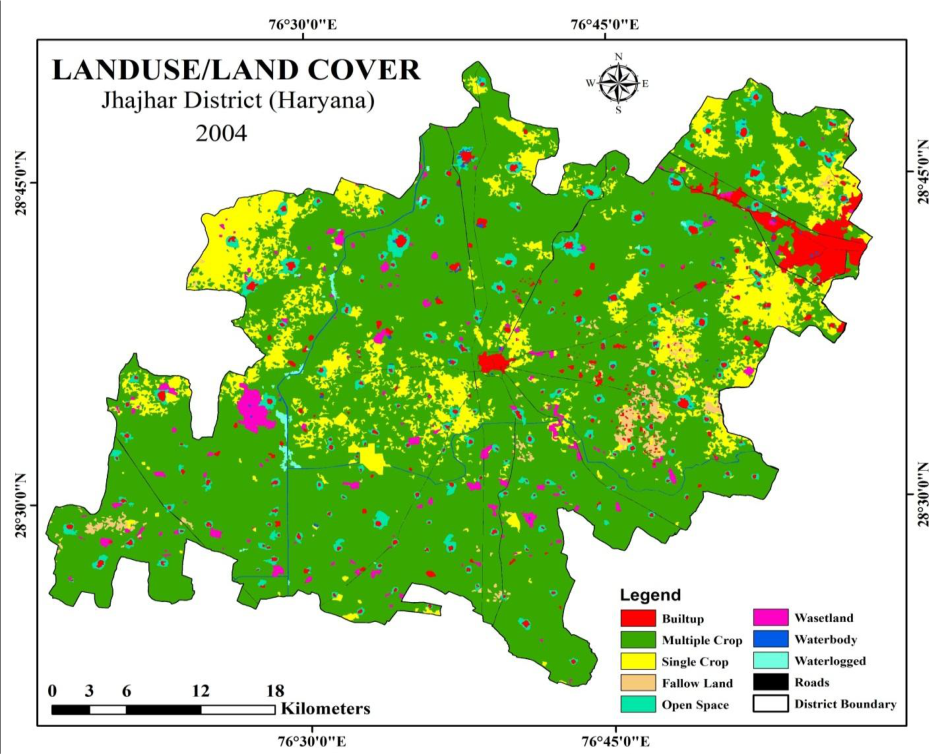 Figure 3
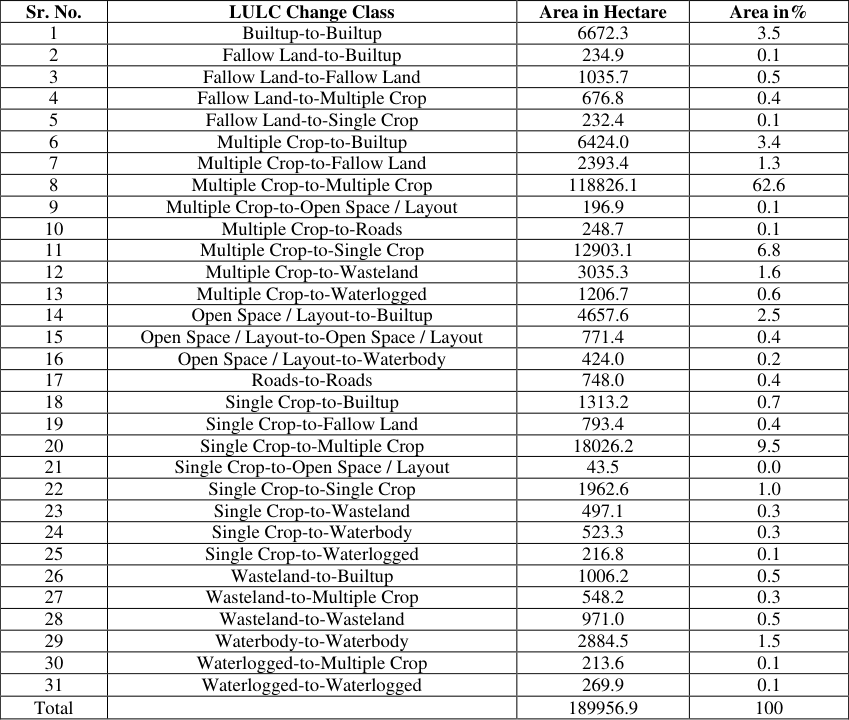 Table 3
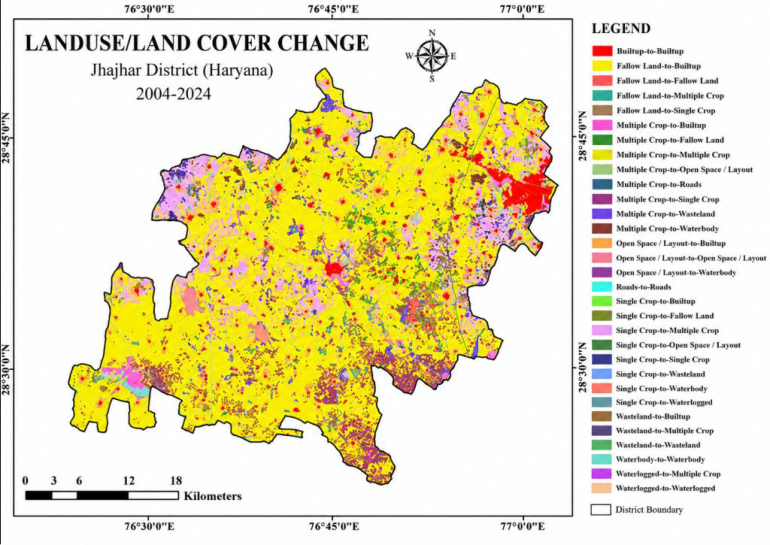 Figure 4
Introduction
Urbanization is a dynamic process that significantly influences land use and land cover (LULC) patterns, often leading to extensive socio-economic and environmental transformations (Seto et al., 2011) [9] . The rapid growth of urban areas has necessitated advanced monitoring techniques to assess changes in land utilization and ensure sustainable urban development. Geographic Information Systems (GIS) and remote sensing have emerged as essential tools in analyzing urban expansion by providing spatially and temporally explicit data (Bhatta, 2010) [1] . Jhajjar district, located in Haryana, India, has witnessed considerable urban growth over the past two decades due to its proximity to Delhi and inclusion in the National Capital Region (NCR). The expansion of built-up areas has led to a shift in LULC, impacting agricultural land, open spaces, and natural ecosystems (Kumar et al., 2020) [5] . Understanding these changes through GIS and remote sensing is critical for sustainable urban planning and environmental management. This study employs multi-temporal LANDSAT and Sentinel-2 satellite imagery, in conjunction with Survey of India (SOI) topographical maps and Google Earth Pro data, to analyze urbanization trends in Jhajjar district from 2004 to 2024. Supervised classification and vector extraction techniques are used to delineate LULC patterns and assess urban sprawl. GIS-based tools, including ArcGIS, ERDAS Imagine, and QGIS, facilitate spatial analysis and visualization of urban growth trends. The findings indicate that non-agricultural land accounts for 18.85% of the district's total geographical area, with built-up regions constituting 10.2%. The presence of wasteland (2.5%) and fallow land (2.2%) underscores potential areas for sustainable land management and development. By integrating satellite-based observations with field surveys, this study provides a comprehensive approach to understanding urban expansion and its environmental implications. The results serve as a valuable resource for policymakers and urban planners in devising sustainable land use strategies to manage future growth effectively (Ramachandra & Kumar, 2012) [8] .
Study area
Jhajjar, a town with a rich historical heritage, is the headquarters of Jhajjar district, one of Haryana's 22 districts. Jhajjar district lies between 28° 21′ 31′′ N and 28° 50′ 19′′ N latitude and between 76° 17′06 ′′ E and 76° 58′15′′ E longitude. It has a geographical area of 1834.00 sq. kms. Carved out of Rohtak district on July 15, 1997, it is located about 65 km from Delhi. Founded by Chhaju, the town derives its name from him. The district spans 1834 sq. km and comprises six blocks with 264 villages. It experiences hot summers, cold winters, and scanty rainfall. Encircled by a flood protection bundh, its expansion is limited. The population stands at 9.58 lakh (2011 census) with a low sex ratio of 862 females per 1000 males.
Jhajjar has good road connectivity and basic infrastructure but lags in irrigation and marketing facilities. It is well connected via NH-352, NH-334B, and other major roads. As part of the NCR, it holds development potential. The district hosts two industrial areas with 2408 plots, featuring major industries like ceramics, glass, chemicals, and engineering. Bahadurgarh, in the eastern part of the district, is an industrial hub on the Delhi border. It has major industries including Hindustan National Glass, Relaxo, Parle Biscuits, and a dedicated footwear park. The town is well-connected via the Delhi Metro Green Line and Delhi Western Peripheral Expressway, making it a key industrial center in Haryana NCR.
Results and Discussion
The analysis of LULC changes in Jhajjar district over two decades (2004-2024) reveals significant transformations driven by urban expansion, agricultural shifts, and environmental factors.
Land Use and Land Cover (LULC)
The Land Use and Land Cover (LULC) classification for Jhajjar district reflects the distribution and usage of land resources in the region. This classification helps understand how land is utilized for agriculture, settlements, industrial purposes, natural landscapes, and other activities. Below is an overview of the typical LULC classification for Jhajjar district. The LULC change analysis (Table -3) in Jhajjar district highlights significant transformations between 2004 and 2024, with built-up expansion primarily from multiple crop land (3.4% -6,424 ha), open space/layout (2.5% -4,657.6 ha), single crop (0.7% -1,313.2 ha), fallow land (0.1% -234.9 ha), and wasteland (0.5% -1,006.2 ha), contributing to urban growth. Agricultural shifts are evident, with multiple crop land retaining 62.6% (118,826.1 ha) of its area but also converting into single crop land (6.8% -12,903.1 ha), fallow land (1.3% -2,393.4 ha), and wasteland (1.6% -3,035.3 ha). Single crop areas expanded into multiple crop land (9.5% -18,026.2 ha), while minor transitions occurred from single crop to wasteland (0.3% -497.1 ha) and waterbody (0.3% -523.3 ha).
Figures and tables from the paper
| Sr. No. | LULC Class (2024) | Area in Hectare | Area in% |
|---|---|---|---|
| 1 | Multiple Crop | 138907.51 | 73.1 |
| 2 | Single Crop | 15351.93 | 8.1 |
| 3 | Builtup | 19336.44 | 10.2 |
| 4 | Wasetland | 4830.24 | 2.5 |
| 5 | Fallow Land | 4098.03 | 2.2 |
| 6 | Waterbody | 3786.98 | 2.0 |
| 7 | Waterlogged | 1608.75 | 0.8 |
| 8 | Roads | 1077.27 | 0.6 |
| 9 | Open Space / Layout | 959.77 | 0.5 |
| Total | 189956.93 | 100 |
Table text extracted from the original PDF; superscript letters are shown inline. The original table image is below.
View original table image
| Sr. No. | LULC Class (2004) | Area in Hectare | Area in% |
|---|---|---|---|
| 1 | Multiple Crop | 146400.21 | 77.1 |
| 2 | Single Crop | 23413.84 | 12.3 |
| 3 | Builtup | 6670.06 | 3.5 |
| 4 | Wasetland | 3188.54 | 1.7 |
| 5 | Fallow Land | 2239.38 | 1.2 |
| 6 | Waterbody | 838.37 | 0.4 |
| 7 | Waterlogged | 474.74 | 0.2 |
| 8 | Roads | 747.95 | 0.4 |
| 9 | Open Space / Layout | 5983.82 | 3.2 |
| Total | 189956.93 | 100 |
Table text extracted from the original PDF; superscript letters are shown inline. The original table image is below.
View original table image
| Sr. No. | LULC Change Class | Area in Hectare | Area in% |
|---|---|---|---|
| 1 | Builtup-to-Builtup | 6672.3 | 3.5 |
| 2 | Fallow Land-to-Builtup | 234.9 | 0.1 |
| 3 | Fallow Land-to-Fallow Land | 1035.7 | 0.5 |
| 4 | Fallow Land-to-Multiple Crop | 676.8 | 0.4 |
| 5 | Fallow Land-to-Single Crop | 232.4 | 0.1 |
| 6 | Multiple Crop-to-Builtup | 6424.0 | 3.4 |
| 7 | Multiple Crop-to-Fallow Land | 2393.4 | 1.3 |
| 8 | Multiple Crop-to-Multiple Crop | 118826.1 | 62.6 |
| 9 | Multiple Crop-to-Open Space / Layout | 196.9 | 0.1 |
| 10 | Multiple Crop-to-Roads | 248.7 | 0.1 |
| 11 | Multiple Crop-to-Single Crop | 12903.1 | 6.8 |
| 12 | Multiple Crop-to-Wasteland | 3035.3 | 1.6 |
| 13 | Multiple Crop-to-Waterlogged | 1206.7 | 0.6 |
| 14 | Open Space / Layout-to-Builtup | 4657.6 | 2.5 |
| 15 | Open Space / Layout-to-Open Space / Layout | 771.4 | 0.4 |
| 16 | Open Space / Layout-to-Waterbody | 424.0 | 0.2 |
| 17 | Roads-to-Roads | 748.0 | 0.4 |
| 18 | Single Crop-to-Builtup | 1313.2 | 0.7 |
| 19 | Single Crop-to-Fallow Land | 793.4 | 0.4 |
| 20 | Single Crop-to-Multiple Crop | 18026.2 | 9.5 |
| 21 | Single Crop-to-Open Space / Layout | 43.5 | 0.0 |
| 22 | Single Crop-to-Single Crop | 1962.6 | 1.0 |
| 23 | Single Crop-to-Wasteland | 497.1 | 0.3 |
| 24 | Single Crop-to-Waterbody | 523.3 | 0.3 |
| 25 | Single Crop-to-Waterlogged | 216.8 | 0.1 |
| 26 | Wasteland-to-Builtup | 1006.2 | 0.5 |
| 27 | Wasteland-to-Multiple Crop | 548.2 | 0.3 |
| 28 | Wasteland-to-Wasteland | 971.0 | 0.5 |
| 29 | Waterbody-to-Waterbody | 2884.5 | 1.5 |
| 30 | Waterlogged-to-Multiple Crop | 213.6 | 0.1 |
| 31 | Waterlogged-to-Waterlogged | 269.9 | 0.1 |
| Total | 189956.9 | 100 |
Table text extracted from the original PDF; superscript letters are shown inline. The original table image is below.
View original table image
References
12 in the original paper- Bhatta B. Analysis of urban growth and sprawl from remote sensing data. Springer; 2010.
- Badarinath KVS, Kiranchand TR, Prasad V. Agriculture crop residue burning in the Indo-Gangetic plains: a study using IRS-P6 AWiFS satellite data. Current Science. 2006;91:1085-1089.
- Shekhar C, et al. Cropping pattern and decadal change in cropping pattern of Charkhi Dadri district of Haryana using remote sensing and geostatistical technique. IOSR Journal of Agriculture and Veterinary Science. 2023;16(1):69-76.
- Shekhar C, et al. Spatial variability of groundwater quality for irrigation of Mansa district, Punjab. International Journal of Agriculture Sciences. 2020;12(2):9448-9450.
- Kumar P, Singh R, Sharma N. Urban expansion and its impact on land use: a case study of Haryana, India. Journal of Geospatial Science. 2020;8(2):45-60.
- Kulkarni AV, Rathore BP, Singh SK, Bahuguna IM. Understanding changes in the Himalayan cryosphere using remote sensing techniques. International Journal of Remote Sensing. 2011;32:601-615.
- Li Y, Conway D, Xiong W, Gao Q, Wu Y, Wan Y, et al. Effects of climate variability and change on Chinese agriculture: a review. Climate Research. 2011;50:83102.
- Ramachandra TV, Kumar U. Geoinformatics for urban studies. CRC Press; 2012.
- Seto KC, Fragkias M, Güneralp B, Reilly MK. A metaanalysis of global urban land expansion. PLoS ONE. 2011;6(8):e23777-e23777.
- Singh A. Digital change detection techniques using remotely-sensed data. International Journal of Remote Sensing. 1989;10(6):989-1003. DOI:10.1080/01431168908903939.
- Singh D, Mondal S, Hooda RS. Green indexing of Hisar Municipal Corporation using geospatial techniques. International Archives of the Photogrammetry, Remote Sensing & Spatial Information Sciences. 2018.
- Uttara S, Bhuvandas N, Aggarwal V. Impacts of urbanization on environment. International Journal of Research in Engineering and Applied Sciences. 2012;2(2):1637-1645.