
Research article · 2026 · Full text
International Journal of Biology SciencesCorrelation analysis studies in forage oat (Avena sativa L.) genotypes for forage yield and yield contributing characters
Volume 8(3) · Pages 12–14 · DOI: 10.33545/26649926.2026.v8.i3a.587 ↗
Research areasGenetics and Plant BreedingAgronomic Practices and Intercropping SystemsNitrogen and Sulfur Effects on Brassica
Abstract
Author-writtenA field experiment on forty-four forage oat genotypes was evaluated in Randomized Block Design (RBD) along with three replications at research farm of MPKV, Rahuri. The all recommended cultural practices was strictly followed during growing stage of oat crop. Each and every plot and plant was strictly investigated and on which observations accurately recorded. The observed character i.e. Stem girth, Plant height, No. of Internodes per Tillers, No. of leaves per tiller, Leaf length and Dry matter content had positive association with green forage yield. This indicated that indirect selection of this trait has positive implications on the improvement of oat crop for forage. Among studied characters plant height has highly positive direct association with green forage yield followed by stem girth, leaf length, and No. of internodes per tillers. Study reported that Plant height, Stem girth, leaf length and Number of internodes per tiller has true important component of green forage yield of oat. Selection of this character has helpful for improving forage yield of oat.
Summary
Source-checkedPlain-language reading of the full paper, prepared with AI and checked against the text. Each point links to the authors' own words.
Why it matters
- Oat crops are versatile, used globally for grain production, pasture, and as forage for grazing animals. View evidence ↗
- India faces significant shortages in livestock feed, with a net deficit of 63% for green fodder, 24% for dry crop residues, and 64% for feeds. View evidence ↗
- While oats have high grain yields, their green fodder yield is limited, typically ranging from 44 to 56 ton / ha. View evidence ↗
The question
- The study aims to use correlation analysis of various traits to identify a reliable index for selecting genotypes with improved forage yield. View evidence ↗
What they did
- The study measured several characters, including plant height, stem girth, leaf length, dry matter content, and the number of leaves and internodes per tiller. View evidence ↗
- Data collection involved recording observations from five randomly selected plants per plot. View evidence ↗
What they found
- Plant height (0.876 genotypic, 0.844 phenotypic) and stem girth (0.755 genotypic, 0.714 phenotypic) showed the strongest significant positive correlations with green forage yield. View evidence ↗
- Dry matter content (0.592 genotypic, 0.559 phenotypic), number of internodes per tiller (0.427 genotypic, 0.335 phenotypic), and number of leaves per tiller (0.419 genotypic, 0.337 phenotypic) also positively correlated with forage yield. View evidence ↗
- Leaf length showed a significant positive correlation with green forage yield at both genotypic (0.274) and phenotypic (0.239) levels. View evidence ↗
- Days to 50% flowering and leaf width were found to be significantly negatively correlated with forage yield. View evidence ↗
- Plant height positively correlated with stem girth (0.600 genotypic, 0.574 phenotypic), dry matter percentage (0.580 genotypic, 0.14 phenotypic), and the number of leaves and internodes per tiller. View evidence ↗
- The number of leaves per tiller showed a very strong positive correlation with the number of internodes per tiller (0.943 genotypic, 0.926 phenotypic). View evidence ↗
What it means
- The authors conclude that plant height, stem girth, dry matter content, leaf length, and the number of leaves and internodes per tiller are key traits for improving forage yield. View evidence ↗
- The authors recommend the indirect selection of these positively associated traits to improve green forage yield in oat crops. View evidence ↗
Visual summary
2 visualsIllustrations explain the paper; charts are replotted from the paper's own table values.
Trait Correlation Map
AI-generated conceptual illustration (forage oat (Avena sativa L.) plants). It explains the idea and does not show study data.
View source evidence ↗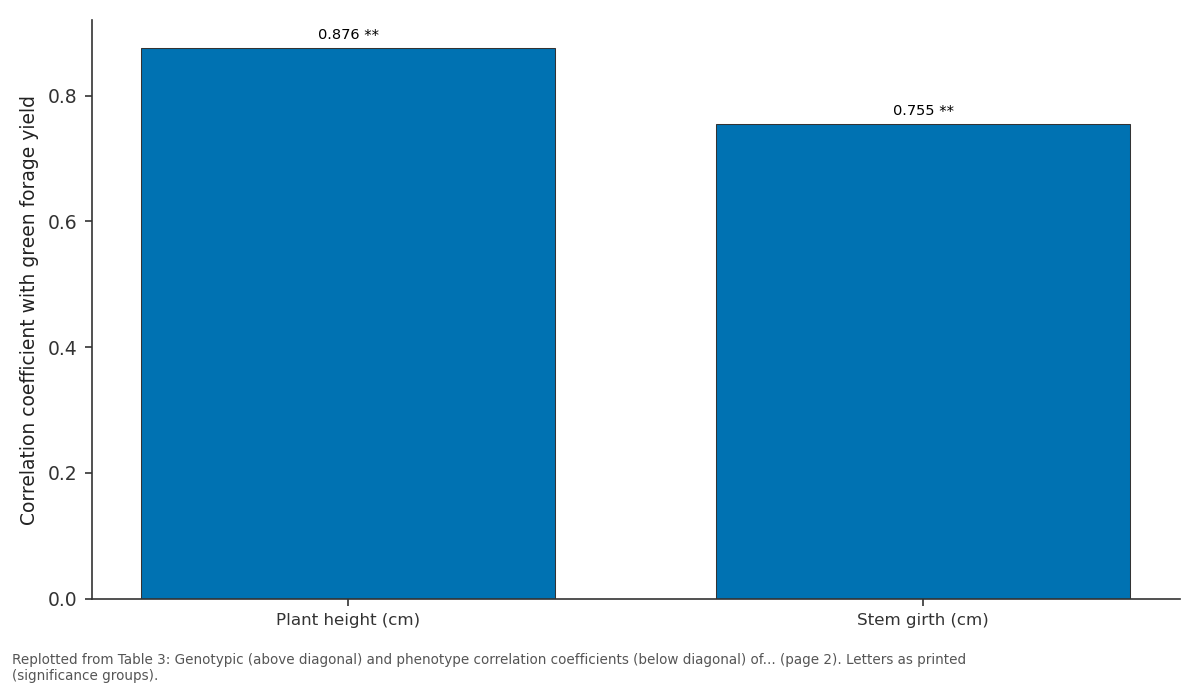
Green forage yield /(kg /net plot): Plant height (cm) vs Stem girth (cm)
Replotted from Table 3 (page 2) of the original paper. Every bar is the paper's own table value.
View source evidence ↗Figures & tables
From the original paper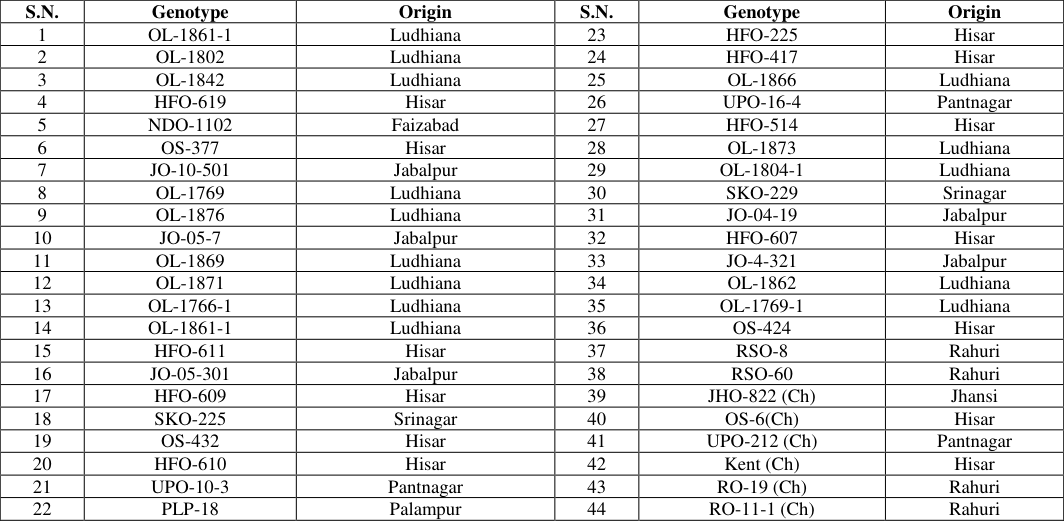 Table 1
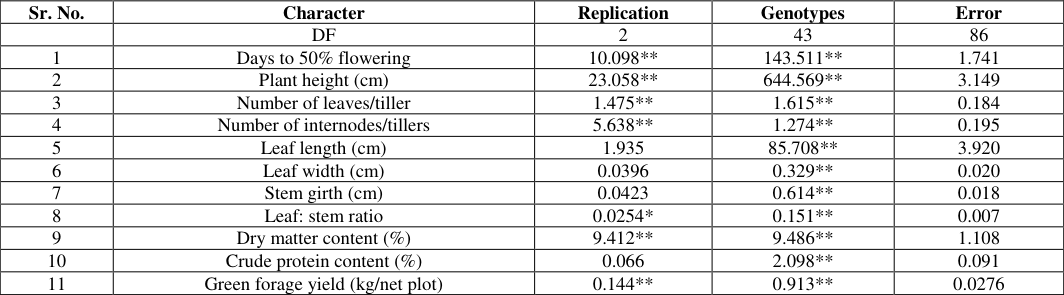 Table 2
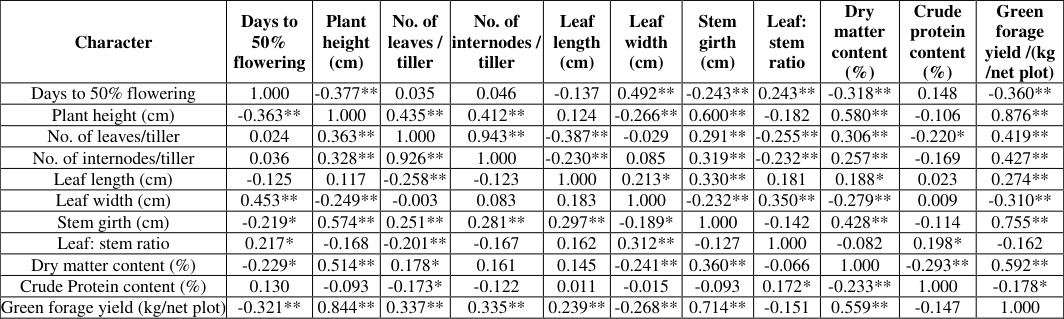 Table 3
Introduction
The oat (Avena sativa L.) is a hexaploid crop with diploid chromosome number i.e. 42. Oat crop is cultivated worldwide, extensively over a wide area, during the winter season. The oat crop is commonly cultivated for three purposes viz., grain production, pasture and forage as feed for grazing animals. One of the ideal things with oat crop is that it is considered as a dual-purpose crop viz., grain as food for human beings and feed for cattle.
According to Ruwali et al. (2013) [7], in India the dairy industry is growing day by day very strongly. The oat crop attracted the attention of plant breeders due to the grain crop having higher nutritional value, and it produces quality fodder. In India, the oat crop is predominantly cultivated in the rabi season, primarily in the central and north-western region. However, cultivation was extended to the eastern region of India.
Nowadays, more than five lakh hectare area is under oat cultivation in the country. The fodder production and productivity are insufficient for Indian livestock and also have difficulty fulfilling the supply requirement of fodder and feed. Nowadays, India has a net deficit of 63% of green fodder, 24% of dry crop residues and 64% of feeds. Oat fodder is preferred by dairy farmers for their cattle.
It can be fed green as fodder and can be converted into hay during limited supply. The oat crop has high grain yielding ability; however, it is limited in green fodder yield viz., 44 to 56 ton / ha. Oat crop has high green fodder yield ability and generation capacity on cutting. Oat improvement requires a multidisciplinary approach and innovative technology.
In the present study, germplasm was collected from diverse origins. The magnitude of genetic variability present in the germplasm creates an opportunity for selection. Correlation study of traits and their direct and indirect effects is an important index of selection.
Materials And Methods
The study was conducted at the research farm of Mahatma Phule Krishi Vidyapeeth, Rahuri. For the experiment, forty-four (38 genotypes and 06 checks) genotypes were collected from different AICRP centres of forage crops mentioned in Table No. 1. The experiment was conducted in randomized block design (RBD) with three replications. The experiment plot size was 3.30 × 0.60 cm.
NAAS Rating (2026): 4.82 IJBS 2026; 8(3): 12-14 VS Pawar Department of Agricultural Botany (GPB), Post Graduate Institute, Mahatma Phule Krishi Vidyapeeth, Rahuri, Maharashtra, India GC Shinde Department of Agricultural Botany (GPB), Post Graduate Institute, Mahatma Phule Krishi Vidyapeeth, Rahuri, Maharashtra, India SD Shinde Department of Agricultural Botany (GPB), Post Graduate Institute, Mahatma Phule Krishi Vidyapeeth, Rahuri, Maharashtra, India VS Pawar Department of Agricultural Botany (GPB), Post Graduate Institute, Mahatma Phule Krishi Vidyapeeth, Rahuri, Maharashtra, India https://www.biologyjournal.net and observations were recorded by selecting five plants randomly from each plot. The spacing between two rows was 30 cm, and between two plants was 5 cm. All the recommended cultural practices were followed strictly. Each plot was frequently observed, Table 1: Oat genotypes with their origin S.N.
| S.N. | Genotype | Origin | S.N. | Genotype | Origin |
|---|---|---|---|---|---|
| 1 | OL-1861-1 | Ludhiana | 23 | HFO-225 | Hisar |
| 2 | OL-1802 | Ludhiana | 24 | HFO-417 | Hisar |
| 3 | OL-1842 | Ludhiana | 25 | OL-1866 | Ludhiana |
| 4 | HFO-619 | Hisar | 26 | UPO-16-4 | Pantnagar |
| 5 | NDO-1102 | Faizabad | 27 | HFO-514 | Hisar |
| 6 | OS-377 | Hisar | 28 | OL-1873 | Ludhiana |
| 7 | JO-10-501 | Jabalpur | 29 | OL-1804-1 | Ludhiana |
| 8 | OL-1769 | Ludhiana | 30 | SKO-229 | Srinagar |
| 9 | OL-1876 | Ludhiana | 31 | JO-04-19 | Jabalpur |
| 10 | JO-05-7 | Jabalpur | 32 | HFO-607 | Hisar |
| 11 | OL-1869 | Ludhiana | 33 | JO-4-321 | Jabalpur |
| 12 | OL-1871 | Ludhiana | 34 | OL-1862 | Ludhiana |
| 13 | OL-1766-1 | Ludhiana | 35 | OL-1769-1 | Ludhiana |
| 14 | OL-1861-1 | Ludhiana | 36 | OS-424 | Hisar |
| 15 | HFO-611 | Hisar | 37 | RSO-8 | Rahuri |
| 16 | JO-05-301 | Jabalpur | 38 | RSO-60 | Rahuri |
| 17 | HFO-609 | Hisar | 39 | JHO-822 (Ch) | Jhansi |
| 18 | SKO-225 | Srinagar | 40 | OS-6(Ch) | Hisar |
| 19 | OS-432 | Hisar | 41 | UPO-212 (Ch) | Pantnagar |
| 20 | HFO-610 | Hisar | 42 | Kent (Ch) | Hisar |
| 21 | UPO-10-3 | Pantnagar | 43 | RO-19 (Ch) | Rahuri |
| 22 | PLP-18 | Palampur | 44 | RO-11-1 (Ch) | Rahuri |
Table text extracted from the original PDF; superscript letters are shown inline. The original table image is below.
View original table image
Genotype Origin S.N. Genotype Origin 1 OL-1861-1 Ludhiana 23 HFO-225 Hisar 2 OL-1802 Ludhiana 24 HFO-417 Hisar 3 OL-1842 Ludhiana 25 OL-1866 Ludhiana 4 HFO-619 Hisar 26 UPO-16-4 Pantnagar 5 NDO-1102 Faizabad 27 HFO-514 Hisar 6 OS-377 Hisar 28 OL-1873 Ludhiana 7 JO-10-501 Jabalpur 29 OL-1804-1 Ludhiana 8 OL-1769 Ludhiana 30 SKO-229 Srinagar 9 OL-1876 Ludhiana 31 JO-04-19 Jabalpur 10 JO-05-7 Jabalpur 32 HFO-607 Hisar 11 OL-1869 Ludhiana 33 JO-4-321 Jabalpur 12 OL-1871 Ludhiana 34 OL-1862 Ludhiana 13 OL-1766-1 Ludhiana 35 OL-1769-1 Ludhiana 14 OL-1861-1 Ludhiana 36 OS-424 Hisar 15 HFO-611 Hisar 37 RSO-8 Rahuri 16 JO-05-301 Jabalpur 38 RSO-60 Rahuri 17 HFO-609 Hisar 39 JHO-822 (Ch) Jhansi 18 SKO-225 Srinagar 40 OS-6(Ch) Hisar 19 OS-432 Hisar 41 UPO-212 (Ch) Pantnagar 20 HFO-610 Hisar 42 Kent (Ch) Hisar 21 UPO-10-3 Pantnagar 43 RO-19 (Ch) Rahuri 22 PLP-18 Palampur 44 RO-11-1 (Ch) Rahuri Table 2: Analysis of variance for different characters of oat genotypes Sr. No. Character Replication Genotypes Error DF 2 43 86 1 Days to 50% flowering 10.098** 143.511** 1.741 2 Plant height (cm) 23.058** 644.569** 3.149 3 Number of leaves/tiller 1.475** 1.615** 0.184 4 Number of internodes/tillers 5.638** 1.274** 0.195 5 Leaf length (cm) 1.935 85.708** 3.920 6 Leaf width (cm) 0.0396 0.329** 0.020 7 Stem girth (cm) 0.0423 0.614** 0.018 8 Leaf: stem ratio 0.0254* 0.151** 0.007 9 Dry matter content (%) 9.412** 9.486** 1.108 10 Crude protein content (%) 0.066 2.098** 0.091 11 Green forage yield (kg/net plot) 0.144** 0.913** 0.0276 *, ** = significant at 5% and 1% levels, respectively.
| Sr. No. | Character | Replication | Genotypes | Error |
|---|---|---|---|---|
| DF | 2 | 43 | 86 | |
| 1 | Days to 50% flowering | 10.098** | 143.511** | 1.741 |
| 2 | Plant height (cm) | 23.058** | 644.569** | 3.149 |
| 3 | Number of leaves/tiller | 1.475** | 1.615** | 0.184 |
| 4 | Number of internodes/tillers | 5.638** | 1.274** | 0.195 |
| 5 | Leaf length (cm) | 1.935 | 85.708** | 3.920 |
| 6 | Leaf width (cm) | 0.0396 | 0.329** | 0.020 |
| 7 | Stem girth (cm) | 0.0423 | 0.614** | 0.018 |
| 8 | Leaf: stem ratio | 0.0254* | 0.151** | 0.007 |
| 9 | Dry matter content (%) | 9.412** | 9.486** | 1.108 |
| 10 | Crude protein content (%) | 0.066 | 2.098** | 0.091 |
| 11 | Green forage yield (kg/net plot) | 0.144** | 0.913** | 0.0276 |
Table text extracted from the original PDF; superscript letters are shown inline. The original table image is below.
View original table image
Table 3: Genotypic (above diagonal) and phenotype correlation coefficients (below diagonal) of green forage yield and yield contributing characters of oat genotypes. Days to Leaf: Character Plant height No. of leaves / No. of internodes / Leaf length Leaf width Stem girth Dry matter content Crude protein content 50% flowering (cm) tiller tiller (cm) (cm) (cm) stem ratio (%) (%) (0.243, 0.0.217) and negatively correlated with plant height (-0.377, -0.363) and dry matter content (-0.318, - 0.229) at phenotypic and genotypic level. Green forage yield /(kg /net plot) Days to 50% flowering 1.000 -0.377** 0.035 0.046 -0.137 0.492** -0.243** 0.243** -0.318** 0.148 -0.360** Plant height (cm) -0.363** 1.000 0.435** 0.412** 0.124 -0.266** 0.600** -0.182 0.580** -0.106 0.876** No. of leaves/tiller 0.024 0.363** 1.000 0.943** -0.387** -0.029 0.291** -0.255** 0.306** -0.220* 0.419** No. of internodes/tiller 0.036 0.328** 0.926** 1.000 -0.230** 0.085 0.319** -0.232** 0.257** -0.169 0.427** Leaf length (cm) -0.125 0.117 -0.258** -0.123 1.000 0.213* 0.330** 0.181 0.188* 0.023 0.274** Leaf width (cm) 0.453** -0.249** -0.003 0.083 0.183 1.000 -0.232** 0.350** -0.279** 0.009 -0.310** Stem girth (cm) -0.219* 0.574** 0.251** 0.281** 0.297** -0.189* 1.000 -0.142 0.428** -0.114 0.755** Leaf: stem ratio 0.217* -0.168 -0.201** -0.167 0.162 0.312** -0.127 1.000 -0.082 0.198* -0.162 Dry matter content (%) -0.229* 0.514** 0.178* 0.161 0.145 -0.241** 0.360** -0.066 1.000 -0.293** 0.592** Crude Protein content (%) 0.130 -0.093 -0.173* -0.122 0.011 -0.015 -0.093 0.172* -0.233** 1.000 -0.178* Green forage yield (kg/net plot) -0.321** 0.844** 0.337** 0.335** 0.239** -0.268** 0.714** -0.151 0.559** -0.147 1.000 *and ** significant at P= 5 and P = 1 level of significance, respectively
| Character | Days to 50% flowering | Plant height (cm) | No. of leaves / tiller | No. of internodes / tiller | Leaf length (cm) | Leaf width (cm) | Stem girth (cm) | Leaf: stem ratio | Dry matter content (%) | Crude protein content (%) | Green forage yield /(kg /net plot) |
|---|---|---|---|---|---|---|---|---|---|---|---|
| Days to 50% flowering | 1.000 | -0.377** | 0.035 | 0.046 | -0.137 | 0.492** | -0.243** | 0.243** | -0.318** | 0.148 | -0.360** |
| Plant height (cm) | -0.363** | 1.000 | 0.435** | 0.412** | 0.124 | -0.266** | 0.600** | -0.182 | 0.580** | -0.106 | 0.876** |
| No. of leaves/tiller | 0.024 | 0.363** | 1.000 | 0.943** | -0.387** | -0.029 | 0.291** | -0.255** | 0.306** | -0.220* | 0.419** |
| No. of internodes/tiller | 0.036 | 0.328** | 0.926** | 1.000 | -0.230** | 0.085 | 0.319** | -0.232** | 0.257** | -0.169 | 0.427** |
| Leaf length (cm) | -0.125 | 0.117 | -0.258** | -0.123 | 1.000 | 0.213* | 0.330** | 0.181 | 0.188* | 0.023 | 0.274** |
| Leaf width (cm) | 0.453** | -0.249** | -0.003 | 0.083 | 0.183 | 1.000 | -0.232** | 0.350** | -0.279** | 0.009 | -0.310** |
| Stem girth (cm) | -0.219* | 0.574** | 0.251** | 0.281** | 0.297** | -0.189* | 1.000 | -0.142 | 0.428** | -0.114 | 0.755** |
| Leaf: stem ratio | 0.217* | -0.168 | -0.201** | -0.167 | 0.162 | 0.312** | -0.127 | 1.000 | -0.082 | 0.198* | -0.162 |
| Dry matter content (%) | -0.229* | 0.514** | 0.178* | 0.161 | 0.145 | -0.241** | 0.360** | -0.066 | 1.000 | -0.293** | 0.592** |
| Crude Protein content (%) | 0.130 | -0.093 | -0.173* | -0.122 | 0.011 | -0.015 | -0.093 | 0.172* | -0.233** | 1.000 | -0.178* |
| Green forage yield (kg/net plot) | -0.321** | 0.844** | 0.337** | 0.335** | 0.239** | -0.268** | 0.714** | -0.151 | 0.559** | -0.147 | 1.000 |
Table text extracted from the original PDF; superscript letters are shown inline. The original table image is below.
View original table image
Results And Discussions
Days to 50% flowering: recorded significant positive correlation with leaf width (0.492, 0.453), and L:S ratio https://www.biologyjournal.net than phenotypic correlation, indicating characters are helpful for yield improvement.
Acknowledgements
Thankful to Forage laboratory, AICRP on Forage Crops and Utilization, Mahatma Phule Krishi Vidyapeeth, Rahuri for providing facilities to estimate crude protein.
Conclusion
The study reported that among the studied characters, plant height, stem girth, dry matter content, number of internodes per tiller, number of leaves per tiller and leaf length have a significant positive association with forage yield in genotypic and phenotypic levels. The indirect selection of the character is helpful in the improvement of the character for green forage yield. The days to 50% flowering and leaf width are significantly negatively correlated with forage yield. Many characters have genotypic correlation greater
References
9 in the original paper- Bibi A, Shahzad AN, Sadaqat HA, Tahir MHN, Fatima B. Genetic characterization and inheritance studies of oats (Avena sativa) for green fodder yield. Int J Bio Pharm Allied Sci. 2012;1:450-460.
- Dewey DR, Lu KH. A correlation and path coefficient analysis of components of crested wheatgrass seed production. Agron J. 1959;51:515-518.
- Dubey N, Avinashe HA, Jaiwar S, Chichkhede L, Mehta AK. Character association and path analysis study in fodder oat (Avena sativa L.). Environ Ecol. 2015;33(2A):844-848.
- Krishna A, Shahid A, Pandey HC, Bahukhandi D. Estimates of genetic variability, heritability and genetic advance of oat (Avena sativa L.) genotypes for grain and fodder yield. J Agric Sci Res. 2014;3(2):56-61.
- Panse VG, Sukhatme PV. Statistical methods for agricultural workers. New Delhi: Indian Council of Agricultural Research; 1985.
- Raj R, Sachchida NM, Shraddha SB, Shubham, Deepak K, Pandey M. Investigation of various quantitative traits interaction and genetic variability in oats (Avena sativa L.). J Adv Bio Biotechnol. 2025;8(9):382-393.
- Ruwali Y, Verma JS, Kumar L. Comparative genetic diversity analysis of oat (Avena sativa L.) by microsatellite markers and morphological rainfed expressions. Afr J Biotechnol. 2013;12:3414-3424.
- Wagh VR, Sonone AH, Damame SV. Assessment of genetic variability, correlations and path coefficient analysis in forage oat (Avena sativa L.). Forage Res. 2018;44(3):172-175.
- Yaduvanshi N, Shweta RKY, Maurya CL, Shashi K. Correlation and path coefficient analyses for grain and fodder yield in F1 and F2 generations of oats (Avena sativa L.). Int J Adv Biochem Res. 2025;9(2):69-79. Plant height (cm): It has a positive correlation with No. of leaves / tiller (0.4.5, 0.363), No. of internodes / tiller (0.413, 0.328), stem girth (0.600, 0.574) and dry matter per cent (0.580, 0.14) at both levels. However, negatively correlated with leaf width (-0.266, -0.249). Selection of plant height was rewarded for character stem girth, no. of leaves and dry matter %. No. of leaves per tiller: It has positive correlation with number of internodes / tiller (0.943, 0.926), stem girth (0.291, 0.251) and dry matter content (0.306, 0.178). The character was negatively correlated with the character leaf length (-0.387, -0.258), L:S ratio (-0.255, -0.201) and crude protein content (-0.220, -0.173) at genotypic and phenotypic level. No. of internodes /tiller: It has a significant positive correlation with stem girth (0.319, 0.281) at both levels, dry matter % (0.257) at genotypic level and negatively correlated with leaf length (-0.230) and L:S ratio (- 0.232) at genotypic level only. Leaf length (cm): It has a significant positive correlation with stem girth (0.330, 0.297) at genotypic and phenotypic level. Genotypically, it is positively correlated with leaf width (0.213) and dry matter content (0.188). Leaf width (cm): It has a significant positive correlation with L:S ratio (0.350, 0.312) and negatively correlated with stem girth (-0.232, -0.189) and dry matter content (-0.279, -0.241) at both levels. Stem girth (cm): It has a positive correlation with dry matter content (0.428, 0.360) in genotypic and phenotypic levels. Leaf: stem ratio: It has a positive correlation with crude protein content (0.198, 0.172) in genotypic as well as phenotypic levels, respectively. Dry matter content (%): It has a negative correlation with crude protein content (-0.293, -0233) at genotypic and phenotypic levels. In genotypic and phenotypic levels, characters viz., plant height (0.876, 0.844), stem girth (0.755, 0.714), dry matter content (0.592, 0.559), no. of internodes / tiller (0.427, 0.335) and no. of leaves / tiller (0.419, 0.337) and leaf length (0.274, 0.239) had significant positive correlation with green forage yield. Similar results supported by Bibi et al., (2012) [1] for flowering, Krishna et al., (2014) [4] for no. of leaves and stem girth, Dubey et al., (2015) [3] for no. of leaves and dry matter content, Wagh et al., (2018) [8] for plant height, stem girth, leaf width, crude protein and no. of leaves, Raj et al. (2025) [6] for no. of tillers per plant and seed yield, and Yaduvanshi et al. (2025) [9] for seed yield / plant, plant height, number of tillers per plant, leaf: stem ratio.