Scinovex

Research article · 2026 · Full text

International Journal of Biology Sciences

Influence of foliar application of nutrients on total yield per annum and leaf nutrient status of Guava (Psidium guajava) cv. L-49

Priya YadavGaurav KantRupakshi .JR SharmaSatpal Baloda

Volume 8(2) · Pages 100–105 · DOI: 10.33545/26649926.2026.v8.i2b.584 ↗

Research areasPlant Physiology and Cultivation StudiesPsidium guajava Extracts and ApplicationsLeaf Properties and Growth Measurement

↓ Read full-text PDF0 citations

Abstract

Author-written

A field experiment was carried out in the Experimental Orchard of Department of Horticulture, CCS Haryana Agricultural University, Hisar during 2016-17, to study the effect of foliar sprays of ZnSO4 (0.50, 0.75 and 1.00%), FeSO4 (0.2, 0.4 and 0.6%), K2SO4 (0.5, 1.0 and 1.5%) and Urea (1.0, 1.5 and 2.0%) along with control (water spray) before flowering and after fruit set, during rainy and winter seasons, on total yield and leaf nutrient status of guava (Psidium guajava L.) cv. L-49. The findings of the experiment revealed that the foliar application of various nutrients significantly influenced the total yield and leaf nutrient status of the plants over control. Total yield per tree per annum was recorded to be maximum (62.07 kg/tree) under ZnSO4 @1.00 per cent, which was significantly higher than all other treatments except ZnSO4 @0.75 per cent (61.39 kg/tree), while the minimum (50.46 kg/tree) was recorded under control. Maximum N content (1.78%) was obtained with the spray of Urea @2.0 per cent that was closely followed by Urea @1.5 per cent (1.76%), while the minimum (1.57%) was obtained under K2SO4 @1.0 per cent. Maximum P (0.23%) and K content (1.79%) were obtained with K2SO4 @1.5 per cent, which was closely followed K2SO4 @1.0 per cent by (0.22% P and 1.77% K) whereas, minimum P content (0.15%) was recorded under Urea @1.5 and 2.0 per cent and minimum K content (1.63%) was recorded under Urea @1.0 per cent and FeSO4 @0.2 per cent. Maximum Zn content (48.02 ppm) was obtained with the spray of ZnSO4 @1.00 per cent, which was closely followed by ZnSO4 @0.75 per cent (46.87 ppm) and the minimum (31.12 ppm) was obtained under control. Maximum Fe content (179.1 ppm) was obtained with the spray of FeSO4 @0.6 per cent that was closely followed by FeSO4 @0.4 per cent (177.3 ppm), while the minimum was obtained under Urea @2.0 per cent (153.1 ppm) followed by Urea @1.5 per cent (154.9 ppm).

Summary

Source-checked

Plain-language reading of the full paper, prepared with AI and checked against the text. Each point links to the authors' own words.

  1. Why it matters

    • Guava is a significant tropical and sub-tropical fruit crop valued for its high nutritional content and ability to grow in adverse conditions. View evidence ↗

      Why it matters

      Guava is a significant tropical and sub-tropical fruit crop valued for its high nutritional content and ability to grow in adverse conditions.

      In the paper's own words

      “Guava is one of the most important tropical/ sub-tropical fruit, because of its high nutritive value and possibilities of cultivation even under adverse conditions.”

      Page 1

      Found in: Introduction

      Read it in the full textOpen PDF at page 1 ↗
    • Because guava is often grown in poor soils, it frequently suffers from nutrient deficiencies that reduce the fruit's quality and storage life. View evidence ↗

      Why it matters

      Because guava is often grown in poor soils, it frequently suffers from nutrient deficiencies that reduce the fruit's quality and storage life.

      In the paper's own words

      “Guava is generally cultivated in poor soil due to which it suffers from different nutrients deficiency, that resultsa in the loss of quality and storage life of this important fruit crop.”

      Page 1

      Found in: Introduction

      Read it in the full textOpen PDF at page 1 ↗
    • Applying micronutrients directly to the leaves (foliar application) is a vital method for improving crop quality and is more effective for rapid plant recovery in high pH environments. View evidence ↗

      Why it matters

      Applying micronutrients directly to the leaves (foliar application) is a vital method for improving crop quality and is more effective for rapid plant recovery in high pH environments.

      In the paper's own words

      “The foliar application of micronutrients plays vital role in improving the quality and comparatively more effective for rapid recovery of plants under high pH conditions.”

      Page 1

      Found in: Introduction

      Read it in the full textOpen PDF at page 1 ↗
  2. The question

    • The study aimed to evaluate how foliar nutrient applications affect the annual total yield and the nutrient status of the leaves in guava cultivar L-49 (also known as Sardar). View evidence ↗

      The question

      The study aimed to evaluate how foliar nutrient applications affect the annual total yield and the nutrient status of the leaves in guava cultivar L-49 (also known as Sardar).

      In the paper's own words

      “The present investigation was therefore, undertaken during 2016-2017 to evaluate the effect of foliar application of nutrients on the total yield per annum and leaf nutrient status of guava cv. Sardar.”

      Page 2

      Found in: Introduction

      Read it in the full textOpen PDF at page 2 ↗
  3. What they did

    • The experiment used a randomized block design on 4-year-old L-49 guava plants spaced 6x6m, testing various concentrations of ZnSO4, FeSO4, K2SO4, and Urea against a water-spray control. View evidence ↗

      What they did

      The experiment used a randomized block design on 4-year-old L-49 guava plants spaced 6x6m, testing various concentrations of ZnSO4, FeSO4, K2SO4, and Urea against a water-spray control.

      In the paper's own words

      “The experiment comprising of ZnSO4 (0.50, 0.75 and 1.00%), FeSO4 (0.2, 0.4 and 0.6%), K2SO4 (0.5, 1.0 and 1.5%) and Urea (1.0, 1.5 and 2.0%) along with control (water spray) were laid out in randomized block design on 4 year old guava plants cv. L-49 planted at 6 x 6 m apart.”

      Page 2

      Found in: Material methods

      Read it in the full textOpen PDF at page 2 ↗
    • Foliar sprays were applied before flowering and after fruit set during both the rainy and winter seasons. View evidence ↗

      What they did

      Foliar sprays were applied before flowering and after fruit set during both the rainy and winter seasons.

      In the paper's own words

      “to study the effect of foliar sprays of ZnSO4 (0.50, 0.75 and 1.00%), FeSO4 (0.2, 0.4 and 0.6%), K2SO4 (0.5, 1.0 and 1.5%) and Urea (1.0, 1.5 and 2.0%) along with control (water spray) before flowering and after fruit set, during rainy and winter seasons”

      Page 1

      Found in: Material methods

      Read it in the full textOpen PDF at page 1 ↗
    • Leaf nutrient analysis was performed using colorimetric/Nessler's methods for Nitrogen, the vanadomolybdo-phosphoric acid method for Phosphorus, flame photometry for Potassium, and atomic absorption spectrophotometry for Zinc and Iron. View evidence ↗

      What they did

      Leaf nutrient analysis was performed using colorimetric/Nessler's methods for Nitrogen, the vanadomolybdo-phosphoric acid method for Phosphorus, flame photometry for Potassium, and atomic absorption spectrophotometry for Zinc and Iron.

      In the paper's own words

      “Nitrogen (Colorimetric or Nessler’s reagent method, Lindner, 1944) [6], phosphorus (Vanadomolybdo-phosphoric acid yellow colour method, Koeing and Johnson, 1942) [5], potassium (Flame photometer), Zn and Fe (Using atomic absorption spectrophotometer) contents in sample were analyzed.”

      Page 2

      Found in: Leaf sample analysis:

      Read it in the full textOpen PDF at page 2 ↗
  4. What they found

    • The highest annual yield per tree was 62.07 kg under 1.00% ZnSO4, which was significantly higher than the control yield of 50.46 kg/tree. View evidence ↗

      What they found

      The highest annual yield per tree was 62.07 kg under 1.00% ZnSO4, which was significantly higher than the control yield of 50.46 kg/tree.

      In the paper's own words

      “Total yield per tree per annum was recorded to be maximum (62.07 kg/tree) under ZnSO4 @1.00 per cent, which was significantly higher than all other treatments except ZnSO4 @0.75 per cent (61.39 kg/tree), while the minimum (50.46 kg/tree) was recorded under control.”

      Page 2

      Found in: Results and discussion

      Read it in the full textOpen PDF at page 2 ↗
    • The highest leaf nitrogen content (1.78%) was achieved with 2.0% Urea spray, while the lowest (1.57%) occurred with 1.0% K2SO4. View evidence ↗

      What they found

      The highest leaf nitrogen content (1.78%) was achieved with 2.0% Urea spray, while the lowest (1.57%) occurred with 1.0% K2SO4.

      In the paper's own words

      “Maximum N content (1.78%) was obtained with the spray of Urea @2.0 per cent that was closely followed by Urea @1.5 per cent (1.76%), while the minimum (1.57%) was obtained under K2SO4 @1.0 per cent.”

      Page 1

      Found in: Nutrient analysis

      Read it in the full textOpen PDF at page 1 ↗
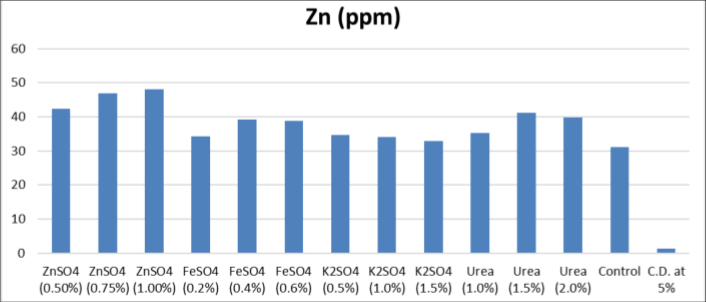
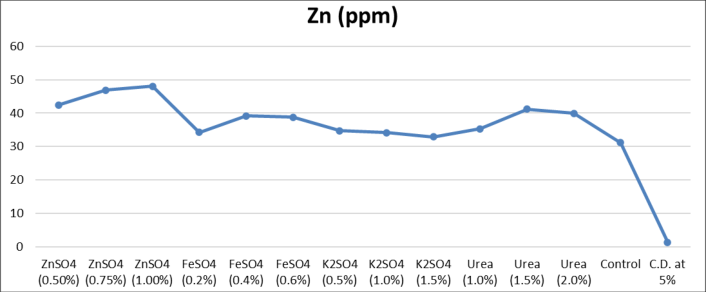
    • Leaf zinc content peaked at 48.02 ppm with 1.00% ZnSO4 spray, compared to a minimum of 31.12 ppm in the control group. View evidence ↗

      What they found

      Leaf zinc content peaked at 48.02 ppm with 1.00% ZnSO4 spray, compared to a minimum of 31.12 ppm in the control group.

      In the paper's own words

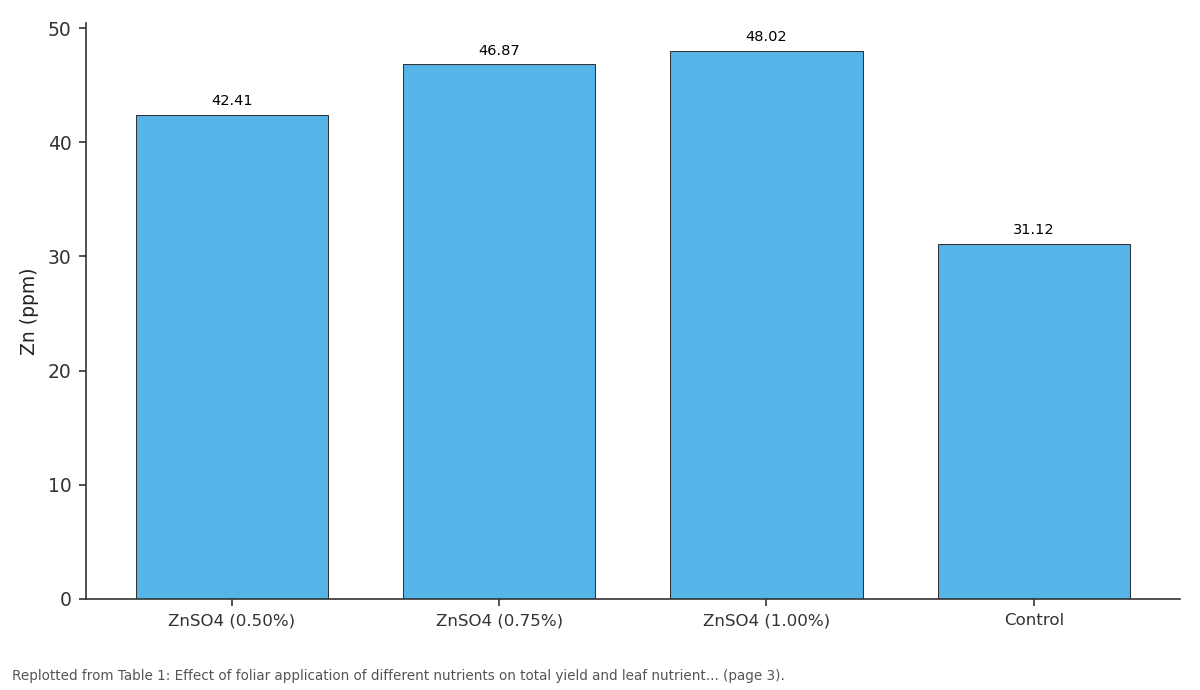
      “Maximum Zn content (48.02 ppm) was obtained with the spray of ZnSO4 @1.00 per cent, which was closely followed by ZnSO4 @0.75 per cent (46.87 ppm) and the minimum (31.12 ppm) was obtained under control.”

      Page 3

      Found in: Nutrient analysis

      Read it in the full textOpen PDF at page 3 ↗
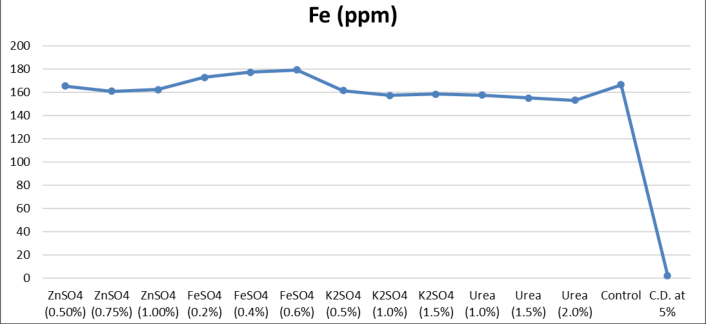
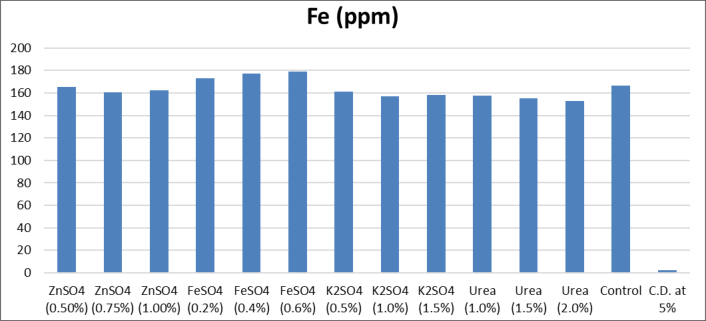
    • The highest iron content (179.1 ppm) was recorded with 0.6% FeSO4 spray, while the lowest (153.1 ppm) was found with 2.0% Urea. View evidence ↗

      What they found

      The highest iron content (179.1 ppm) was recorded with 0.6% FeSO4 spray, while the lowest (153.1 ppm) was found with 2.0% Urea.

      In the paper's own words

      “Maximum Fe content (179.1 ppm) was obtained with the spray of FeSO4 @0.6 per cent that was closely followed by FeSO4 @0.4 per cent (177.3 ppm), while the minimum was obtained under Urea @2.0 per cent (153.1 ppm) followed by Urea @1.5 per cent (154.9 ppm).”

      Page 3

      Found in: Nutrient analysis

      Read it in the full textOpen PDF at page 3 ↗
  5. What it means

    • The authors conclude that foliar application of nutrients significantly improves both the total yield and the leaf nutrient status of guava plants compared to no treatment. View evidence ↗

      What it means

      The authors conclude that foliar application of nutrients significantly improves both the total yield and the leaf nutrient status of guava plants compared to no treatment.

      In the paper's own words

      “The findings of the experiment revealed that the foliar application of various nutrients significantly influenced the total yield and leaf nutrient status of the plants over control.”

      Page 1

      Found in: Material methods

      Read it in the full textOpen PDF at page 1 ↗

Visual summary

3 visuals

Illustrations explain the paper; charts are replotted from the paper's own table values.
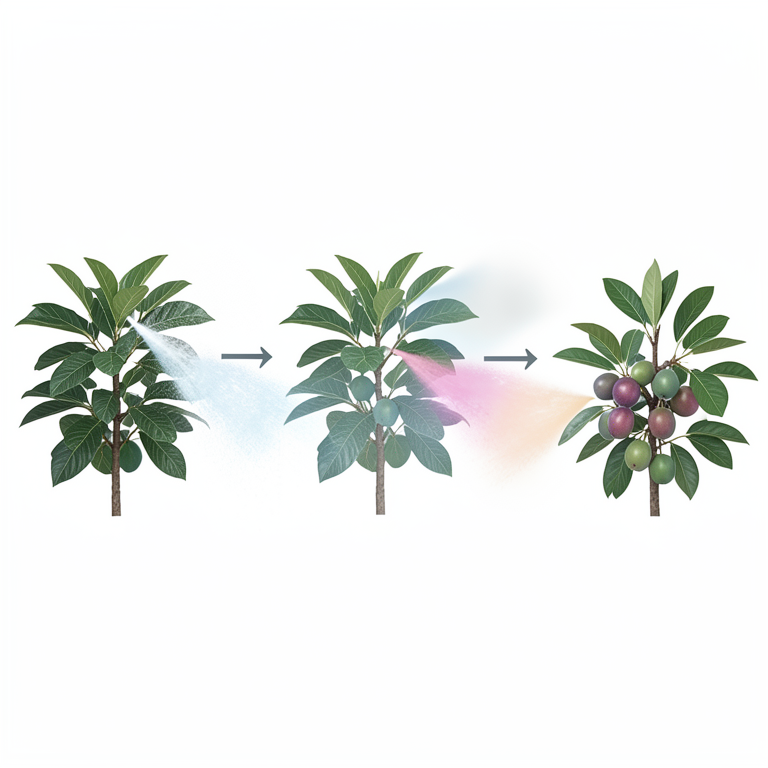
AI-generated illustration
AI-generated conceptual illustration (Guava plants (Psidium guajava cv. L-49)). It explains the idea and does not show study data.↗ Enlarge
Experimental Setup Concept
AI-generated conceptual illustration (Guava plants (Psidium guajava cv. L-49)). It explains the idea and does not show study data.

AI-generated conceptual illustration (Guava plants (Psidium guajava cv. L-49)). It explains the idea and does not show study data.

Open full-size image ↗

Experimental Setup Concept

AI-generated conceptual illustration (Guava plants (Psidium guajava cv. L-49)). It explains the idea and does not show study data.

View source evidence ↗
Replotted from source data
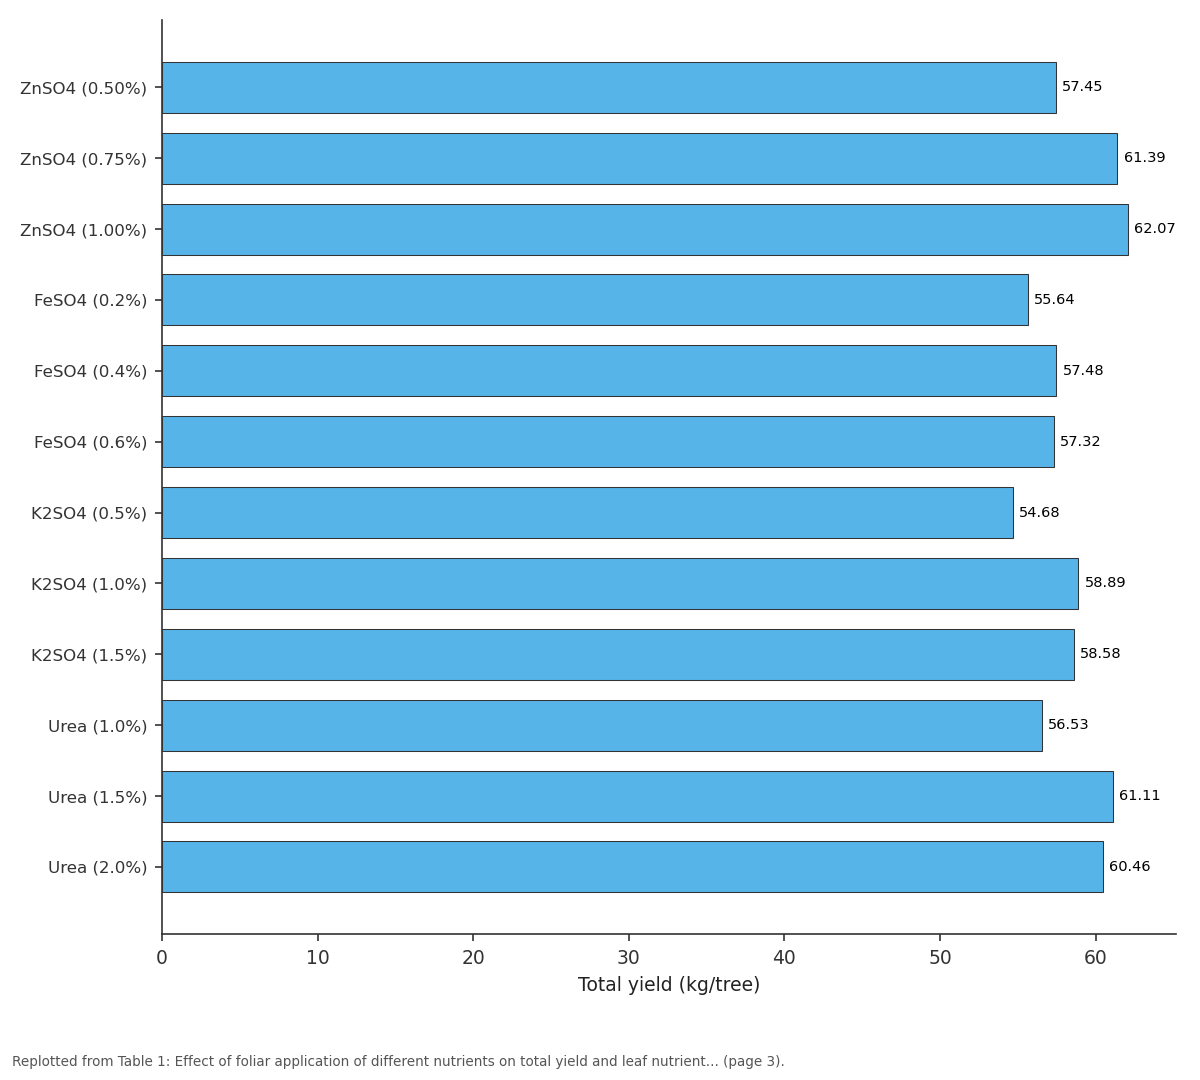
Replotted from Table 1 (page 3) of the original paper. Every bar is the paper's own table value.↗ Enlarge
Total yield (kg/tree): ZnSO4 (0.50%) vs ZnSO4 (0.75%) vs ZnSO4 (1.00%) vs FeSO4 (0.2%) vs FeSO4 (0.4%)
Replotted from Table 1 (page 3) of the original paper. Every bar is the paper's own table value.

Replotted from Table 1 (page 3) of the original paper. Every bar is the paper's own table value.

Open full-size image ↗

Total yield (kg/tree): ZnSO4 (0.50%) vs ZnSO4 (0.75%) vs ZnSO4 (1.00%) vs FeSO4 (0.2%) vs FeSO4 (0.4%)

Replotted from Table 1 (page 3) of the original paper. Every bar is the paper's own table value.

View source evidence ↗
Replotted from source data
Replotted from Table 1 (page 3) of the original paper. Every bar is the paper's own table value.↗ Enlarge
Zn (ppm): ZnSO4 (0.50%) vs ZnSO4 (0.75%) vs ZnSO4 (1.00%) vs Control
Replotted from Table 1 (page 3) of the original paper. Every bar is the paper's own table value.

Replotted from Table 1 (page 3) of the original paper. Every bar is the paper's own table value.

Open full-size image ↗

Zn (ppm): ZnSO4 (0.50%) vs ZnSO4 (0.75%) vs ZnSO4 (1.00%) vs Control

Replotted from Table 1 (page 3) of the original paper. Every bar is the paper's own table value.

View source evidence ↗

Figures & tables

From the original paper
Bar chart showing total yield (kg/tree) for various nutrient treatments (ZnSO4, FeSO4, K2SO4, Urea) at different concentrationsFigure 1Page 2Line chart showing total yield (kg/tree) for nutrient treatments (ZnSO4, FeSO4, K2SO4, Urea) at different concentrations compared toFigure 2Page 2Effect of foliar application of different nutrients on total yield and leaf nutrient content of guava (Psidium guajava L.) cv. L-49Table 1Page 3Bar chart showing nitrogen percentage (N %) for various nutrient treatments (ZnSO4, FeSO4, K2SO4, Urea) at differentFigure 3Page 3Line chart showing nitrogen percentage (N %) for nutrient treatments (ZnSO4, FeSO4, K2SO4, Urea) at different concentrationsFigure 4Page 3Bar chart showing phosphorus percentage (P %) for various nutrient treatments (ZnSO4, FeSO4, K2SO4, Urea) at differentFigure 5Page 4Line chart showing phosphorus percentage (P %) for nutrient treatments (ZnSO4, FeSO4, K2SO4, Urea) at different concentrationsFigure 6Page 4Line chart showing potassium percentage (K %) for nutrient treatments (ZnSO4, FeSO4, K2SO4, Urea) at different concentrationsFigure 7Page 4Bar chart showing potassium percentage (K %) for various nutrient treatments (ZnSO4, FeSO4, K2SO4, Urea) at differentFigure 8Page 4Bar chart showing zinc levels (Zn in ppm) for nutrient treatments (ZnSO4, FeSO4, K2SO4, Urea) at different concentrationsFigure 9Page 5Line chart showing zinc levels (Zn in ppm) for nutrient treatments (ZnSO4, FeSO4, K2SO4, Urea) at different concentrationsFigure 10Page 5Line chart showing iron levels (Fe in ppm) for nutrient treatments (ZnSO4, FeSO4, K2SO4, Urea) at different concentrationsFigure 11Page 5Bar chart showing iron levels (Fe in ppm) for various nutrient treatments (ZnSO4, FeSO4, K2SO4, Urea) at different concentrationsFigure 12Page 5Grouped bar chart showing N (%), P (%), K (%), Zn (ppm), and Fe (ppm) values across various nutrient treatments andFigure 13Page 6Line graph comparing N (%), P (%), K (%), Zn (ppm), and Fe (ppm) values across various nutrient treatments and concentrationsFigure 14Page 6
FULL TEXT Original article · reflowed for reading

Introduction

Fruit crops occupy a central role in the world of agriculture. Guava is one of the most important tropical/ sub-tropical fruit, because of its high nutritive value and possibilities of cultivation even under adverse conditions. This belongs to the family Myrtaceae with basic chromosome number n = 11. It was introduced by the Portuguese in India during 17th century. In India, guava covers total area of 268.2 thousand hectares, with an annual production of 3667.9 thousand MT. The average productivity of guava is 13.7MT/ha. Haryana has 11.2 thousand hectare area and 152.2 thousand metric tonnes production under guava cultivation with a productivity of 13.59 MT/ha (Anonymous, 2016) [2] . The major guava producing districts of Haryana are Hisar, Sirsa, Fatehabad, Jind, Jhajjar, Sonipat, Karnal, Yamuna Nagar, Mewat and Ambala (Saxena and Gandhi, 2015) [8] . As guava tree produce fruits round the year, the maximum growth of the plants needs an optimum availability of all macro and micronutrients. If the nutritional balance is disturbed due to insufficient or excess of essential elements during the active growth period, disorder of growth manifestations will occur and special symptoms will develop on sooner or later. Guava is generally cultivated in poor soil due to which it suffers from different nutrients deficiency, that resultsa in the loss of quality and storage life of this important fruit crop. The foliar application of micronutrients plays vital role in improving the quality and comparatively more effective for rapid recovery of plants under high pH conditions. The foliar feeding of fruit trees has gained much importance in recent years, as nutrients applied through soil are needed in higher quantities due to leaching losses and also due to unavailability to the plant because of complex soil reaction.

Regular foliar spray of micronutrients is beneficial to increase fruit yield. Based on this fact, several workers have tried to study the effect of foliar feeding of nutrients to meet their immediate requirement in the growth and development of fruit with success upto certain extent. The present investigation was therefore, undertaken during 2016-2017 to evaluate the effect of foliar application of nutrients on the total yield per annum and leaf nutrient status of guava cv. Sardar.

Material methods

The present investigation entitled, "Studies on influence of foliar application of nutrients on growth, yield and quality of guava (Psidium guajava L.) cv. L-49" was carried out in the Department of Horticulture, CCS Haryana Agricultural University, Hisar during 2016-17. The experiment comprising of ZnSO4 (0.50, 0.75 and 1.00%), FeSO4 (0.2, 0.4 and 0.6%), K2SO4 (0.5, 1.0 and 1.5%) and Urea (1.0, 1.5 and 2.0%) along with control (water spray) were laid out in randomized block design on 4 year old guava plants cv. L-49 planted at 6 x 6 m apart. The observations on total yield and leaf nutrient content status of guava plants were taken as per standard procedures.

Leaf sample analysis:

For nutrient analysis oven dried plant material from each tagged plant was grinded separately with grinder. Nitrogen (Colorimetric or Nessler's reagent method, Lindner, 1944) [6] , phosphorus (Vanadomolybdo-phosphoric acid yellow colour method, Koeing and Johnson, 1942) [5] , potassium (Flame photometer), Zn and Fe (Using atomic absorption spectrophotometer) contents in sample were analyzed. The important findings of the investigation were recorded.

Selection of variety

The present study was conducted on cultivar 'Lucknow-49', also known as 'Sardar Guava'. It is a chance seedling selection from 'Allahabad Safeda' at Pune. L-49 is a semidwarf tree of 2.3 to 3.4 m height with heavy bearing habit, vigorous and heavy branching with long flat crown (Gaur et al., 2014) [4] .

Results and discussion

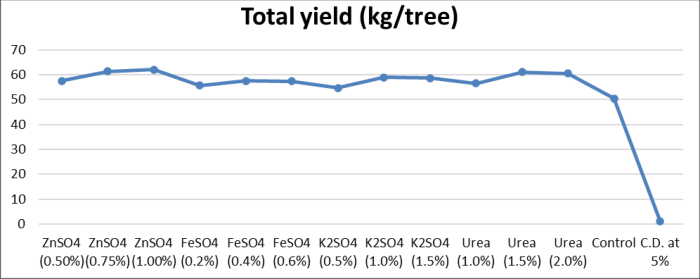
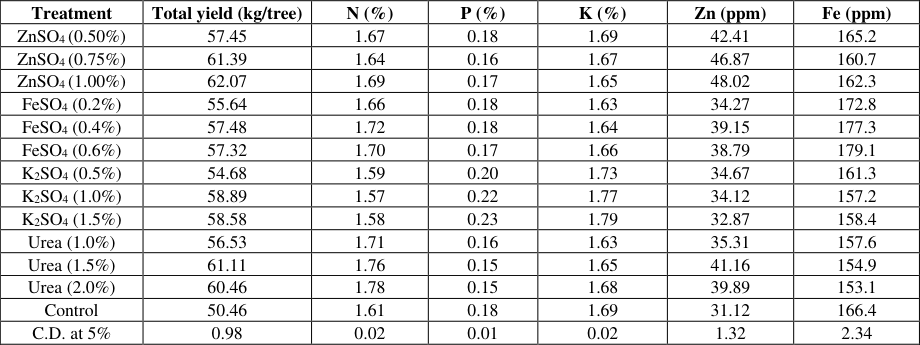
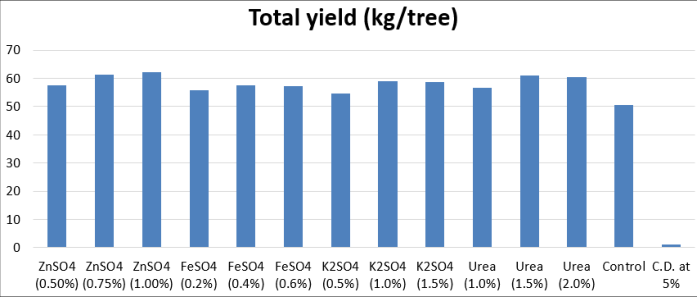
Total yield Data pertaining to total yield per tree per annum is depicted in table 1. A perusal of the data shows that the effect of foliar application of nutrients on total yield per tree per annum of guava cv. L-49 was found significant. Total yield per tree per annum was recorded to be maximum (62.07 kg/tree) under ZnSO4 @1.00 per cent, which was significantly higher than all other treatments except ZnSO4 @0.75 per cent (61.39 kg/tree), while the minimum (50.46 kg/tree) was recorded under control.

Table 1. Effect of foliar application of different nutrients on total yield and leaf nutrient content of guava (Psidium guajava L.) cv. L-49
TreatmentTotal yield (kg/tree)N (%)P (%)K (%)Zn (ppm)Fe (ppm)
ZnSO4 (0.50%)57.451.670.181.6942.41165.2
ZnSO4 (0.75%)61.391.640.161.6746.87160.7
ZnSO4 (1.00%)62.071.690.171.6548.02162.3
FeSO4 (0.2%)55.641.660.181.6334.27172.8
FeSO4 (0.4%)57.481.720.181.6439.15177.3
FeSO4 (0.6%)57.321.700.171.6638.79179.1
K2SO4 (0.5%)54.681.590.201.7334.67161.3
K2SO4 (1.0%)58.891.570.221.7734.12157.2
K2SO4 (1.5%)58.581.580.231.7932.87158.4
Urea (1.0%)56.531.710.161.6335.31157.6
Urea (1.5%)61.111.760.151.6541.16154.9
Urea (2.0%)60.461.780.151.6839.89153.1
Control50.461.610.181.6931.12166.4
C.D. at 5%0.980.020.010.021.322.34

Table text extracted from the original PDF; superscript letters are shown inline. The original table image is below.

View original table image
Effect of foliar application of different nutrients on total yield and leaf nutrient content of guava (Psidium guajava L.) cv. L-49↗ Enlarge
Table 1
Effect of foliar application of different nutrients on total yield and leaf nutrient content of guava (Psidium guajava L.) cv. L-49

Effect of foliar application of different nutrients on total yield and leaf nutrient content of guava (Psidium guajava L.) cv. L-49

Open full-size image ↗
Original paper tableSource PDF · page 3 ↗

Nutrient analysis

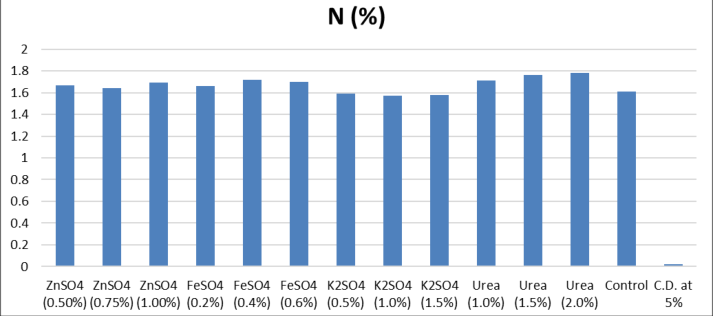
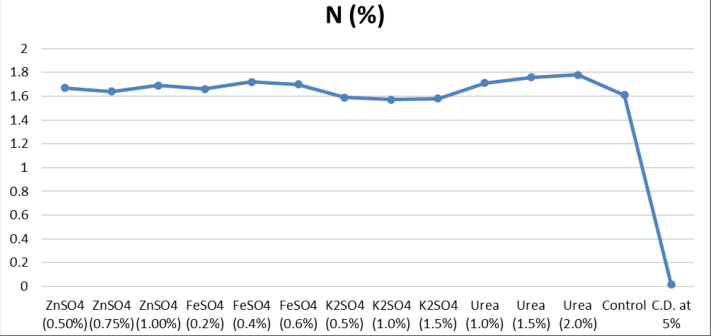
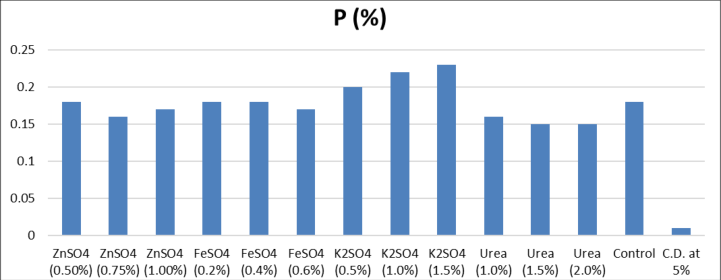
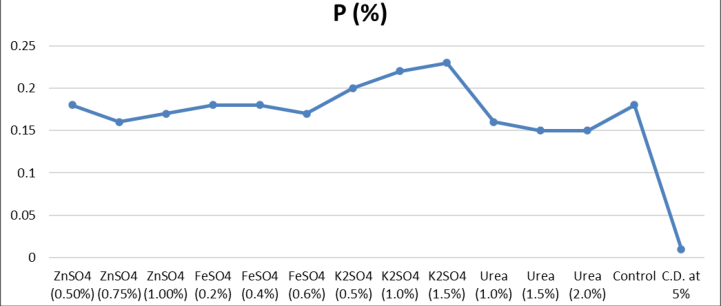
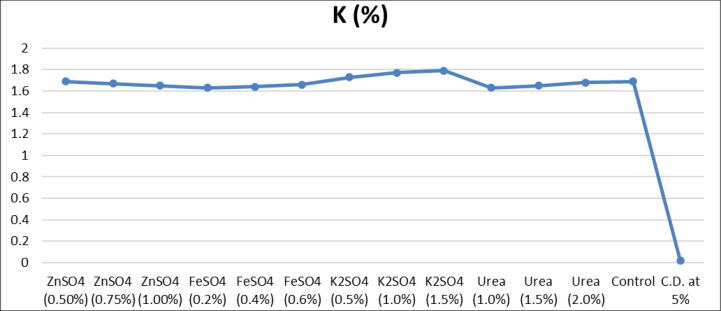
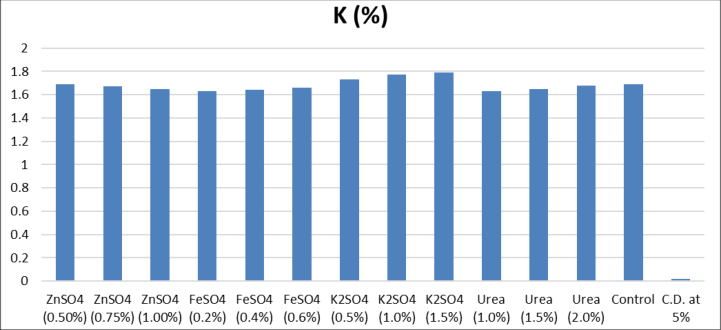
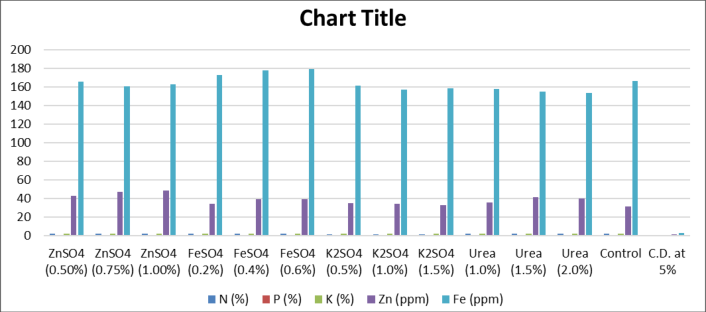
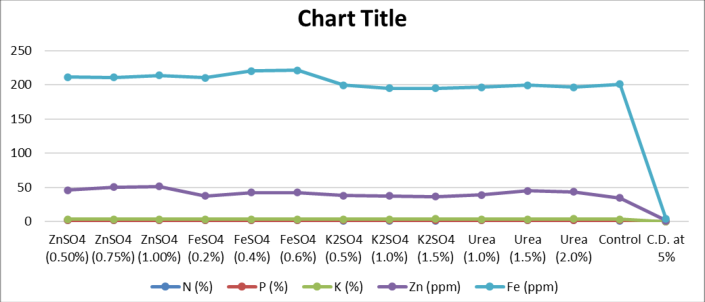
The data concerning the leaf sample analysis for N, P, K, Zn and Fe are shown in Table 1. A brief appraisal of the data clearly indicates that all the treatments were found significant in altering the leaf N, P, K, Zn and Fe content over control. Maximum N content (1.78%) was obtained with the spray of Urea @2.0 per cent that was closely followed by Urea @1.5 per cent (1.76%), while the minimum (1.57%) was obtained under K2SO4 @1.0 per cent. Maximum P (0.23%) and K content (1.79%) were obtained with K2SO4 @1.5 per cent, which was closely followed by K2SO4 @1.0 per cent (0.22% P and 1.77% K) whereas, minimum P content (0.15%) was recorded under Urea @1.5 and 2.0 per cent and minimum K content (1.63%) was recorded under Urea @1.0 per cent and FeSO4 @0.2 per cent. Maximum Zn content (48.02 ppm) was obtained with the spray of ZnSO4 @1.00 per cent, which was closely followed by ZnSO4 @0.75 per cent (46.87 ppm) and the minimum (31.12 ppm) was obtained under control. Maximum Fe content (179.1 ppm) was obtained with the spray of FeSO4 @0.6 per cent that was closely followed by FeSO4 @0.4 per cent (177.3 ppm), while the minimum was obtained under Urea @2.0 per cent (153.1 ppm) followed by Urea @1.5 per cent (154.9 ppm). This increase in leaf N, Zn and Fe content might be due to the fact that application of urea, zinc sulphate and ferrous sulphate improved the concentration of these in plant tissue. Reduced P and K with foliar sprays of urea may be due to luxuriant growth and yield leading to higher biomass production which counter balanced the content of these elements, i.e. dilution effect (Dalal et al., 2011) [3] . These results are further supported by the findings of Dalal et al., (2011) [3] who reported that maximum leaf N (2.64%) content was obtained with spray of urea @2.0 per cent and minimum (2.18%) with K2SO4 @1.0 per cent, the maximum P (0.272%) and K (1.16%) contents with K2SO4 @1.0 per cent and minimum (0.203 and 0.85%) with Urea @2.0 per cent spray, respectively, maximum zinc (180.26 ppm) with ZnSO4 @0.5 per cent and maximum iron (184.32 ppm) with ZnSO4 @0.5 per cent sprays, respectively in ber leaves. Similar results were earlier reported by Prasad et al., (2017) [7] in Kinnow mandarin and Ahmad Khan et al., (2012) [1] in Feutell's Early (Citrus reticulate Blanco.) tree.

Figures and tables from the paper

Figure 1. Bar chart showing total yield (kg/tree) for various nutrient treatments (ZnSO4, FeSO4, K2SO4, Urea) at different concentrations
Bar chart showing total yield (kg/tree) for various nutrient treatments (ZnSO4, FeSO4, K2SO4, Urea) at different concentrations↗ Enlarge
Figure 1
Bar chart showing total yield (kg/tree) for various nutrient treatments (ZnSO4, FeSO4, K2SO4, Urea) at different concentrations

Bar chart showing total yield (kg/tree) for various nutrient treatments (ZnSO4, FeSO4, K2SO4, Urea) at different concentrations

Open full-size image ↗
Original paper figureSource PDF · page 2 ↗
Figure 2. Line chart showing total yield (kg/tree) for nutrient treatments (ZnSO4, FeSO4, K2SO4, Urea) at different concentrations compared to
Line chart showing total yield (kg/tree) for nutrient treatments (ZnSO4, FeSO4, K2SO4, Urea) at different concentrations compared to↗ Enlarge
Figure 2
Line chart showing total yield (kg/tree) for nutrient treatments (ZnSO4, FeSO4, K2SO4, Urea) at different concentrations compared to

Line chart showing total yield (kg/tree) for nutrient treatments (ZnSO4, FeSO4, K2SO4, Urea) at different concentrations compared to

Open full-size image ↗
Original paper figureSource PDF · page 2 ↗
Figure 3. Bar chart showing nitrogen percentage (N %) for various nutrient treatments (ZnSO4, FeSO4, K2SO4, Urea) at different
Bar chart showing nitrogen percentage (N %) for various nutrient treatments (ZnSO4, FeSO4, K2SO4, Urea) at different↗ Enlarge
Figure 3
Bar chart showing nitrogen percentage (N %) for various nutrient treatments (ZnSO4, FeSO4, K2SO4, Urea) at different

Bar chart showing nitrogen percentage (N %) for various nutrient treatments (ZnSO4, FeSO4, K2SO4, Urea) at different

Open full-size image ↗
Original paper figureSource PDF · page 3 ↗
Figure 4. Line chart showing nitrogen percentage (N %) for nutrient treatments (ZnSO4, FeSO4, K2SO4, Urea) at different concentrations
Line chart showing nitrogen percentage (N %) for nutrient treatments (ZnSO4, FeSO4, K2SO4, Urea) at different concentrations↗ Enlarge
Figure 4
Line chart showing nitrogen percentage (N %) for nutrient treatments (ZnSO4, FeSO4, K2SO4, Urea) at different concentrations

Line chart showing nitrogen percentage (N %) for nutrient treatments (ZnSO4, FeSO4, K2SO4, Urea) at different concentrations

Open full-size image ↗
Original paper figureSource PDF · page 3 ↗
Figure 5. Bar chart showing phosphorus percentage (P %) for various nutrient treatments (ZnSO4, FeSO4, K2SO4, Urea) at different
Bar chart showing phosphorus percentage (P %) for various nutrient treatments (ZnSO4, FeSO4, K2SO4, Urea) at different↗ Enlarge
Figure 5
Bar chart showing phosphorus percentage (P %) for various nutrient treatments (ZnSO4, FeSO4, K2SO4, Urea) at different

Bar chart showing phosphorus percentage (P %) for various nutrient treatments (ZnSO4, FeSO4, K2SO4, Urea) at different

Open full-size image ↗
Original paper figureSource PDF · page 4 ↗
Figure 6. Line chart showing phosphorus percentage (P %) for nutrient treatments (ZnSO4, FeSO4, K2SO4, Urea) at different concentrations
Line chart showing phosphorus percentage (P %) for nutrient treatments (ZnSO4, FeSO4, K2SO4, Urea) at different concentrations↗ Enlarge
Figure 6
Line chart showing phosphorus percentage (P %) for nutrient treatments (ZnSO4, FeSO4, K2SO4, Urea) at different concentrations

Line chart showing phosphorus percentage (P %) for nutrient treatments (ZnSO4, FeSO4, K2SO4, Urea) at different concentrations

Open full-size image ↗
Original paper figureSource PDF · page 4 ↗
Figure 7. Line chart showing potassium percentage (K %) for nutrient treatments (ZnSO4, FeSO4, K2SO4, Urea) at different concentrations
Line chart showing potassium percentage (K %) for nutrient treatments (ZnSO4, FeSO4, K2SO4, Urea) at different concentrations↗ Enlarge
Figure 7
Line chart showing potassium percentage (K %) for nutrient treatments (ZnSO4, FeSO4, K2SO4, Urea) at different concentrations

Line chart showing potassium percentage (K %) for nutrient treatments (ZnSO4, FeSO4, K2SO4, Urea) at different concentrations

Open full-size image ↗
Original paper figureSource PDF · page 4 ↗
Figure 8. Bar chart showing potassium percentage (K %) for various nutrient treatments (ZnSO4, FeSO4, K2SO4, Urea) at different
Bar chart showing potassium percentage (K %) for various nutrient treatments (ZnSO4, FeSO4, K2SO4, Urea) at different↗ Enlarge
Figure 8
Bar chart showing potassium percentage (K %) for various nutrient treatments (ZnSO4, FeSO4, K2SO4, Urea) at different

Bar chart showing potassium percentage (K %) for various nutrient treatments (ZnSO4, FeSO4, K2SO4, Urea) at different

Open full-size image ↗
Original paper figureSource PDF · page 4 ↗
Figure 9. Bar chart showing zinc levels (Zn in ppm) for nutrient treatments (ZnSO4, FeSO4, K2SO4, Urea) at different concentrations
Bar chart showing zinc levels (Zn in ppm) for nutrient treatments (ZnSO4, FeSO4, K2SO4, Urea) at different concentrations↗ Enlarge
Figure 9
Bar chart showing zinc levels (Zn in ppm) for nutrient treatments (ZnSO4, FeSO4, K2SO4, Urea) at different concentrations

Bar chart showing zinc levels (Zn in ppm) for nutrient treatments (ZnSO4, FeSO4, K2SO4, Urea) at different concentrations

Open full-size image ↗
Original paper figureSource PDF · page 5 ↗
Figure 10. Line chart showing zinc levels (Zn in ppm) for nutrient treatments (ZnSO4, FeSO4, K2SO4, Urea) at different concentrations
Line chart showing zinc levels (Zn in ppm) for nutrient treatments (ZnSO4, FeSO4, K2SO4, Urea) at different concentrations↗ Enlarge
Figure 10
Line chart showing zinc levels (Zn in ppm) for nutrient treatments (ZnSO4, FeSO4, K2SO4, Urea) at different concentrations

Line chart showing zinc levels (Zn in ppm) for nutrient treatments (ZnSO4, FeSO4, K2SO4, Urea) at different concentrations

Open full-size image ↗
Original paper figureSource PDF · page 5 ↗
Figure 11. Line chart showing iron levels (Fe in ppm) for nutrient treatments (ZnSO4, FeSO4, K2SO4, Urea) at different concentrations
Line chart showing iron levels (Fe in ppm) for nutrient treatments (ZnSO4, FeSO4, K2SO4, Urea) at different concentrations↗ Enlarge
Figure 11
Line chart showing iron levels (Fe in ppm) for nutrient treatments (ZnSO4, FeSO4, K2SO4, Urea) at different concentrations

Line chart showing iron levels (Fe in ppm) for nutrient treatments (ZnSO4, FeSO4, K2SO4, Urea) at different concentrations

Open full-size image ↗
Original paper figureSource PDF · page 5 ↗
Figure 12. Bar chart showing iron levels (Fe in ppm) for various nutrient treatments (ZnSO4, FeSO4, K2SO4, Urea) at different concentrations
Bar chart showing iron levels (Fe in ppm) for various nutrient treatments (ZnSO4, FeSO4, K2SO4, Urea) at different concentrations↗ Enlarge
Figure 12
Bar chart showing iron levels (Fe in ppm) for various nutrient treatments (ZnSO4, FeSO4, K2SO4, Urea) at different concentrations

Bar chart showing iron levels (Fe in ppm) for various nutrient treatments (ZnSO4, FeSO4, K2SO4, Urea) at different concentrations

Open full-size image ↗
Original paper figureSource PDF · page 5 ↗
Figure 13. Grouped bar chart showing N (%), P (%), K (%), Zn (ppm), and Fe (ppm) values across various nutrient treatments and
Grouped bar chart showing N (%), P (%), K (%), Zn (ppm), and Fe (ppm) values across various nutrient treatments and↗ Enlarge
Figure 13
Grouped bar chart showing N (%), P (%), K (%), Zn (ppm), and Fe (ppm) values across various nutrient treatments and

Grouped bar chart showing N (%), P (%), K (%), Zn (ppm), and Fe (ppm) values across various nutrient treatments and

Open full-size image ↗
Original paper figureSource PDF · page 6 ↗
Figure 14. Line graph comparing N (%), P (%), K (%), Zn (ppm), and Fe (ppm) values across various nutrient treatments and concentrations
Line graph comparing N (%), P (%), K (%), Zn (ppm), and Fe (ppm) values across various nutrient treatments and concentrations↗ Enlarge
Figure 14
Line graph comparing N (%), P (%), K (%), Zn (ppm), and Fe (ppm) values across various nutrient treatments and concentrations

Line graph comparing N (%), P (%), K (%), Zn (ppm), and Fe (ppm) values across various nutrient treatments and concentrations

Open full-size image ↗
Original paper figureSource PDF · page 6 ↗

References

8 in the original paper
  1. Ahmad Khan S, Waseem U, Aman UM, Rashid A, Basharat AS, Ishtiaq AR. Exogenous applications of boron and zinc influence leaf nutrient status, tree growth and fruit quality of Feutrell's Early (Citrus reticulata Blanco). Pak J Sci. 2012;49(2):113-119.
  2. Anonymous. www.hortharyana.com. 2016.
  3. Dalal RPS, Navjot, Thakur A, Brar JS. Effect of foliar application of nutrients on leaf mineral composition and yield of ber (Ziziphus mauritiana Lamk.) under arid conditions. Ann Arid Zone. 2011;50(1):53-56.
  4. Gaur B, Hada TS, Beer K, Kanth N, Syamal MM. Studies on the effect of foliar application of micronutrients and GA3 on yield and reproductive parameters of winter season guava. Trends Biosci. 2014;7(21):3386-3389.
  5. Koenig R, Johnson C. Colorimetric determination of phosphorus in biological materials. Ind Eng Chem Anal Ed. 1942;14(2):155-156.
  6. Lindner RC. Rapid analytical method for some of the more common inorganic constituents of plant tissues. Plant Physiol. 1944;19(1):76-89.
  7. Prasad H, Tomar CS, Kumari M, Sajwan P, Solanki SPS. Effect of 2,4-D, urea, zinc sulphate and combinations on growth and nutrient status of the Kinnow mandarin. Int J Chem Stud. 2017;5(1):167-170.
  8. Saxena M, Gandhi CP. Indian Horticulture Database 2014. National Horticulture Board, Ministry of Agriculture, Government of India; 2015.