
Research article · 2026 · Full text
International Journal of Advanced Chemistry ResearchGeophysical Evaluation of Hydrocarbon-Impacted Soils Using Electrical Resistivity Methods in Eleme, Rivers State, Nigeria
Volume 8(2) · Pages 06–10 · DOI: 10.33545/26646781.2026.v8.i2a.361 ↗
Research areasGeophysical and Geoelectrical MethodsGroundwater and Watershed AnalysisGroundwater flow and contamination studies
Abstract
Author-writtenThis study presents a hydrogeophysical evaluation of subsurface conditions in Eleme, Rivers State, Nigeria, using electrical resistivity sounding to characterise aquifer systems and assess possible environmental influence on near-surface soils. Vertical Electrical Sounding (VES) employing the Schlumberger electrode configuration was conducted to delineate subsurface lithology, determine aquifer geometry, and identify conductive anomalies that may reflect lithological variation or environmental alteration in this industrialised Niger Delta setting. Apparent resistivity values ranged approximately from 20 Ωm to over 600 Ωm, indicating heterogeneous subsurface conditions dominated by clay, sandy clay, fine sand, and coarse sand formations consistent with coastal plain sand deposits. Near-surface conductive zones were identified within the upper 4-6 m and are interpreted primarily as clay-rich or moisture-saturated layers, although possible environmental influence cannot be excluded without supporting hydrochemical or geochemical data. Aquifer units were delineated within moderately high resistivity sandy formations at depths between approximately 16 m and 48 m, with aquifer thickness ranging from about 24 m to 29 m. Derived Dar Zarrouk parameters indicate moderate to high groundwater potential, while longitudinal conductance values suggest weak to moderate aquifer protective capacity, implying some vulnerability to contaminant migration where overburden protection is limited. The resistivity results indicate favourable groundwater occurrence within the study area but emphasise the need for integrated hydrogeophysical, hydrochemical, and environmental investigations to ensure reliable groundwater development and environmental protection in hydrocarbon-influenced terrains of the Niger Delta.
Summary
Source-checkedPlain-language reading of the full paper, prepared with AI and checked against the text. Each point links to the authors' own words.
Why it matters
- Industrial activities related to hydrocarbon production in the Niger Delta have led to significant soil and groundwater contamination. View evidence ↗
- Eleme, Rivers State, is a major industrial hub featuring petrochemical industries and petroleum refineries. View evidence ↗
The question
- The study aims to use electrical resistivity methods in Eleme to characterize subsurface lithology, identify conductive anomalies linked to environmental impact, and assess groundwater vulnerability. View evidence ↗
What they did
- The research was conducted in the Eleme Local Government Area of Rivers State, Nigeria, located in the eastern Niger Delta sedimentary basin. View evidence ↗
- The researchers used Vertical Electrical Sounding (VES) with a Schlumberger electrode configuration to detect vertical resistivity variations. View evidence ↗
- Field data was collected using a digital terrameter, stainless steel electrodes, and a GPS receiver for spatial referencing. View evidence ↗
- Standard Dar Zarrouk relationships were used to derive hydrogeophysical parameters from the interpreted layer thickness and resistivity. View evidence ↗
What they found
- Apparent resistivity values between approximately 20 Ωm and over 600 Ωm indicate a heterogeneous subsurface composed of clay, sandy clay, fine sand, and coarse sand. View evidence ↗
- Conductive near-surface zones were identified between 0 m and 6 m depth, with thicknesses ranging from approximately 4 m to 6 m. View evidence ↗
- Aquifers were found in sandy formations at depths between approximately 16 m and 48 m, with thicknesses between about 24 m and 29 m. View evidence ↗
- Longitudinal conductance values from approximately 0.17 Siemens to 0.20 Siemens indicate that the aquifer's protective capacity is weak to moderate. View evidence ↗
- Transverse resistance values between approximately 10,080 Ωm² and 17,980 Ωm² suggest moderate to very high aquifer productivity. View evidence ↗
What it means
- The authors conclude that geophysical surveys must be combined with environmental monitoring and hydrochemical analysis to ensure sustainable groundwater use in the industrial Niger Delta. View evidence ↗
- The authors state that resistivity data alone cannot definitively confirm hydrocarbon contamination and requires complementary geochemical analysis. View evidence ↗
Visual summary
3 visualsIllustrations explain the paper; charts are replotted from the paper's own table values.
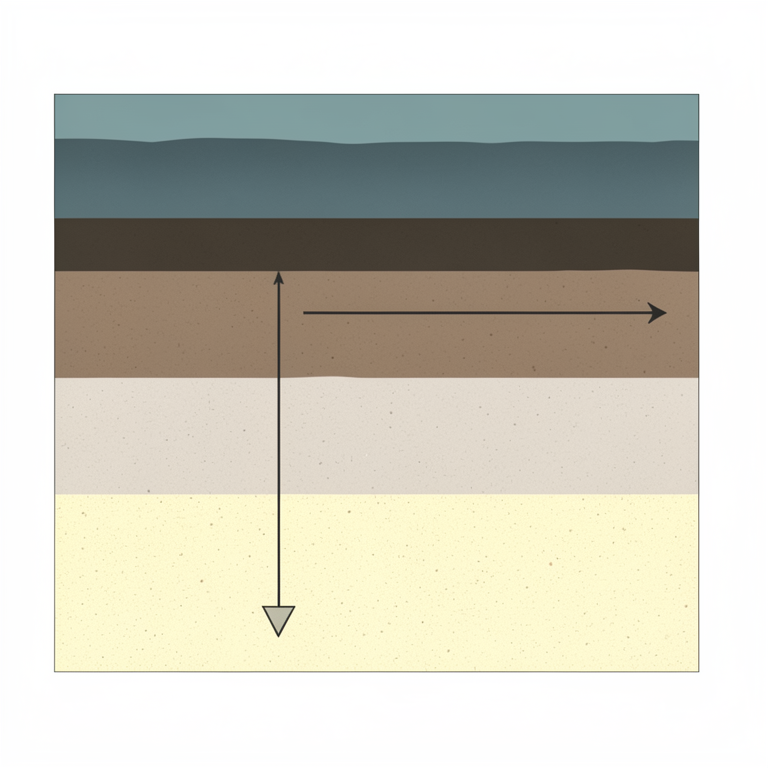
Subsurface Lithology Model
AI-generated conceptual illustration (Subsurface soil lithology in Eleme, Rivers State, Nigeria). It explains the idea and does not show study data.
View source evidence ↗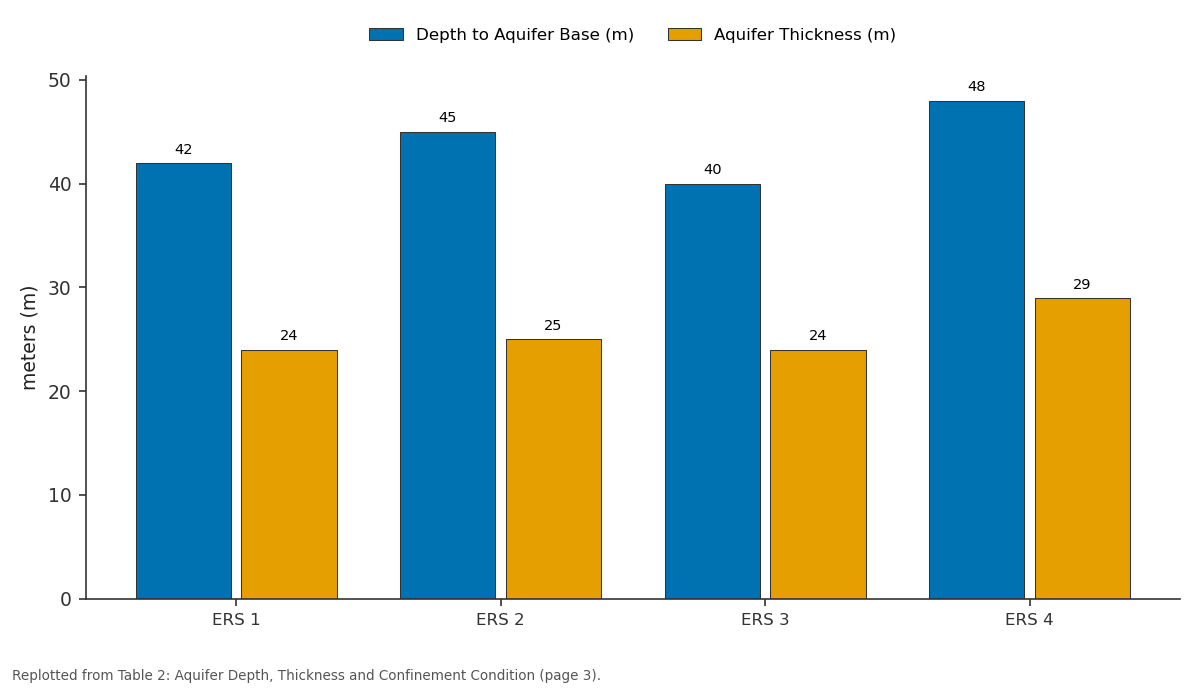
Depth to Aquifer Base (m) and Aquifer Thickness (m): ERS 1 vs ERS 2 vs ERS 3 vs ERS 4
Replotted from Table 2 (page 3) of the original paper. Every bar is the paper's own table value.
View source evidence ↗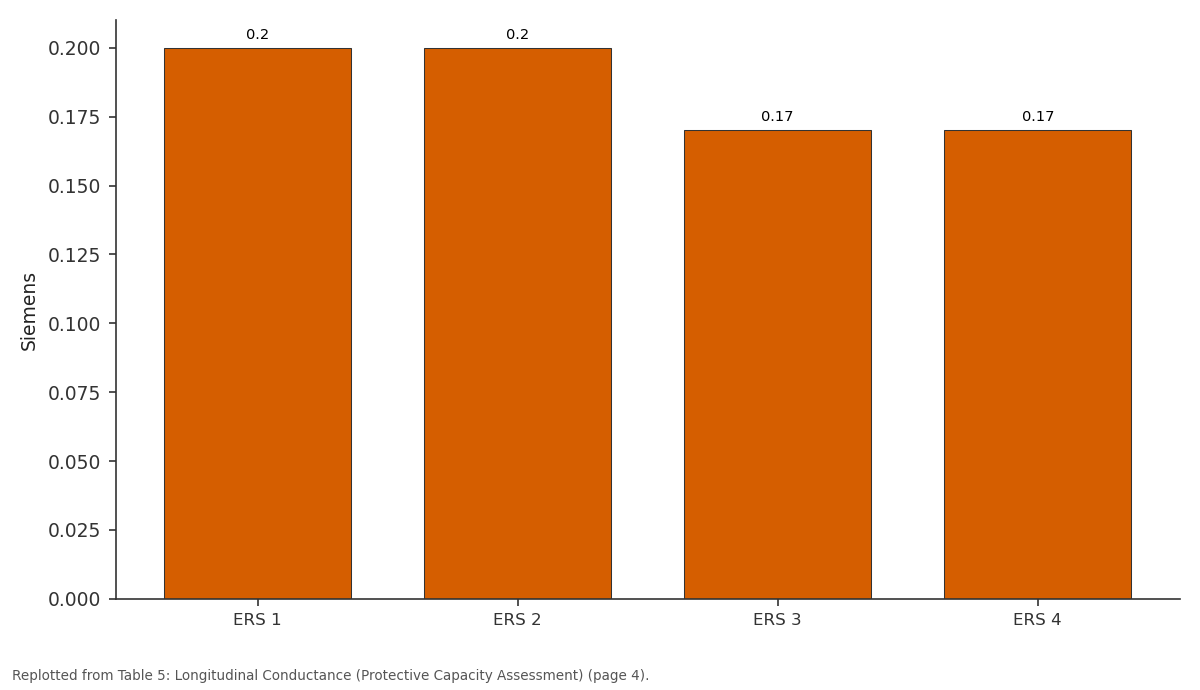
Conductance S (Siemens): ERS 1 vs ERS 2 vs ERS 3 vs ERS 4
Replotted from Table 5 (page 4) of the original paper. Every bar is the paper's own table value.
View source evidence ↗Figures & tables
From the original paper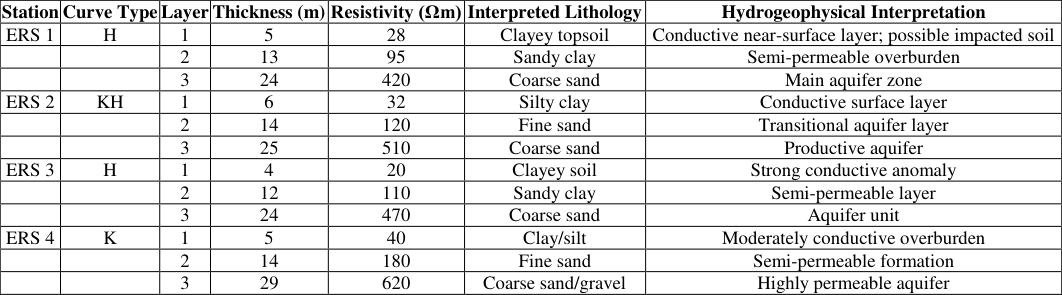 Table 1
 Table 2
 Table 3
 Table 4
 Table 5
 Table 6
 Table 7
 Table 8
Introduction
Hydrocarbon exploration, production, and associated industrial activities in the Niger Delta have contributed significantly to environmental challenges, particularly soil and groundwater contamination. Eleme, Rivers State, is one of the industrial hubs within this region, hosting petroleum refineries, petrochemical industries, and extensive oil-related infrastructure. These activities have increased concerns regarding hydrocarbon pollution, soil degradation, and potential impacts on groundwater resources and ecosystem health. Environmental assessments in the Niger Delta have consistently highlighted the presence of hydrocarbons, heavy metals, and related pollutants in soils, sediments, and surface waters due to industrial emissions, spills, and gas flaring activities (Aghanwa et al., 2025; Okpoji et al., 2025) [3,13] . Conventional environmental assessment methods, although effective, are often expensive, time-consuming, and spatially limited. Consequently, geophysical techniques have gained prominence as noninvasive tools for detecting subsurface contamination and evaluating soil and groundwater conditions. Electrical resistivity methods, in particular, have proven useful for characterising subsurface lithology, identifying conductive anomalies, and assessing environmental impacts because the electrical properties of soils are strongly influenced by fluid saturation, clay content, and contaminant presence (Dewashish et al., 2014) [6] . Variations in resistivity can therefore provide indirect indicators of hydrocarbon-impacted soils, although geophysical data typically require validation through geochemical analysis for definitive confirmation (Asfahani, 2013) [4] . In sedimentary environments such as the Niger Delta, the distribution of coastal plain sands interbedded with clay layers significantly influences contaminant migration, groundwater occurrence, and resistivity response. Clay-rich formations often act as confining or protective layers, while sandy formations may facilitate contaminant transport due to higher permeability. Geoelectric investigations have demonstrated that resistivity techniques are effective in delineating aquifer systems, evaluating groundwater vulnerability, and assessing environmental risk in such sedimentary terrains (Okiongbo & Akpofure, 2012; Ikpe et al., 2025) [12,9] . Multi-criteria approaches combining geophysical and geological parameters have further enhanced the prediction of groundwater potential and vulnerability in complex environments (Adiat et al., 2013) [2] . Environmental geochemical studies within the Niger Delta have also reported hydrocarbon accumulation in sediments, atmospheric deposition from gas flaring, and pollutant transport into surface and groundwater systems, emphasising the need for integrated monitoring strategies (Ogbaji et al., 2025; Okagbare et al., 2025) [10,11] . Such findings underscore the importance of applying geophysical methods alongside environmental assessment to understand contaminant distribution and protect water resources. This study, therefore, applies electrical resistivity methods to evaluate hydrocarbon-impacted soils in Eleme, Rivers State, with the aim of characterising subsurface lithology, identifying conductive anomalies potentially associated with environmental impact, and assessing implications for groundwater vulnerability.
Materials and Methods
Materials and Methods
Study Area and Geological Setting
The investigation was conducted in Eleme Local Government Area, Rivers State, Nigeria, within the eastern Niger Delta sedimentary basin. The area is underlain predominantly by coastal plain sands of the Benin Formation interbedded with clay and sandy clay units. These unconsolidated sediments influence groundwater occurrence, subsurface electrical properties, and contaminant migration pathways. The region is characterised by significant industrial and petroleum activities, making it environmentally sensitive with potential hydrocarbon-related soil alteration. High rainfall and shallow groundwater conditions further enhance infiltration processes, which may influence geoelectric responses.
Geophysical Method and Survey Design
The electrical resistivity method was adopted for subsurface investigation because of its effectiveness in delineating lithological boundaries, aquifer systems, and conductive anomalies. Vertical Electrical Sounding (VES) using the Schlumberger electrode configuration was employed due to its suitability for detecting vertical resistivity variations and deeper subsurface structures in sedimentary terrains. The configuration involves progressive expansion of current electrode spacing while maintaining relatively small potential electrode spacing, enabling improved depth penetration and vertical resolution.
Field Data Acquisition
Field measurements were carried out using a digital terrameter, stainless steel electrodes, insulated cables, measuring tapes, a hammer, and a Global Positioning System (GPS) receiver for spatial referencing. Current was introduced into the ground through two outer electrodes (A and B), while the potential difference was measured between two inner electrodes (M and N). Apparent resistivity values were computed automatically by the resistivity meter based on measured voltage, injected current, and electrode spacing. The apparent resistivity (ρa) is expressed as:
where ρa is the apparent resistivity, ΔV is the measured potential difference, I is the injected current, and K is the geometric factor determined by electrode spacing. For the Schlumberger array, the geometric factor is given by:
Electrode spacing was progressively increased to investigate deeper subsurface layers, and sounding stations were selected to minimise interference from buried infrastructure and cultural noise.
Data Processing and Interpretation
Apparent resistivity values were plotted against electrode spacing on log-log graphs to generate sounding curves. Preliminary interpretation involved manual curve matching with standard master curves, followed by computer-assisted inversion to determine true layer resistivity and thickness. The inversion process involved iterative adjustment of model parameters until acceptable root-mean-square error levels were achieved between observed and calculated data. Resulting geoelectric curve types, such as H, KH, and K curves, were used to infer subsurface layering typical of sedimentary environments.
Lithological and Aquifer Characterisation
Lithological interpretation was based on established resistivity ranges within the Niger Delta sedimentary terrains. Low resistivity values generally indicate clay-rich or conductive formations, moderate values correspond to sandy clay or fine sand units, while higher resistivity values are associated with coarse sand or gravel formations with higher permeability. Aquifer depth, thickness, and confinement conditions were inferred from interpreted layer parameters. Electrical anomalies observed in near-surface layers were interpreted cautiously as conductive zones potentially influenced by clay content, moisture, or environmental alteration, recognising that resistivity data alone cannot confirm hydrocarbon contamination without supporting geochemical analysis.
Dar Zarrouk Parameter Estimation
Hydrogeophysical parameters were derived from interpreted layer resistivity and thickness using standard Dar Zarrouk relationships. Longitudinal conductance (S), which reflects aquifer protective capacity, was calculated as:
S = Σ(h / ρ)
Where h is the layer thickness and ρ is the layer resistivity. Higher longitudinal conductance values indicate better protective capacity of the overburden against contaminant infiltration. Transverse resistance (T), used as an indicator of aquifer potential, was calculated as:
Higher transverse resistance values generally correspond to thicker and more resistive aquifer units with greater groundwater potential. However, these values were interpreted qualitatively and not directly equated to transmissivity without supporting hydrogeological calibration.
Quality Assurance and Error Control
To ensure data reliability, electrodes were properly grounded to minimise contact resistance, repeated measurements were taken at each station, and instrument calibration was verified prior to data acquisition. Survey locations were selected to avoid interference from pipelines, metallic structures, and electrical installations. Data inversion included monitoring of RMS error values to ensure acceptable model fit and geological plausibility.
Data Analysis and Presentation
Interpreted resistivity values, aquifer geometry, Dar Zarrouk parameters, and environmental interpretations were presented in tabular form for clarity. Comparative analysis of resistivity distribution, aquifer characteristics, protective capacity, and conductive anomalies was conducted to evaluate groundwater potential and possible environmental influence on subsurface conditions. The interpretation approach emphasised geophysical consistency while acknowledging limitations associated with resistivity-based environmental assessment.
Results
Results
Discussion
The resistivity investigation carried out in Eleme revealed considerable subsurface variability consistent with sedimentary environments typical of the Niger Delta basin. Apparent resistivity values ranging from about 20 Ωm to over 600 Ωm reflect alternating clay, sandy clay, fine sand, and coarse sand formations. Such heterogeneity is expected in coastal plain sand deposits and has been widely reported in resistivity studies of sedimentary terrains where lithological variability strongly controls groundwater occurrence and electrical response (Asfahani, 2013) [4] . Electrical resistivity tomography studies have similarly demonstrated that variations in subsurface resistivity often reflect changes in grain size distribution, fluid saturation, and mineral composition rather than a single environmental factor (Dewashish et al., 2014) [6] .
. Studies of hydrocarbon-contaminated sediments in the region have also highlighted seasonal variability and environmental transport processes that may influence subsurface geophysical signatures (Ogbaji et al., 2025) [10] . The moderate resistivity values observed in intermediate layers, typically between about 95 Ωm and 180 Ωm, were interpreted as sandy clay or fine sand formations. These transitional lithologies commonly act as semi-permeable zones capable of storing limited groundwater while also serving as partial confining layers. Multi-criteria groundwater evaluation approaches integrating geoelectric and geological parameters have shown that such transitional formations significantly influence groundwater potential and aquifer vulnerability (Adiat et al., 2013) [2] . In sedimentary terrains, the presence of sandy clay overburden often determines the degree of aquifer confinement and protective capacity. Higher resistivity values exceeding approximately 400 Ωm were interpreted as coarse sand or gravel formations representing the principal aquifer units. These formations typically exhibit higher porosity and permeability, making them favourable for groundwater storage and transmission. Resistivity-based aquifer characterisation studies have consistently demonstrated that coarse sandy formations correspond to productive aquifers due to their hydraulic conductivity and transmissivity characteristics (Adeniyi et al., 2013) [1] . Investigations of aquifer properties in southeastern Nigeria have similarly reported that resistive sandy units constitute the primary groundwater-bearing formations (Bija et al., 2018) [5] . Aquifer depths identified in this study, generally between about 16 m and 48 m, indicate moderate groundwater occurrence consistent with sedimentary basin hydrogeology. Comparable aquifer depths have been reported in groundwater vulnerability mapping studies using geoelectric methods in the Niger Delta region, where sediment thickness and depositional environment influence groundwater distribution (Okiongbo & Akpofure, 2012) [12] . The aquifer thickness values ranging from approximately 24 m to 29 m suggest adequate groundwater storage capacity and favourable conditions for borehole development. The calculated longitudinal conductance values, generally between about 0.17 Siemens and 0.20 Siemens, indicate weak to moderate aquifer protective capacity. This suggests that while clay-rich overburden exists in some locations, aquifers may still be vulnerable to contamination under sustained environmental pressure. Aquifer protection studies have emphasised the importance of overburden thickness and resistivity in determining vulnerability to contaminant infiltration, particularly in urban and industrial areas (Facazio et al., 2002) [8] . Similar resistivity-based assessments in southern Nigeria have highlighted the need for continuous groundwater monitoring in areas with moderate protective capacity (Ikpe et al., 2025) [9] . Transverse resistance values obtained in this study ranged approximately from 10,080 Ωm² to 17,980 Ωm², indicating moderate to high aquifer productivity potential. Higher transverse resistance values generally reflect thicker and more resistive aquifer units, which correlate with favourable groundwater yield potential. However, previous studies caution that transverse resistance should be interpreted qualitatively unless calibrated with hydrogeological data such as pumping tests or borehole yield measurements (Eyankware et al., 2022) [7] . Consequently, the results should be viewed as indicative rather than definitive measures of aquifer productivity. Environmental considerations remain particularly important in the Eleme area due to industrial activities and petroleum operations. Investigations of atmospheric deposition, hydrocarbon transport, and water quality in the Niger Delta have demonstrated that environmental pollutants can influence both surface and subsurface water systems (Aghanwa et al., 2025) [2] . Integrated hydrochemical and geophysical assessments have therefore been recommended for comprehensive groundwater vulnerability evaluation, especially in hydrocarbon-producing regions (Okagbare et al., 2025) [11] . The resistivity data indicate favourable hydrogeological conditions characterised by moderately deep aquifers, appreciable aquifer thickness, and relatively high resistivity sandy formations suitable for groundwater development. However, the presence of conductive surface layers and moderate aquifer protective capacity suggests potential environmental vulnerability. The results underscore the importance of combining geophysical surveys with hydrochemical analysis and environmental monitoring to ensure sustainable groundwater utilisation in industrially impacted regions of the Niger Delta.
Conclusion
The electrical resistivity investigation conducted in Eleme, Rivers State, has provided important insights into subsurface lithology, aquifer characteristics, and possible environmental influence on soil and groundwater systems. The results indicate heterogeneous subsurface conditions dominated by clay, sandy clay, fine sand, and coarse sand formations typical of the Niger Delta sedimentary basin. Apparent resistivity values ranging from about 20 Ωm to over 600 Ωm reflect variations in lithology, moisture content, and subsurface fluid characteristics. Aquifer units were identified mainly within moderately high resistivity sandy formations at depths between approximately 16 m and 48 m, with aquifer thickness generally ranging from about 24 m to 29 m. These characteristics suggest favourable groundwater storage capacity and potential suitability for borehole development. The calculated transverse resistance values indicate moderate to high aquifer productivity potential, although confirmation through hydrogeological testing would strengthen these interpretations. The presence of low-resistivity near-surface layers indicates conductive zones that may reflect clay-rich soils, high moisture content, or possible environmental alteration associated with industrial activities. However, electrical resistivity data alone cannot conclusively confirm hydrocarbon contamination without supporting geochemical evidence. Longitudinal conductance values suggest weak to moderate aquifer protective capacity, indicating some vulnerability to contamination where overburden layers are relatively thin or permeable. The study demonstrates that Eleme possesses appreciable groundwater potential within coarse sand aquifer systems, but environmental vulnerability remains an important consideration due to industrial and petroleum-related activities in the region. The findings emphasise the need for integrated hydrogeophysical and hydrochemical investigations, continuous environmental monitoring, and sustainable groundwater management practices to ensure safe and reliable water resources in the Niger Delta region.
Figures and tables from the paper
| Station | Curve Type | Layer | Thickness (m) | Resistivity (Ωm) | Interpreted Lithology | Hydrogeophysical Interpretation |
|---|---|---|---|---|---|---|
| ERS 1 | H | 1 | 5 | 28 | Clayey topsoil | Conductive near-surface layer; possible impacted soil |
| 2 | 13 | 95 | Sandy clay | Semi-permeable overburden | ||
| 3 | 24 | 420 | Coarse sand | Main aquifer zone | ||
| ERS 2 | KH | 1 | 6 | 32 | Silty clay | Conductive surface layer |
| 2 | 14 | 120 | Fine sand | Transitional aquifer layer | ||
| 3 | 25 | 510 | Coarse sand | Productive aquifer | ||
| ERS 3 | H | 1 | 4 | 20 | Clayey soil | Strong conductive anomaly |
| 2 | 12 | 110 | Sandy clay | Semi-permeable layer | ||
| 3 | 24 | 470 | Coarse sand | Aquifer unit | ||
| ERS 4 | K | 1 | 5 | 40 | Clay/silt | Moderately conductive overburden |
| 2 | 14 | 180 | Fine sand | Semi-permeable formation | ||
| 3 | 29 | 620 | Coarse sand/gravel | Highly permeable aquifer |
Table text extracted from the original PDF; superscript letters are shown inline. The original table image is below.
View original table image
| Station | Depth to Aquifer Top (m) | Depth to Aquifer Base (m) | Aquifer Thickness (m) | Confinement Basis |
|---|---|---|---|---|
| ERS 1 | 18 | 42 | 24 | Clay overburden present (semi-confined) |
| ERS 2 | 20 | 45 | 25 | Thick clay cover (confined) |
| ERS 3 | 16 | 40 | 24 | Moderate clay cover (semi-confined) |
| ERS 4 | 19 | 48 | 29 | Sandy clay cover (confined tendency) |
Table text extracted from the original PDF; superscript letters are shown inline. The original table image is below.
View original table image
| Resistivity Range (Ωm) | Likely Subsurface Condition | Interpretation Caution |
|---|---|---|
| < 50 | Clayey soil or conductive pore fluid | May indicate impacted soil, but requires geochemical validation |
| 50-150 | Sandy clay / fine sand | Transitional hydrogeological zone |
| 150-400 | Saturated sand | Possible aquifer formation |
| > 400 | Coarse sand/gravel | Highly permeable aquifer units |
Table text extracted from the original PDF; superscript letters are shown inline. The original table image is below.
View original table image
| Parameter | Observed Range | Interpretation |
|---|---|---|
| Resistivity Values | 20-620 Ωm | Variable subsurface lithology |
| Aquifer Depth | 16-48 m | Moderate groundwater occurrence |
| Aquifer Thickness | 24-29 m | Adequate groundwater storage |
| Overburden Resistivity | 20-180 Ωm | Clay to sandy clay cover |
| Groundwater Potential | Moderate-High | Suitable for borehole development |
Table text extracted from the original PDF; superscript letters are shown inline. The original table image is below.
View original table image
| Station | Overburden Thickness (m) | Average Resistivity (Ωm) | Conductance S (Siemens) | Protective Capacity |
|---|---|---|---|---|
| ERS 1 | 18 | 90 | 0.20 | Weak-moderate |
| ERS 2 | 20 | 100 | 0.20 | Moderate |
| ERS 3 | 16 | 95 | 0.17 | Weak |
| ERS 4 | 19 | 110 | 0.17 | Weak-moderate |
Table text extracted from the original PDF; superscript letters are shown inline. The original table image is below.
View original table image
| Station | Aquifer Thickness (m) | Resistivity (Ωm) | Transverse Resistance (Ωm²) | Aquifer Productivity Indicator |
|---|---|---|---|---|
| ERS 1 | 24 | 420 | 10080 | Moderate-high potential |
| ERS 2 | 25 | 510 | 12750 | High potential |
| ERS 3 | 24 | 470 | 11280 | Moderate-high potential |
| ERS 4 | 29 | 620 | 17980 | Very high potential |
Table text extracted from the original PDF; superscript letters are shown inline. The original table image is below.
View original table image
| Station | Depth of Conductive Zone (m) | Thickness (m) | Interpretation |
|---|---|---|---|
| ERS 1 | 0-5 | 5 | Surface conductive anomaly |
| ERS 2 | 0-6 | 6 | Possible impacted soil layer |
| ERS 3 | 0-4 | 4 | Strong conductive anomaly |
| ERS 4 | 0-5 | 5 | Conductive overburden |
Table text extracted from the original PDF; superscript letters are shown inline. The original table image is below.
View original table image
| Factor | Observation | Implication |
|---|---|---|
| Surface Layer | Low resistivity conductive zones | Possible soil alteration; confirmation requires geochemical analysis |
| Aquifer Units | Moderate to high resistivity sands | Potential groundwater resources |
| Protective Capacity | Weak to moderate | Some vulnerability to contamination |
| Groundwater Suitability | Generally favourable | Further hydrochemical validation is recommended |
Table text extracted from the original PDF; superscript letters are shown inline. The original table image is below.
View original table image
References
13 in the original paper- Adeniyi AA, Olayinka AI, Oladunjoye MA. Electrical resistivity imaging for groundwater exploration in basement complex terrain of southwestern Nigeria. J Afr Earth Sci. 2013;87:45-54.
- Adiat KAN, Nawawi MNM, Abdullah K. Assessing the accuracy of electrical resistivity imaging for groundwater exploration. Environ Earth Sci. 2013;69(8):1-12.
- Aghanwa CI, Umueni UE, Etukudo NJ, Amachree JB, Okpoji AU, Ejeka CJ, et al. Atmospheric deposition of soot and heavy metals from gas flaring into surface waters of Ebocha, Rivers State, Nigeria. Asian J Environ Ecol. 2025;24(11):137-147.
- Asfahani J. Geoelectrical investigation for groundwater exploration using vertical electrical sounding technique. Near Surf Geophys. 2013;11(2):1-10.
- Bija S, Kumar R, Verma S. Application of electrical resistivity method in environmental and engineering investigations. J Appl Geophys. 2018;150:123-132.
- Dewashish K, Singh R, Gupta S. Application of electrical resistivity tomography in hydrocarbon contaminated soil investigation. Environ Monit Assess. 2014;186:1121-1132.
- Eyankware MO, Ogwah C, Okeke HC. Electrical resistivity investigation for groundwater potential evaluation in sedimentary basins of southeastern Nigeria. Environ Earth Sci. 2022;81:1-15.
- Facazio MJ, Kauffman LJ, Baehr AL. Electrical resistivity investigation of hydrocarbon-contaminated sites. J Environ Eng Geophys. 2002;7(2):1-10.
- Ikpe EO, Okpoji AU, Ekwere IO. Hydrogeophysical characterisation of aquifer systems in the Niger Delta region using electrical resistivity techniques. J Afr Geosci. 2025;18(2):45-56.
- Ogbaji HO, Akpan NA, Ijioma CC, Okpoji AU, Eze VC, Obi JN, et al. Seasonal variation in hydrocarbon contamination of sediments and biota in Bonny Estuary, Rivers State, Nigeria. Asian J Geogr Res. 2025;8(4):330338. DOI:10.9734/ajgr/2025/v8i4341
- Okagbare UV, Umueni UE, Ekpe JE, Etukudo NJ, Okpoji AU, Okoye PI, et al. Geophysical and hydrochemical assessment of groundwater vulnerability to oil pollution in Yenagoa, Bayelsa State, Nigeria. J Environ Clim Ecol. 2025;2(2):138-146.
- Okiongbo KS, Akpofure E. Electrical resistivity investigation of groundwater potential in the Niger Delta region. Int. J Geosci. 2012;3:1-10.
- Okpoji AU, Ekwere IO, Igwegbe KC, Anarado CJO, Ogbonna C, Ewuola AA, et al. Volatile organic compounds from gas flaring and their atmospheric implications in the Niger Delta. J Life Sci Public Health. 2025;1(1):32-39. DOI:10.69739/jlsph.v1i1.962