
Research article · 2026 · Full text
International Journal of Geography Geology and EnvironmentSpatio-temporal LULC analysis of Patiala city using remote sensing and GIS
Volume 8(2) · Pages 117–122 · DOI: 10.22271/27067483.2026.v8.i2a.482 ↗
Research areasLand Use and Ecosystem ServicesRemote Sensing in AgricultureRemote-Sensing Image Classification
Abstract
Author-writtenUrbanization is a common phenomenon observed throughout the world with developing countries facing most of the brunt of its pitfalls. Land use Land cover (LULC) landscapes are being transformed in favour of builtup areas at the expense of green spaces and agriculture. LULC analysis of Patiala city has been performed in this research leveraging latest remote sensing and GIS capabilities, as well as machine learning methodologies such as random forest classifier. LULC analysis was done for the years of 2005 and 2022, using Landsat 5 Thematic Mapper (TM) and Landsat 8 Operational Land Image/Thermal Infrared Sensor (OLI/TIRS) for the year 2005 and 2022, respectively. Five LULC classes were identified: builtup, waterbody, vegetation, agriculture, and Barrenland. Overall accuracy and kappa coefficient metrics were calculated to establish the correctness of LULC classification. Overall accuracy was 0.88 and 0.89 for 2005 and 2022, respectively. Kappa Coefficient values stood at 0.93 and 0.84 for 2005 and 2022, respectively. LULC analysis reveal that there is a dominance of one LULC class that is agriculture in both years, however, in 2022 agricultural area declined in favour of builup, and vegetation took a significant in terms of areal extent, with more than fifty percent reduction in its area in 2022 as compared to 2005. Our research calls for optimum utilization of space, planned urbanization and minimum negative change in vegetated and agricultural areas.
Summary
Source-checkedPlain-language reading of the full paper, prepared with AI and checked against the text. Each point links to the authors' own words.
Why it matters
- Global urbanization often leads to the transformation of land use and land cover (LULC), where built-up areas expand while agricultural and green spaces decrease, particularly in developing countries. View evidence ↗
- In developing countries, unplanned urban growth often results in critical infrastructure deficits, including poor sewage, lack of clean drinking water, and various forms of pollution. View evidence ↗
- Monitoring land use and land cover is considered essential for the socio-economic development of a region. View evidence ↗
The question
- The study aims to analyze the changes in land use and land cover (LULC) within Patiala city between the years 2005 and 2022. View evidence ↗
What they did
- The study area is the Patiala Local Planning Area (LPA), which covers approximately 502 square kilometres. View evidence ↗
- The researchers used Landsat 5 Thematic Mapper (TM) data for 2005 and Landsat 8 Operational Land Imager/Thermal Infrared Sensor (OLI/TIRS) data for 2022. View evidence ↗
- The analysis categorized the land into five distinct classes: built-up, waterbody, vegetation, agriculture, and barren land. View evidence ↗
- A Random Forest Classifier, a machine learning technique, was employed to perform the LULC classification. View evidence ↗
- The study utilized remote sensing, Geographic Information Systems (GIS), and the Google Earth Engine (GEE) cloud-based platform for data processing. View evidence ↗
What they found
- The LULC classification showed high reliability, with overall accuracy of 0.88 in 2005 and 0.89 in 2022, and kappa coefficients of 0.93 and 0.84, respectively. View evidence ↗
What it means
- The authors conclude that Patiala has experienced a gradual shift from agricultural land to built-up areas, with a particularly severe loss of vegetation. View evidence ↗
- The authors recommend implementing planned urban growth to accommodate future expansion while minimizing the loss of agricultural and vegetated areas. View evidence ↗
Figures & tables
From the original paper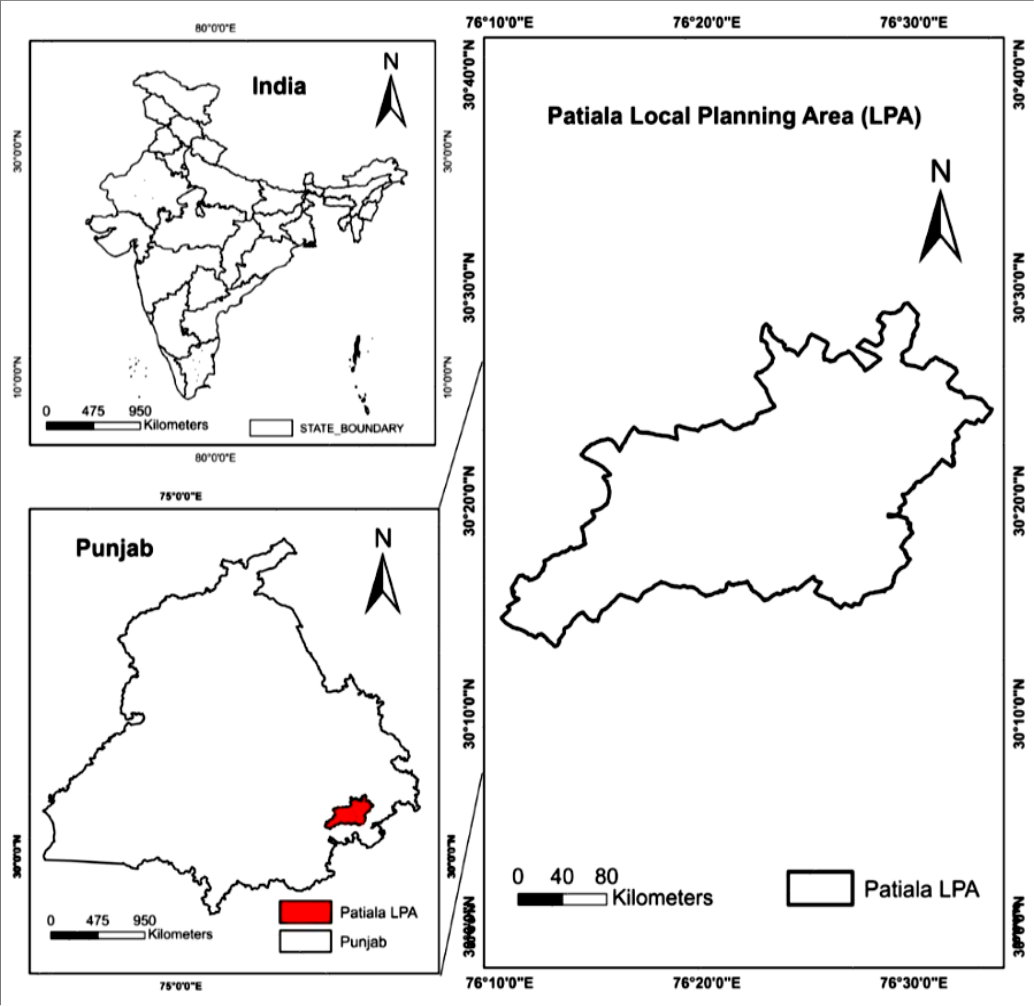 Figure 1
 Table 1
 Table 2
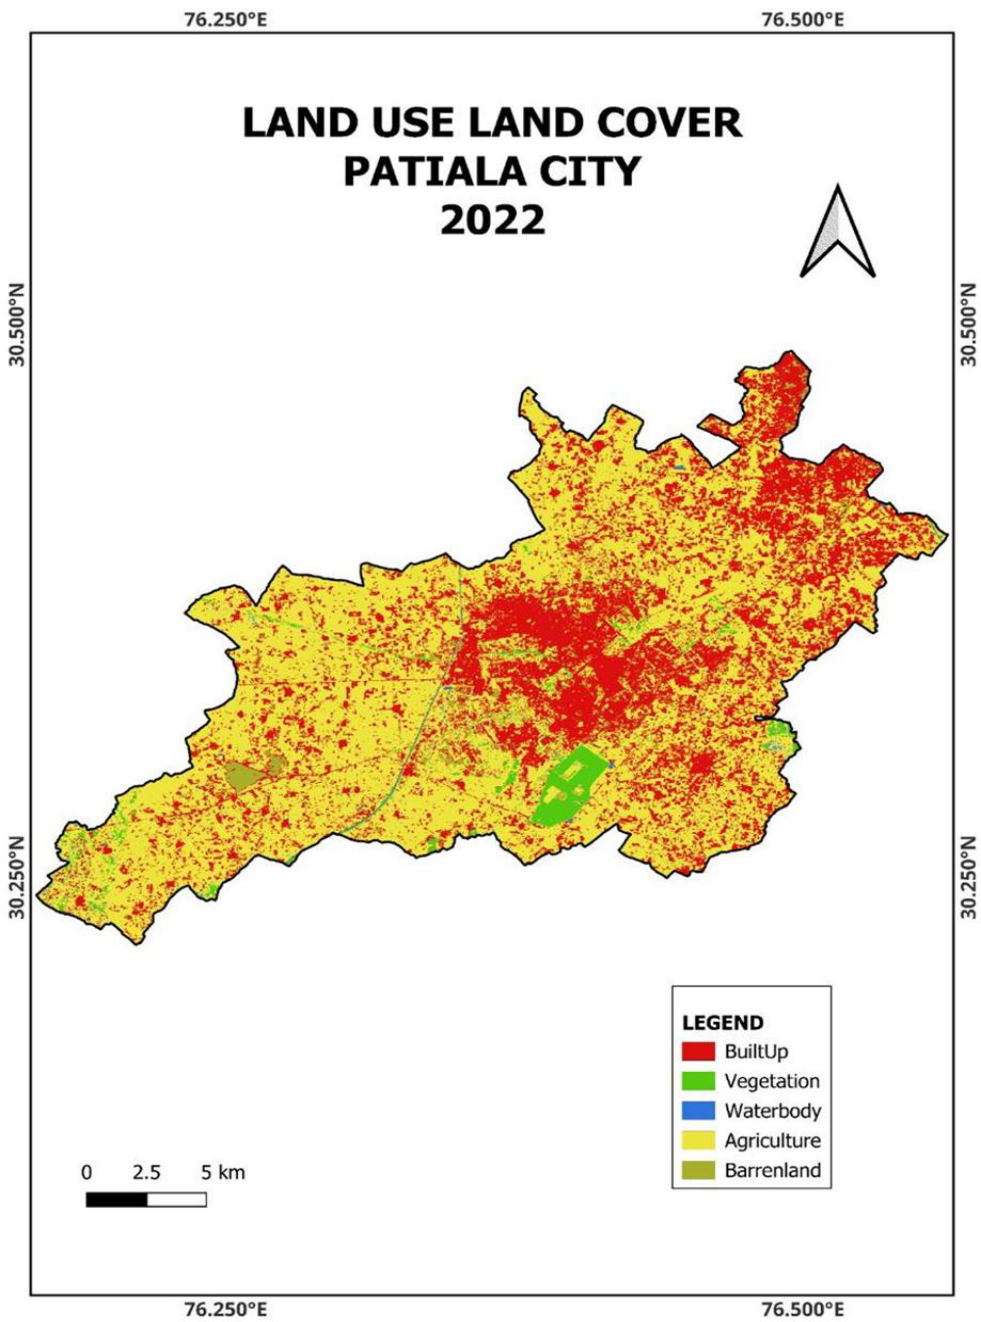 Figure 2
Introduction
The whole world is undergoing the process of urbanization, with more than half of the world population living in urban areas (Gaur and Singh, 2023) [1] . With the process of urbanization comes the changes in the Land use Land Cover (LULC) of a city, changes happening in favour of built-up at the expense of vegetation. LULC is a widely recognized global environmental aspect crucial for the socio-economic development of a region (Chen, 2002; Attri et al., 2015) [2,3] . The process of urbanization and transformation of LULC has not always been smooth particularly in the developing countries where many infrastructural issues persist such as unplanned growth of cities, lack of necessities such as sewage, clean drinking water, pollution of various kinds such as air, water, and noise. That is why it becomes ever more important to quantitatively and qualitatively monitor the changes in the city's environment. However, this analysis has been made easier by the availability of satellite imageries, from which many studies around the world conduct the LULC changes of any kind of environment such as natural and anthropogenic (Chen, 2002; Attri et al., 2015; Kaur and Singh, 2025) [2,3,4] . Many methodologies exist for LULC analysis such as maximum likelihood, random forest classifier, support vector machine and so on, it depends on one's expertise and the size of the study area to choose the appropriate methodology. Random Forest classifier has been a consistent performer in the LULC analysis for various studies around the globe (Kaur and Singh, 2025; Amini et al., 2022; Junaid et al., 2023) [4,5,6] . These techniques traditionally have been applied in Geographic Information Systems (GIS), but nowadays, cloud computing platforms such as Google Earth Engine (GEE) have widened the scope of analysis with their ability to process large scale datasets (Gorelick et al., 2017) [7] . In terms of urbanization, Patiala city is no different from other north Indian cities, with rapid urbanization happening because of its proximity to the national capital and other prominent cities in Punjab such as Ludhiana, Amritsar, S.A.S Nagar, and Bathinda. The present study provides an analysis of LULC changes that have happened in the city from 2005 to 2022.
Study Area
Patiala city is situated in the south-eastern region of the state of Punjab. To better manage the increasing urbanisation in the district, the government of Punjab created the Local Planning Area (LPA) in the year of 2008. Patiala LPA has an area of 502 square kilometres approximately (GoP, 2011) [8] . It ranges from 32° 12' N to 30° 27' N latitude and 76° 11' E to 76° 32' E longitude. It is an important socioeconomic and cultural hub of the state, with famous religious shrines such as Kali Mata Mandir and Gurudwara Shri Dukhniwaran Sahib. The city was initially founded by Baba Ala Singh around the late eighteenth century. The city is situated 250 kilometres from the country's capital New Delhi. It is connected to important cities of Punjab such as Ludhiana, Jalandhar, Amritsar, Bathinda, Chandigarh, and S.A.S Mohali. The city has a population of 485497, according to census 2011. Figure 1 depicts the study area map.
Materials and Methods
The dataset for this research involves utilizing remote sensing and GIS along with Google Earth Engine (GEE). GEE is a powerful cloud-based computing platform which allows advanced geoprocessing of data (Gorelick et al., 2017) [7] . LULC maps have been prepared for the years 2005 and 2022. For that purpose, Landsat 5 Thematic Mapper (TM) and Landsat 8 Operational Land Imager/Thermal Infrared Sensor (OLI/TIRS) were used for the years 2005 and 2022, respectively. QGIS 3.36 helped in map making. LULC analysis was performed using a machine learning technique called Random Forest Classifier, which has proven to be quite effective in LULC studies (Rwanga and Ndambuki, 2017) [9] . Overall accuracy and kappa coefficient were also calculated to verify the robustness of our LULC classification.
Results and Discussion
Five LULC classes have been analysed; these are (i) Builtup (ii) Vegetation (iii) Waterbody (iv) Agriculture (v) Barrenland. Based on our LULC analysis from 2005 to 2022, some major conclusions have been made. These are the fact that urbanization has increased exponentially during this time. Built-up increased by 70.33 square kilometres, from 92.03 square kilometres in 2005 to 162.36 square kilometres, with significant urbanization happening around National Highway 7, in areas alongside Punjabi University, Patiala, Urban Estate Phase 1 and Phase 2. Many private colonies have popped up alongside State Highway 8 that is the Patiala-Sirhind Road. Much of the development has been unregulated in nature, with private dealers holding for acquisition and transfer of properties, in many of these areas even necessities are not available for the residents of these colonies such as government drinking water services, sewage treatment, pakka roads and so on. The change in built-up areas is 76.42%. Vegetation has taken a significant toll in terms of quantity; in 2005 it was 28.52 square kilometres and in 2022 it stands at 13.68 square kilometres. The percentage decline in vegetation stands at 52.03. Bir Moti Bagh is the only visible big patch of vegetation seen in the entire study area, whereas other patches of vegetation are quite segregated and scarce. Waterbodies are seasonal in the city, Badi nadi or nala is the seasonal stream, which has the highest amounts of water present only during the monsoon seasons, the flow of water depends on the overall rainfall, therefore, the statistics related to water may vary depending on the rainfall received and other factors such as surface runoff and climatic dynamics. During the time of analysis, that is from 2005 to 2022, a trend has been observed in the study region that is the overall dominance of agriculture. In 2005, it stood at a whopping 368.71 square kilometres and in 2022 it stood at 314.29 square kilometres, even though in these seventeen years, the area under agriculture has gone down by 14 percentage points, it still constitutes approximately two-thirds of the study area, which makes it a dominating category. Another LULC category that is minor but still relevant for our analysis is barren land, in 2005 barren land category stood at 4.45 square kilometres and in 2022 it was 8.46 square kilometres. Increase in barren land can be attributed to decrease in vegetation and change in other associated LULC classes.
Accuracy Assessment and Kappa Coefficient
For LULC analysis, accuracy assessment and kappa coefficient have been considered essential for better land use planning (Rwanga and Ndambuki, 2017) [9] . Kappa coefficient is the probability of samples predicted correctly from satellite imageries and ground samples. Table 2 provides the statistics of accuracy assessment and kappa coefficient.
| Year | Overall Accuracy | Kappa Coefficient |
|---|---|---|
| 2005 | 0.88 | 0.93 |
| 2022 | 0.89 | 0.84 |
Table text extracted from the original PDF; superscript letters are shown inline. The original table image is below.
View original table image
Conclusion
The study area has undergone a gradual transformation of its LULC environment from agriculture to built-up, although agriculture still dominates its landscape, but vegetation has taken a significant toll, in terms of its area. This analysis necessitates the proper space efficient utilization of LULC landscape of city, provisioning of proper planned growth should be the need of the hour to accommodate future city expansion. Development of new areas should be done diligently with minimum loss to agricultural and vegetated areas of the city.
Figures and tables from the paper
| Property | 2005 | 2022 | Change In Area (Sq. Kms) | Change In Area (Percentage) |
|---|---|---|---|---|
| Builtup | 92.03 | 162.36 | 70.33 | 76.42 |
| Vegetation | 28.52 | 13.68 | -14.84 | 52.03 |
| Waterbody | 7.85 | 2.77 | -5.08 | 64.71 |
| Agriculture | 368.71 | 314.29 | -54.42 | 14.75 |
| Barrenland | 4.45 | 8.46 | 4.01 | 90.11 |
| Total | 501.55 | 501.55 |
Table text extracted from the original PDF; superscript letters are shown inline. The original table image is below.
View original table image
References
9 in the original paper- Gaur S, Singh RA. Comprehensive review on land use/land cover (LULC) change modeling for urban development: current status and future prospects. Sustainability. 2023;15(2):903. doi:10.3390/su15020903
- Chen X. Using remote sensing and GIS to analyze land cover change and its impacts on regional sustainable development. International Journal of Remote Sensing. 2002;23(1):107-124.
- Attri P, Chaudhry S, Sharma S. Remote sensing & GIS based approaches for LULC change detection-a review. International Journal of Current Engineering and Technology. 2015;5(5):3126-3137.
- Kaur A, Singh J. Land-use land-cover dynamics of Hari-Ke-Pattan wetland using machine learning algorithm, remote sensing and GIS techniques in Google Earth Engine. Environment Conservation Journal. 2025;26(2):522-528.
- Amini S, Saber M, Rabiei-Dastjerdi H, Homayouni S. Urban land use and land cover change analysis using random forest classification of Landsat time series. Remote Sensing. 2022;14(11):2654. doi:10.3390/rs14112654
- Junaid M, Sun J, Iqbal A, Sohail M, Zafar S, Khan A. Mapping LULC dynamics and its potential implication on forest cover in Malam Jabba region with Landsat time series imagery and random forest classification. Sustainability. 2023;15(3):1858.
- Gorelick N, Hancher M, Dixon M, Ilyushchenko S, Thau D, Moore R. Google Earth Engine: planetaryscale geospatial analysis for everyone. Remote Sensing of Environment. 2017;202:18-27.
- Government of Punjab (GoP). Master plan L.P.A. Patiala. Department of Town and Country Planning, Government of Punjab; 2011.
- Rwanga SS, Ndambuki JM. Accuracy assessment of land use/land cover classification using remote sensing and GIS. International Journal of Geosciences. 2017;8(4):611-622.