
Research article · 2025 · Full text
International Journal of Agriculture and NutritionEffect of different sources of organic manures on phosphorus availability in vertisol
Volume 7(9) · Pages 90–92 · DOI: 10.33545/26646064.2025.v7.i9b.290 ↗
Research areasSoil Carbon and Nitrogen DynamicsAgricultural Science and FertilizationSoil and Water Nutrient Dynamics
Abstract
Author-writtenAn incubation study was conducted during 2024-2025 with six treatments viz., Absolute control, GRDF (50:75:45 N: P2O5:K2O Kg ha-1 + FYM 10 t ha -1), RD NK+100% RD- P2O5 + PMC 2.0 t ha -1, RD NK+75% RD- P2O5 + PMC 4.0 t ha -1, RD NK +100% RD- P2O5 + PROM 0.5 t ha -1 and RD NK + 75% RD- P2O5 + PROM 1.0 t ha -1 and four replications to study the periodical release of phosphorus at 15 days interval up to 90 days. The result revealed that the application of RD NK+75% RD- P2O5 + PROM 1.0 t ha-1 recorded significantly higher available phosphorus (17.77, 20.03, 25.26, 28.91, 30.12 and 30.51 mg kg-1) over rest of treatments during incubation at 15, 30, 45, 60, 75 and 90 days of incubation, respectively. The organic carbon and soil available potassium was significantly higher (0.54% and 416.20 kg ha-1, respectively) with application of GRDF -50:75:45 N: P2O5:K2O kg ha-1 + FYM 10 t ha -1 at 90 days of incubation period. The soil available phosphorus shows highly significant and positive correlation with OC, available N and K, however it shows a significant negative correlation with CaCO3.
Summary
Source-checkedPlain-language reading of the full paper, prepared with AI and checked against the text. Each point links to the authors' own words.
Why it matters
- Phosphorus is a critical macronutrient for plant growth, ranking second in importance after nitrogen. View evidence ↗
- A significant portion of chemical phosphorus fertilizer is fixed in the soil, with only 15-20% being utilized by crops. View evidence ↗
- Vertisols are characterized by alkaline pH, calcium dominance, high water-holding capacity, and clay content exceeding 30%. View evidence ↗
The question
- The study aims to identify solutions that improve the solubility, recovery, and overall efficiency of phosphorus fertilizers in the soil. View evidence ↗
What they did
- The researchers used a CRD design with four replications and six treatments, including an absolute control, GRDF (FYM), and various combinations of RD NK with PMC or PROM. View evidence ↗
- Available phosphorus was measured at 15-day intervals over a total incubation period of 90 days. View evidence ↗
- Following the incubation, the soil was analyzed for chemical properties including pH, electrical conductivity (EC), organic carbon (OC), calcium carbonate (CaCO3), and available N, P, and K. View evidence ↗
What they found
- The treatment RD NK+75% RD- P2O5 + PROM 1.0 t ha-1 resulted in the highest available phosphorus, increasing from 17.77 mg kg-1 at 15 days to 30.51 mg kg-1 at 90 days. View evidence ↗
- The highest rate of phosphorus release occurred between 30 and 45 days of incubation, particularly in the RD NK+75% RD- P2O5 + PROM 1.0 t ha-1 treatment. View evidence ↗
- At 90 days, the GRDF treatment produced significantly higher organic carbon (0.54%) and available potassium (416.20 kg ha-1). View evidence ↗
- The RD NK+75% RD- P2O5 + PMC 4.0 t ha-1 treatment resulted in significantly higher available nitrogen (257.50 kg ha-1) at 90 days compared to the control. View evidence ↗
- Available phosphorus at 90 days was positively correlated with organic carbon, available N, and K, but negatively correlated with calcium carbonate. View evidence ↗
What it means
- The authors conclude that RD NK+75% RD- P2O5 + PROM 1.0 t ha-1 is the superior treatment for improving phosphorus availability and general soil fertility in Vertisols. View evidence ↗
Visual summary
2 visualsIllustrations explain the paper; charts are replotted from the paper's own table values.
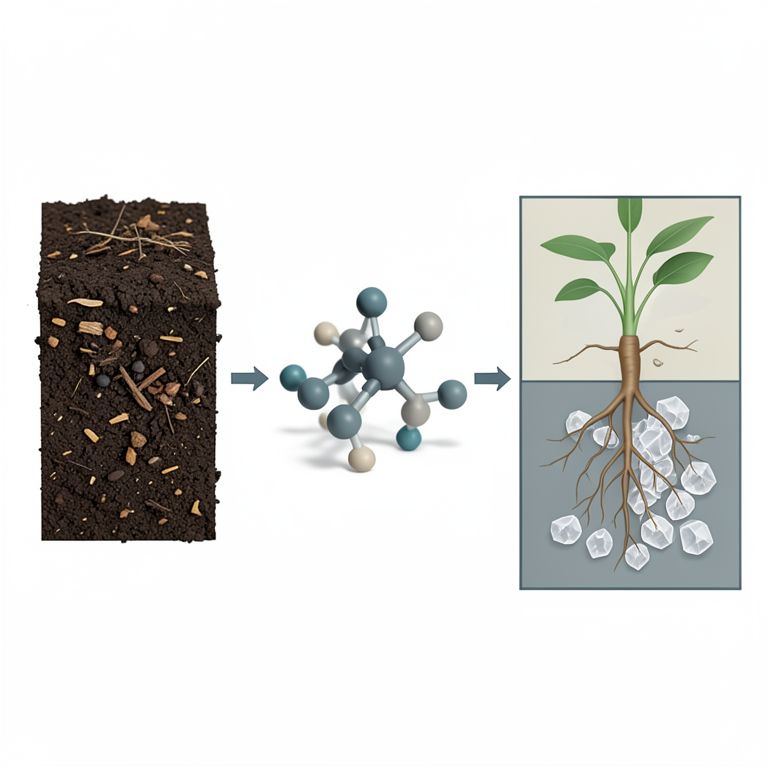
Phosphorus Correlation Map
AI-generated conceptual illustration (Vertisol soil profile with organic manure amendments). It explains the idea and does not show study data.
View source evidence ↗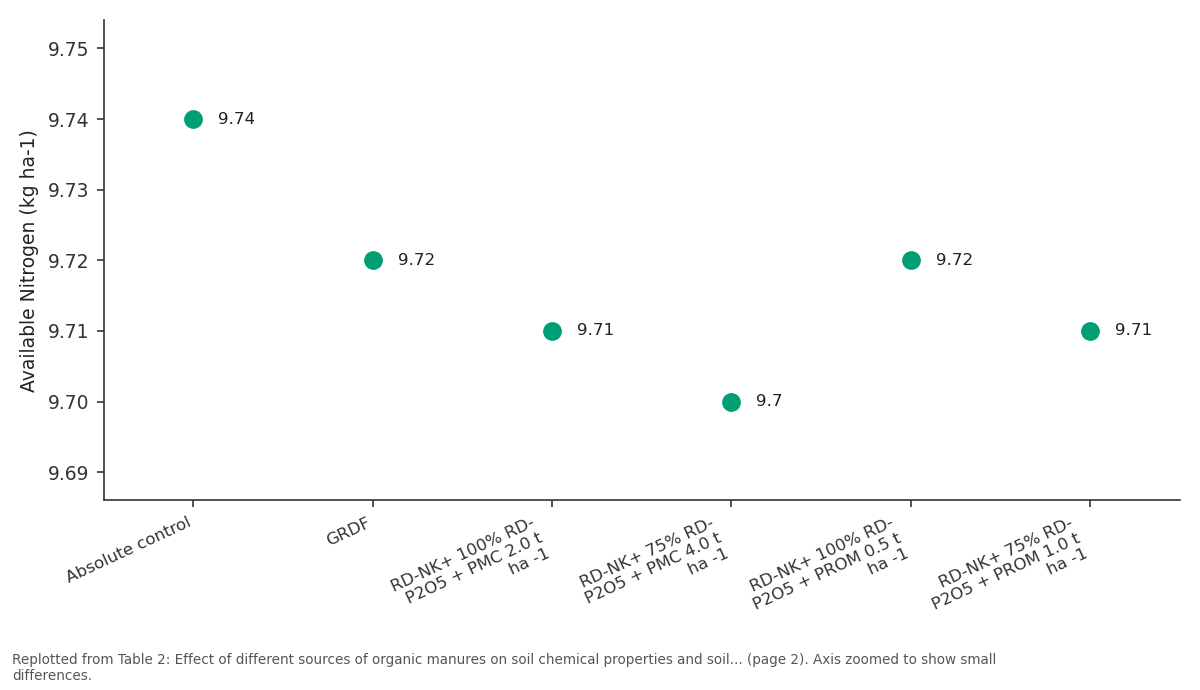
CaCO3 (%): Absolute control vs GRDF vs RD-NK+ 100% RD- P2O5 +... vs RD-NK+ 75% RD- P2O5 +... vs RD-NK+ 100% RD- P2O5 +...
Replotted from Table 2 (page 2) of the original paper. Every bar is the paper's own table value.
View source evidence ↗Figures & tables
From the original paper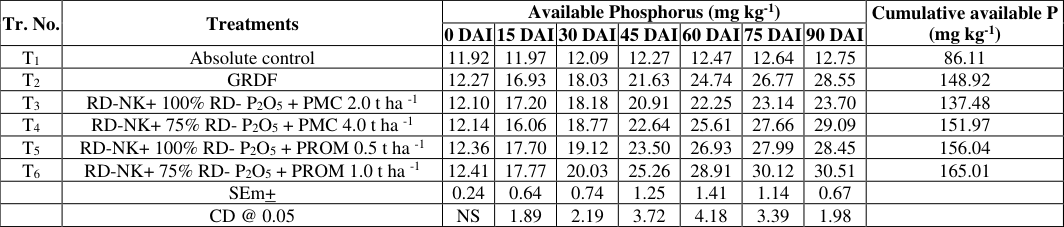 Table 1
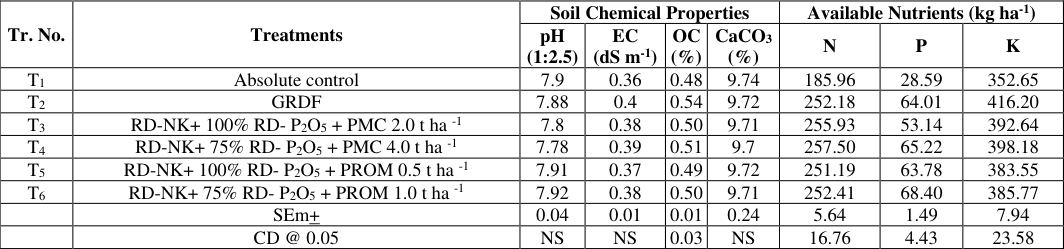 Table 2
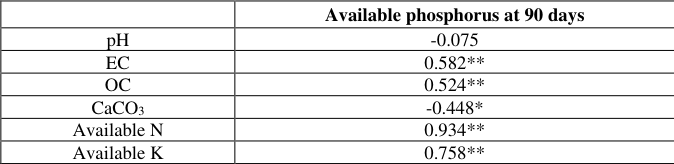 Table 3
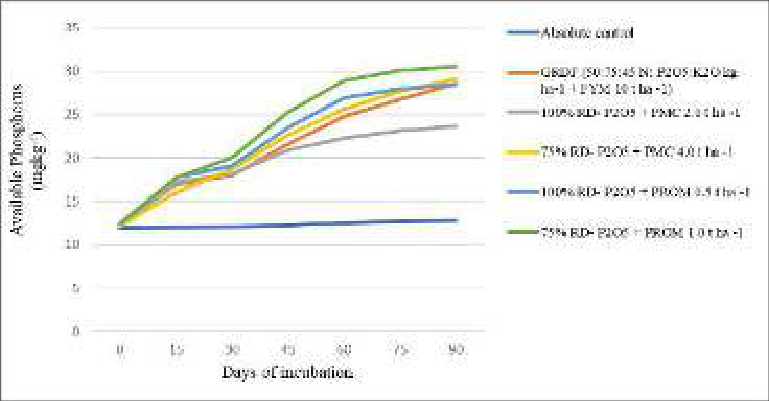 Figure 1
Introduction
Phosphorus (P) is the second most important macronutrient, essential for plant growth, next to nitrogen. It plays a crucial role in driving biochemical processes in plants as a component of adenosine triphosphate (ATP), which is the energy currency for these processes. Phosphorus is added in soil through application of chemical fertilizers but a major part of it gets fixed in the soil, while 15-20% is utilized by the crop (Wani, 1980) [5]. The main issues related to phosphorus in soil are its low mobility, the limited availability of phosphorus to plants, and fixation.
Motsara (2001) [3] noted that 49.3% of Indian soils exhibit low phosphorus levels. Vertisols have a high clay content (more than 30%), high water-holding capacity, alkaline in pH and dominated by calcium. The recovery of both applied and native phosphorus is quite low, and the rising cost of chemical phosphatic fertilizers is becoming a significant concern for farmers. There is need to identify effective solutions that can enhance the efficiency of P fertilizer use while also improving the recovery and solubility of applied P fertilizers in the soil.
Soil organic amendments can increase the availability of phosphorus in several ways. Soils that are rich in organic matter are expected to have a higher availability of phosphorus due to increased biological activity. Organic manures release substances that improve the solubilization and retention of phosphorus in soil. Organic manures, such as FYM, PMC and PROM, demonstrate a slow and sustained release of phosphorus during incubation.
Materials And Methods
An incubation study was conducted at the Division of Soil Science, RCSM College of Agriculture, Kolhapur during 2024-2025. The bulk soil sample from 0-15 cm belonging to the Vertisol was collected from the research farm, RCSM College of Agriculture, Kolhapur. The soil sample was collected, air-dried, grounded with a wooden mortar and pestle, and then sieved through 2.0 mm sieve. The experiment was laid out in CRD design with six treatments viz., Absolute control, GRDF (50:75:45 N: P2O5:K2O Kg ha-1 + FYM 10 t ha -1), RD NK+100% RD- P2O5 + PMC 2.0 t ha -1, RD NK+75% RD- P2O5 + PMC 4.0 t ha -1, RD https://www.agriculturejournal.net NK +100% RD- P2O5 + PROM 0.5 t ha -1 and RD NK + 75% RD- P2O5 + PROM 1.0 t ha -1 and four replications.
The experimental soil was alkaline in reaction, medium in available nitrogen, moderately high in phosphorus and very high in potassium. The incubation study was conducted by discard method for 90 days. The soil samples were analysed for available phosphorus at 0,15, 30, 45, 60, 75 and 90 days after incubation (DAI). After completion of incubation the soil samples were analysed for soil chemical properties viz. pH, EC, OC, CaCO3, available N, P and K.
Result And Discussion
P availability during incubation The result revealed that the available phosphorus increased with incubation period, and it was maximum at 90 days of incubation (Table.1 and Fig.1). Application of RD NK+75% RD- P2O5 + PROM 1.0 t ha-1 recorded significantly highest available phosphorus (17.77, 20.03, 25.26, 28.91, 30.12 and 30.51 mg kg-1) over rest of treatments during incubation at 15, 30, 45, 60, 75 and 90 days of incubation, respectively. The available phosphorus release rate was maximum at 30 to 45 days of incubation and the treatment RD NK+75% RD- P2O5 + PROM 1.0 t ha-1 recorded the higher release rate as compared to rest of the treatments. Similar results were obtained by Bagade et al., (2025) [1], Walpola et al., (2020) [4].
Soil chemical properties The soil pH, EC and CaCO3 were did not differ significantly with application of different sources of organic manures. The treatment GRDF recorded significantly higher organic carbon and soil available potassium (0.54% and 416.20 kg ha-1, respectively) at 90 days of incubation, however the soil available nitrogen (257.50 kg ha-1) at 90 days of incubation was significantly higher with application of RD NK+75% RD- P2O5 + PMC 4.0 t ha-1 over control treatment (Table 2). These results are in conformity with Kumari et al., (2024) [2]. Correlation between available phosphorus and soil properties The soil available phosphorus at 90 days of incubation showed highly significant and positive correlation with soil organic carbon, available N, and K; however, it shows significant and negative correlation with calcium carbonate content in soil (Table 3).
| — | Available phosphorus at 90 days |
|---|---|
| pH | -0.075 |
| EC | 0.582** |
| OC | 0.524** |
| CaCO3 | -0.448* |
| Available N | 0.934** |
| Available K | 0.758** |
Table text extracted from the original PDF; superscript letters are shown inline. The original table image is below.
View original table image
| Tr. No. | Treatments | Soil Chemical Properties | — | — | — | Available Nutrients (kg ha-1) | — | — |
|---|---|---|---|---|---|---|---|---|
| pH (1:2.5) | EC (dS m-1) | OC (%) | CaCO3 (%) | N | P | K | ||
| T1 | Absolute control | 7.9 | 0.36 | 0.48 | 9.74 | 185.96 | 28.59 | 352.65 |
| T2 | GRDF | 7.88 | 0.4 | 0.54 | 9.72 | 252.18 | 64.01 | 416.20 |
| T3 | RD-NK+ 100% RD- P2O5 + PMC 2.0 t ha -1 | 7.8 | 0.38 | 0.50 | 9.71 | 255.93 | 53.14 | 392.64 |
| T4 | RD-NK+ 75% RD- P2O5 + PMC 4.0 t ha -1 | 7.78 | 0.39 | 0.51 | 9.7 | 257.50 | 65.22 | 398.18 |
| T5 | RD-NK+ 100% RD- P2O5 + PROM 0.5 t ha -1 | 7.91 | 0.37 | 0.49 | 9.72 | 251.19 | 63.78 | 383.55 |
| T6 | RD-NK+ 75% RD- P2O5 + PROM 1.0 t ha -1 | 7.92 | 0.38 | 0.50 | 9.71 | 252.41 | 68.40 | 385.77 |
| SEm+ | 0.04 | 0.01 | 0.01 | 0.24 | 5.64 | 1.49 | 7.94 | |
| CD @ 0.05 | NS | NS | 0.03 | NS | 16.76 | 4.43 | 23.58 |
Table text extracted from the original PDF; superscript letters are shown inline. The original table image is below.
View original table image
Table 1: Effect of different sources of organic manures on Phosphorus availability Tr. No. Treatments Available Phosphorus (mg kg-1) Cumulative available P (mg kg-1) 0 DAI 15 DAI 30 DAI 45 DAI 60 DAI 75 DAI 90 DAI T1 Absolute control 11.92 11.97 12.09 12.27 12.47 12.64 12.75 86.11 T2 GRDF 12.27 16.93 18.03 21.63 24.74 26.77 28.55 148.92 T3 RD-NK+ 100% RD- P2O5 + PMC 2.0 t ha -1 12.10 17.20 18.18 20.91 22.25 23.14 23.70 137.48 T4 RD-NK+ 75% RD- P2O5 + PMC 4.0 t ha -1 12.14 16.06 18.77 22.64 25.61 27.66 29.09 151.97 T5 RD-NK+ 100% RD- P2O5 + PROM 0.5 t ha -1 12.36 17.70 19.12 23.50 26.93 27.99 28.45 156.04 T6 RD-NK+ 75% RD- P2O5 + PROM 1.0 t ha -1 12.41 17.77 20.03 25.26 28.91 30.12 30.51 165.01 SEm+ 0.24 0.64 0.74 1.25 1.41 1.14 0.67 CD @ 0.05 NS 1.89 2.19 3.72 4.18 3.39 1.98 Table 2: Effect of different sources of organic manures on soil chemical properties and soil available nutrients Tr. No.
| Tr. No. | Treatments | Available Phosphorus (mg kg-1) | — | — | — | — | — | — | Cumulative available P (mg kg-1) |
|---|---|---|---|---|---|---|---|---|---|
| 0 DAI | 15 DAI | 30 DAI | 45 DAI | 60 DAI | 75 DAI | 90 DAI | |||
| T1 | Absolute control | 11.92 | 11.97 | 12.09 | 12.27 | 12.47 | 12.64 | 12.75 | 86.11 |
| T2 | GRDF | 12.27 | 16.93 | 18.03 | 21.63 | 24.74 | 26.77 | 28.55 | 148.92 |
| T3 | RD-NK+ 100% RD- P2O5 + PMC 2.0 t ha -1 | 12.10 | 17.20 | 18.18 | 20.91 | 22.25 | 23.14 | 23.70 | 137.48 |
| T4 | RD-NK+ 75% RD- P2O5 + PMC 4.0 t ha -1 | 12.14 | 16.06 | 18.77 | 22.64 | 25.61 | 27.66 | 29.09 | 151.97 |
| T5 | RD-NK+ 100% RD- P2O5 + PROM 0.5 t ha -1 | 12.36 | 17.70 | 19.12 | 23.50 | 26.93 | 27.99 | 28.45 | 156.04 |
| T6 | RD-NK+ 75% RD- P2O5 + PROM 1.0 t ha -1 | 12.41 | 17.77 | 20.03 | 25.26 | 28.91 | 30.12 | 30.51 | 165.01 |
| SEm+ | 0.24 | 0.64 | 0.74 | 1.25 | 1.41 | 1.14 | 0.67 | ||
| CD @ 0.05 | NS | 1.89 | 2.19 | 3.72 | 4.18 | 3.39 | 1.98 |
Table text extracted from the original PDF; superscript letters are shown inline. The original table image is below.
View original table image
Treatments CaCO3 Soil Chemical Properties Available Nutrients (kg ha-1) pH (1:2.5) EC (dS m-1) OC (%) (%) N P K T1 Absolute control 7.9 0.36 0.48 9.74 185.96 28.59 352.65 T2 GRDF 7.88 0.4 0.54 9.72 252.18 64.01 416.20 T3 RD-NK+ 100% RD- P2O5 + PMC 2.0 t ha -1 7.8 0.38 0.50 9.71 255.93 53.14 392.64 T4 RD-NK+ 75% RD- P2O5 + PMC 4.0 t ha -1 7.78 0.39 0.51 9.7 257.50 65.22 398.18 T5 RD-NK+ 100% RD- P2O5 + PROM 0.5 t ha -1 7.91 0.37 0.49 9.72 251.19 63.78 383.55 T6 RD-NK+ 75% RD- P2O5 + PROM 1.0 t ha -1 7.92 0.38 0.50 9.71 252.41 68.40 385.77 SEm+ 0.04 0.01 0.01 0.24 5.64 1.49 7.94 CD @ 0.05 NS NS 0.03 NS 16.76 4.43 23.58 Table 3: Correlation between soil available phosphorus and soil properties Available phosphorus at 90 days pH -0.075 EC 0.582** OC 0.524** CaCO3 -0.448* Available N 0.934** Available K 0.758** https://www.agriculturejournal.net Fig 1: Effect of different organic manures on available Phosphorus during incubation
Conclusion
An application of RD NK+75% RD - P2O5 + PROM 1.0 t ha-1 found superior for phosphorus availability and overall improvement in the soil fertility status of Vertisol and it was followed by RD NK+75% RD - P2O5 + PMC 4.0 t ha-1 and GRDF (50:75:45 N: P2O5:K2O kg ha-1 + FYM 10 t ha -1).
References
5 in the original paper- Bagade PS, Jadhav AB, Gosavi AB, Meshram P. Impact of rock phosphate-based PROM (phosphorus rich organic manure) on enzyme activities and nutrient availability in calcareous soil under soybean cultivation. Asian J Soil Sci Plant Nutr. 2025;11(1):417–429.
- Kumari M, Sheoran S, Prakash D, Yadav DB, Yadav PK, Jat MK. Long-term application of organic manures and chemical fertilizers improve the organic carbon and microbiological properties of soil under pearl millet– wheat cropping system in North-Western India. Heliyon. 2024;10(3).
- Motsara MR. Available phosphorus status of Indian soils. Fertil News. 2001;46(11):15–21.
- Walpola BC, Hettiarachchi RHAN. Comparison of qualitative and quantitative methods for isolation of phosphate solubilizing microorganisms. Vidyodaya J Sci. 2020;23(2).
- Wani PV. Studies on phosphates solubilizing ability of microorganisms: a review. J Maharashtra Agric Univ. 1980;5(2):144–147.