
Research article · 2025 · Full text
International Journal of Geography Geology and EnvironmentRegional imbalances in maize productivity in Rajasthan during 1990-91 to 2014-15: A geographical perspective
Volume 7(8) · Pages 46–53 · DOI: 10.22271/27067483.2025.v7.i8a.393 ↗
Research areasAgricultural Economics and PracticesCrop Yield and Soil FertilityRice Cultivation and Yield Improvement
Abstract
Author-writtenThe principal objective of the present study is to reveal the changes in regional Imbalances of maize productivity in Rajasthan, his study examines the regional imbalance in maize productivity in Rajasthan from 1990-91 to 2014-15. The research analyzes the trends and disparities in maize productivity across different regions of the state, highlighting the factors contributing to these imbalances. The findings reveal significant variations in maize productivity, with some regions experiencing higher growth rates than others. The study uses district-level data to assess the productivity gaps and identifies the key drivers of productivity differences, including irrigation, soil quality, and adoption of technology. The results provide insights into the regional disparities in agricultural productivity, offering valuable information for policymakers and stakeholders to develop targeted strategies for promoting balanced agricultural development in Rajasthan. The study's findings can inform policy interventions aimed at reducing regional imbalances and enhancing overall agricultural productivity in the state. The study in hand is based on secondary sources of data. The unit of study is district. Modified formula of Singh (1976) technique is used for deriving the results and cartographic method is applied for mapping the results.
Summary
Source-checkedPlain-language reading of the full paper, prepared with AI and checked against the text. Each point links to the authors' own words.
Why it matters
- Maize is globally recognized as the third most significant cereal crop, following wheat and rice. View evidence ↗
- The crop is highly valued for its versatility and ability to adapt to various climate changes. View evidence ↗
- While maize has diverse global uses in industry and animal feed, it is primarily used for human consumption in Rajasthan. View evidence ↗
The question
- The study aims to identify and analyze changes in the regional imbalances of maize productivity within Rajasthan. View evidence ↗
- The research seeks to determine the specific factors that drive these regional productivity disparities. View evidence ↗
What they did
- The research utilized secondary data with the district serving as the primary unit of analysis. View evidence ↗
- Productivity results were derived using the Singh (1976) technique and visualized through cartographic mapping. View evidence ↗
What they found
- In 1990-91, maize productivity varied significantly, ranging from a low index value of 24.13 in Jaisalmer to a high of 518.91 in Udaipur. View evidence ↗
- The overall yield index for maize increased from 988 kg per hectare in 1990-91 to 1514 kg per hectare in 2014-15. View evidence ↗
- Maize maintained its 6th rank in cropped area, though its share decreased from 5.50% in 1990-91 to 3.60% in 2014-15. View evidence ↗
- High productivity in southern regions was attributed to high rainfall, high temperature, moderate soil fertility, and gentle land gradients. View evidence ↗
- The group of seven districts with high maize productivity remained constant between 1990-91 and 2014-15. View evidence ↗
- The number of districts categorized as having low maize productivity increased from 19 to 21 over the study period. View evidence ↗
What it means
- The authors conclude that there were no major shifts in productivity levels because the maize belt remains strictly confined to the southern parts of the state. View evidence ↗
- To reduce disparities, the authors recommend implementing sprinkle irrigation, soil reclamation, improved seeds, better road networks, and farmer training. View evidence ↗
Visual summary
2 visualsIllustrations explain the paper; charts are replotted from the paper's own table values.
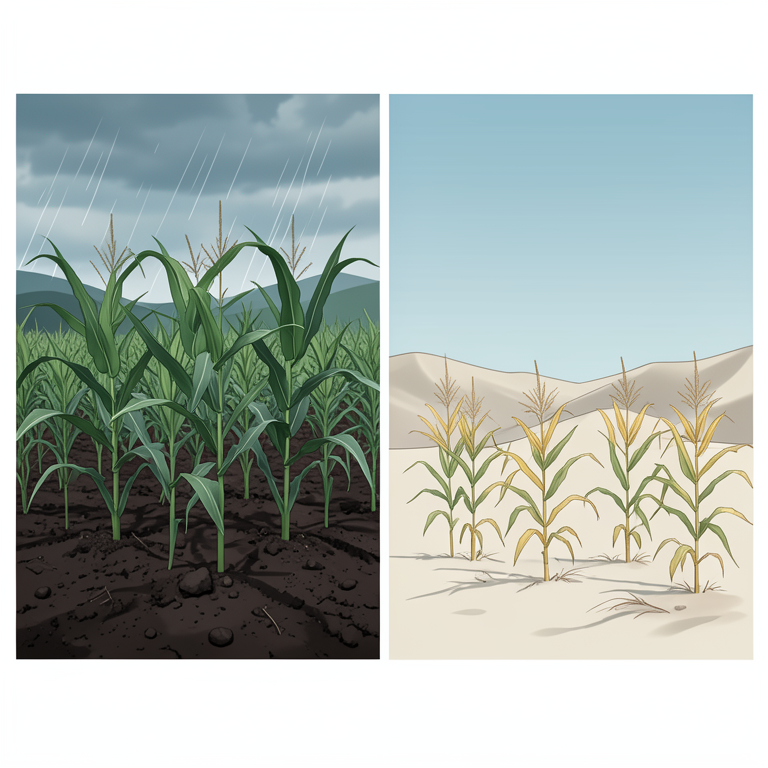
Factors Influencing Maize Productivity
AI-generated conceptual illustration (maize plants in Rajasthan landscapes). It explains the idea and does not show study data.
View source evidence ↗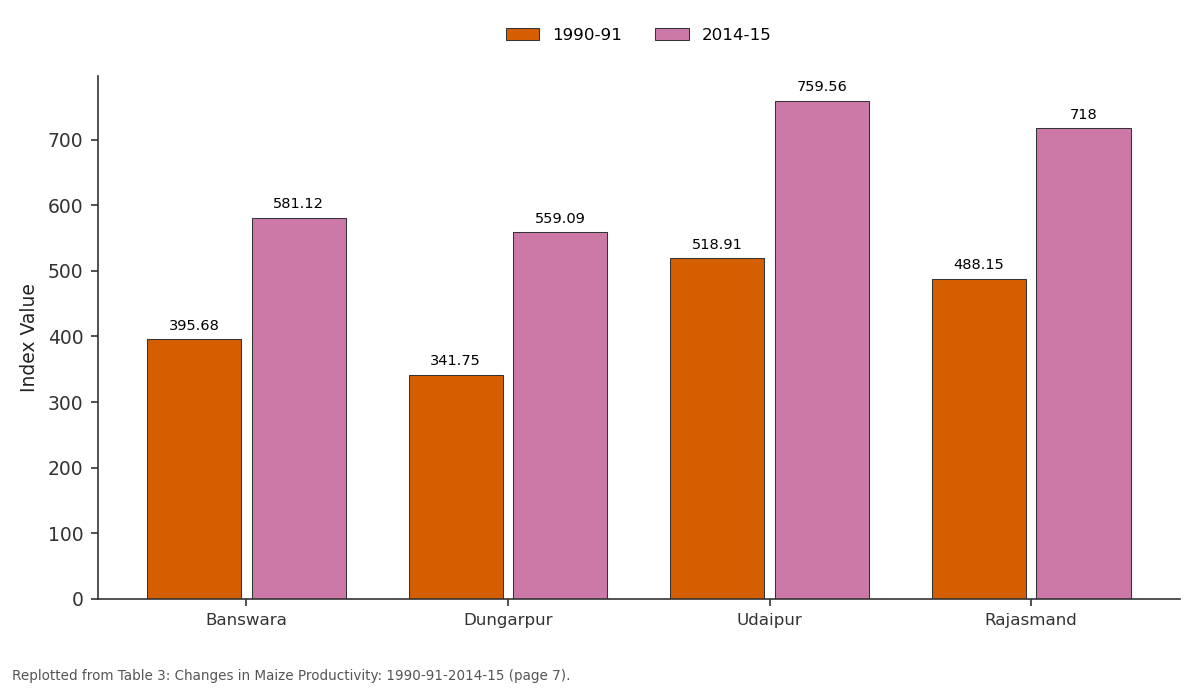
1990-91 and 2014-15: Banswara vs Dungarpur vs Udaipur vs Rajasmand
Replotted from Table 3 (page 7) of the original paper. Every bar is the paper's own table value.
View source evidence ↗Figures & tables
From the original paper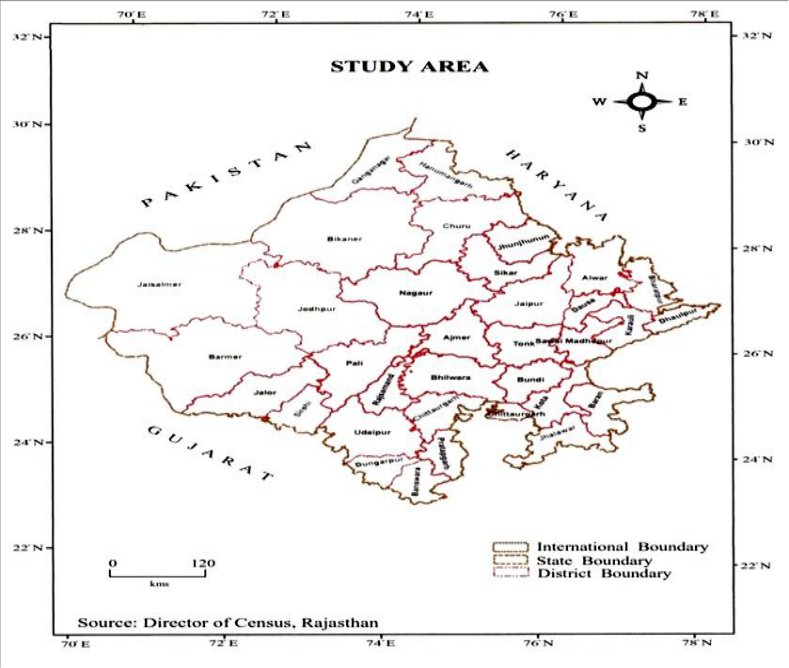 Figure 1
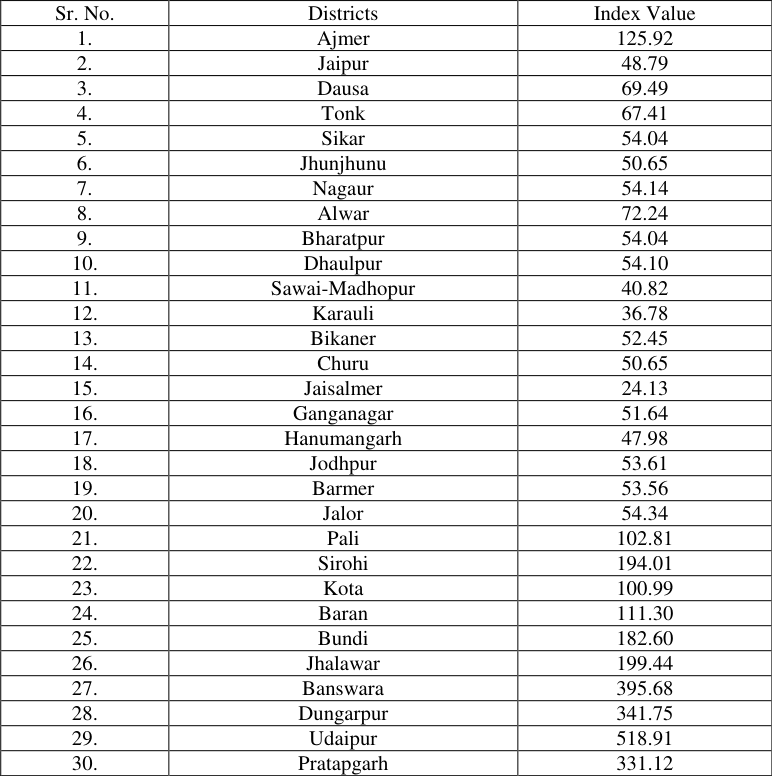 Table 1
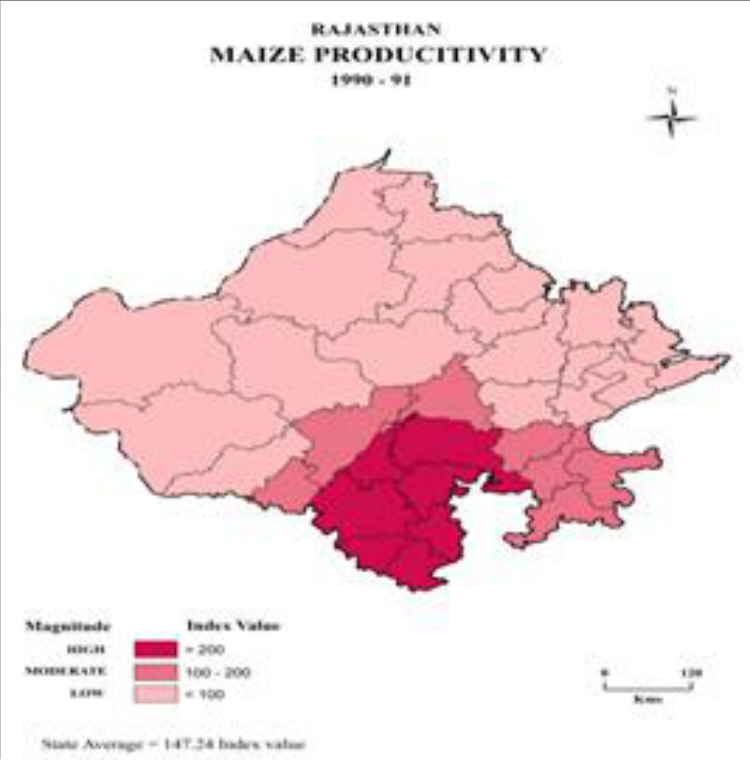 Figure 2
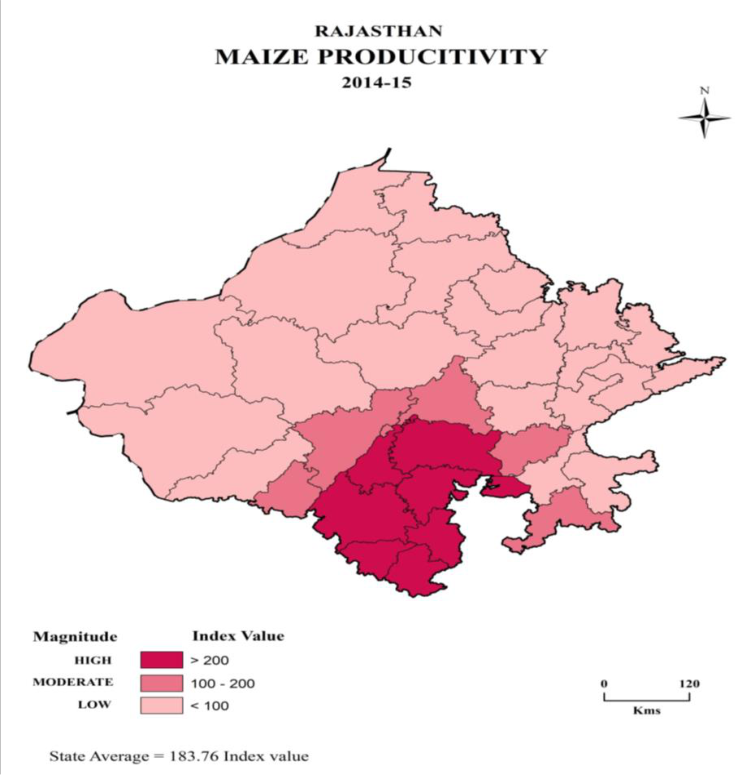 Figure 3
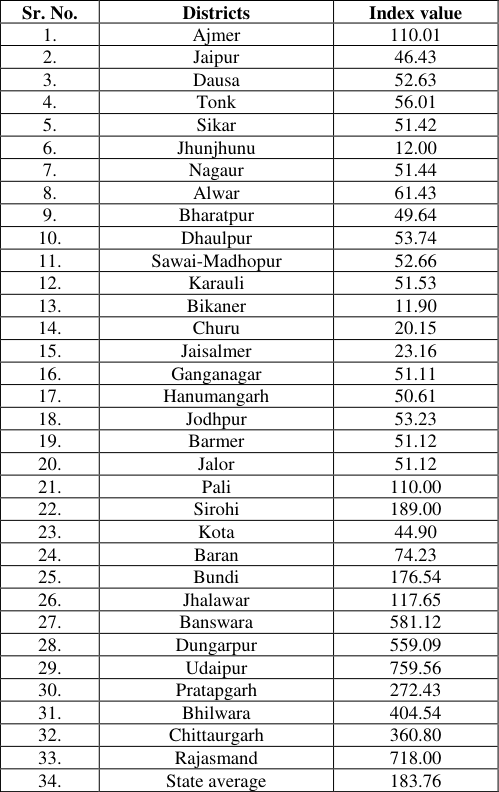 Table 2
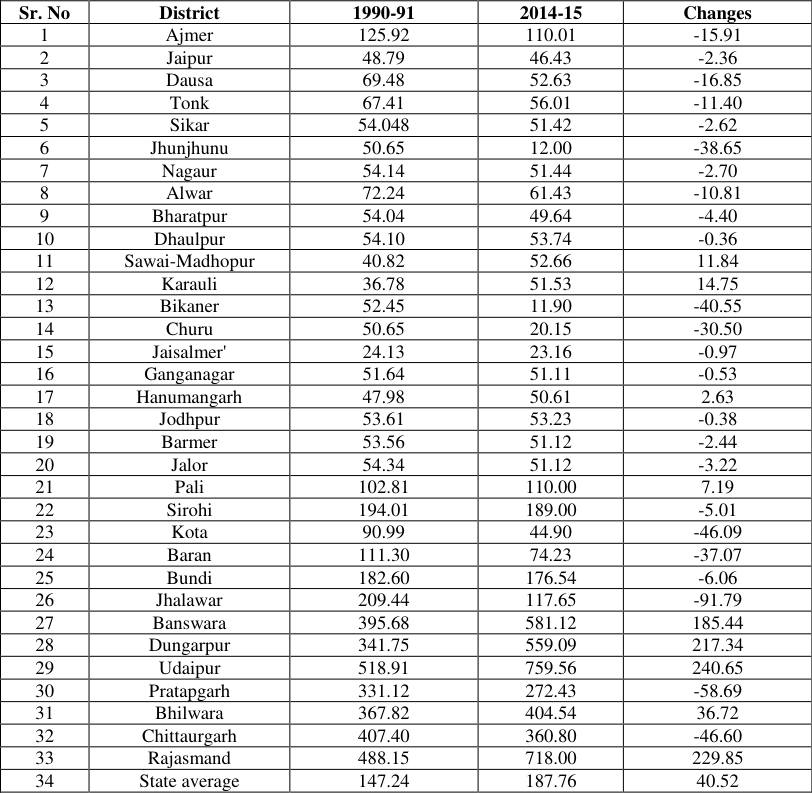 Table 3
Introduction
Maize is third most important cereal crop in the world after wheat and rice. Firstly, it was domesticated in Latin America but later on in Indian cropping pattern, it was introduced by Portuguese in 17 century. Basically, it is of two types; yellow maize and white maize. Traditionally, Yellow maize is used as a fodder crop for animals while white maize as a food crop for human consumption; even it is used as a raw material in food processing industries. Due to its predominant position, it is referred as "queen of cereals" (Pillai, 2014) [10] . Maize is considered as most versatile crop because of its great potentiality to adapt climate change. Kumar et al. (2013) [11] described in their report that due to its versatile characteristics, it is famous crop all over the world and is cultivated in tropical, sub-tropical and temperate regions. Gao, et al. (2021) [12] also mentioned that maize can be cultivated in all types of soils and agro-climatic conditions. Maize is one of the most adaptable crops, which can be grown in a variety of agro-climatic conditions. Maize is also recognized as the "Queen of Cereals" around the world because it has the highest genetic production potential of all cereals. Corn is another name for it (Parihar etal, 2011) [5] . Botanically, it is known as "Zea mays" and is a member of the grain family "Gramineae." Maize is the only grain crop that can be produced throughout the year. Maize has a wide variety of uses, such as human food, animal feed and industrial products. But in Rajasthan, it is mainly used as human food. Maize is grown under divergent physical conditions, which require 18˚c and 27˚c temperatures. It is mostly grown in regions having rainfall from 50 to 100 cm (Saxena, 2019) [13] .
Study area (Fig 1)
Rajasthan is the largest state of India, covering 3,42,274 sq km area. Its latitudinal and longitudinal extent lies between 23˚3' N to 30˚12' N and 69˚30' E and 78˚17' E respectively. Its neighboring states are Punjab, Haryana, Uttar Pradesh, Madhya Pradesh and Gujarat.
Methodology and Sources of Data
The study is empirical in nature and based on secondary data which is collected from various sources like Lal kitabs, Directorate of Agriculture, Rajasthan, various libraries, etc. Unit of study is district. Singh (1976) technique is used for deriving the results and cartographic method is applied for mapping the results.
Singh (1976) method for determining agricultural productivity index value is as follow
Crop Productivity = (C_i+Y_i)/2 Where C_i is the crop concentration index and Y_i is the crop yield index
Where C_i is the crop concentration index Pa_e is the percentage strength of crop 'a' of total cropped area in the component enumeration unit and Pa_r is the percentage strength of crop 'a' of total cropped area in the entire region.
Where Y_i is the crop yield index. Ya_e is the average yield per hectare of crop 'a' in the component enumeration unit. Ya_r is the average yield of crop 'a' in the entire region. Striking variations are noted in distributional patterns in the level of maize productivity during 1990-91 in the study region, which was lowest of 24.13 index value in Jaisalmer district and highest of 518.91 per cent in Udaipur district. A view of Fig. 2 reveals that the magnitude of maize productivity decreased from south to north, as well as from south-east to south-west. To know the factors responsible for this great range in levels of maize productivity, an analysis of fig. 2 is made in the following pages. Sources: Directorate of Agriculture, Rajasthan, Jaipur.
Discussion
Discussion
Areas with High Maize Productivity (Over 200 Index
Value): This category was confined to the southern parts of the study region, forming one compact belt. The belt of this category had seven districts,namely Udaipur, Rajasmand, Bhilwara, Chittaurgarh, Dungarpur, Banswara, and Pratapgarh. Reasons identified for high maize productivity were high rainfall, high temperature, gentle to moderate gradient of land, moderate soil fertility; moreover, farmers devoted areas with high fertility and moderate to high extent of irrigation to ricecrop in the kharif season. While areas with inadequate irrigation facilities and less fertile soil were used for maize cultivation, because maize did not require more irrigation and flat land, water should not stand in maize fields. Here,both the concentration index and yield index of maize were noted as high, which resulted ina high magnitude of maize productivity in these districts.
Sources: Directorate of Agriculture, Rajasthan, Jaipur These districts received moderate rainfall, low extent of irrigation, land with gentle gradient, etc, which were responsible for a moderate maize productivity index value. But the second belt contained Baran, Jhalawar, Kota, and Bundi, which had high rainfall, black soils, high temperature, etc. All these factors led to a moderate index value ofmaize productivity. This category had both concentration and yield indices of moderate magnitude because in these areas, bajra and rice were competitive crops to maize which resultingin moderate levels of maize productivity.
Areas with Low Maize Productivity (less than 100 index value):
The rest of the state had low maize productivity magnitude. In this category, there were nineteen districts, namely Ganganagar, Hanumangarh, Bikaner, Churu, Jhunjhunu, Sikar, Jaipur, Nagaur, Jodhpur, Jalor, Barmer, Jaisalmer, Sawai-Madhopur, Karauli, Dhaulpur,Bharatpur, Tonk, Dausa, and Alwar. Except northeastern parts of this category, there was high temperature, low rainfall, low irrigation, sandy soils, etc., which were unfavorable for maize cultivation. Secondly, kharif crops like bajra and guar were competitive with maize. Moreover, geo-climatic conditions were adverse to maize cultivation. Thus, maize area and maize yield were recorded as low, which led to a low concentration index as well asa low yield index and ultimately resulted ina low overall crop productivity index value of maize. While in the remaining districts, the competitive crops were bajra and jowar, which were predominant and ultimately adversely affected maize cultivation whichresultingina low magnitude of maize productivity. Thus, it reveals that maize productivity levels were found to be moderate to high in areas with high rainfall, with slanting slopes confined to the southern parts of the study region. Whereas, areas with predominance of dunes, low to moderate rainfall, sandy loam soil, with predominance of guar and bajra had a poor magnitude of maize productivity.
The above discussion reveals that patterns of rainfall, irrigation, types of soils, gradient of land, nature of relief, etc., were the reasons for striking variations in maize productivity.
B. Patterns of Maize Productivity: 2014-15
Maize cultivation is highly concentrated in the southern parts of the study region. Great variations are noted in the index value of maize productivity, which varies from 11.10 index value in Churu district to 718.00 index value in Rajasmand district. The productivity of any crop depends on geo-climatic conditions and the level of development of socio-economic attributes. Hence, to reveal the spatial pattern of maize productivity and the reasons responsible, help is taken from the figure. 3, which portrays the following categories:
1. Districts with High Level of Maize Productivity (Over 200 index value) Seven districts lie in this category, which account for 21.21 percent of the total occurrences. These are found in one compact belt that confines to the southern parts. These are the areas, where there are Aravallis with their gentle slope and some plain areas with shallow gradient of land followed by high rainfall, moderate to fertile soil, high extent of irrigation etc. which enable the farmers to grow maize particularly on sloppy ground followed by high yield per unit, area because of the adequate irrigation facilities, high consumption of chemical fertilizer, use of high yielding variety of seeds, etc. Thus, both the concentration index and yield index are noted as high, which consequently resulted in a high index value of maize productivity in this category.
Sources: Directorate of Agriculture, Rajasthan, Jaipur The moderate category is found on the periphery of the high category in southern parts and is also lying between the high and low categories. These are maize growing areas of secondary importance, but owing to either low concentration index or high yield index in some areas, or high concentration index or low yield index in other areas, the magnitude of maize productivity is noted as moderate. It has five districts which form one belt and one patch. The belt contains districts of Sirohi, Pali, Ajmer, and Bundi. In all these areas, the soils are of moderate fertility, moderate rainfall, low to moderate extent of irrigation, etc., which are responsible for a moderate index of maize productivity.
District-wise Lal Kitabs of Rajasthan
The patch of this category comprises the Jhalawar district, where high concentration index and moderate yield index ultimately lead to a moderate magnitude of maize productivity. Owing to the predominance of wheat and oilseeds, which are of Rabi crops, the share of maize is low in the overall cropping pattern; therefore, all this has resulted ina moderate index value of maize productivity in this patch. Hence, owing to these different factors in different districts, a moderate magnitude of maize productivity is noted in this category.
3.
Districts with a Low level of Maize Productivity (Less than 100 Index Value): Twenty-one districts and 63.63 percent of the total occurrences form in this category, which are basically non-maize growing areas. Among these districts, Sikar, Jodhpur, Jalor, Jhunjhunu, Nagaur, Barmer, Jaisalmer, Bikaner, Churu, Ganganagar and Hanumangarh are part of the Thar desert, where high temperature, low rainfall, frequent occurrence of dunes, sandy soil, low to moderate irrigation facilities, etc. are not ideal factors for maize cultivation, because maize requires more moisture. Thus, in these districts, farmers prefer to grow bajra and guar, particularly in the kharif season. While the remaining districts, which include Jaipur, Alwar, Dausa, Tonk, Kota, Baran, Sawai-Madhopur, Karauli, Bharatpur, and Dhaulpur, receive moderate rainfall, from a relief point of view, farmers prefer jowar and bajra cultivation in these districts. Moreover, soils are also of low to moderate fertility. Hence, these are the factors that adversely affect both the concentration index and yield index of maize, which lead to a low magnitude of maize productivity in these ten districts. To sum up, Maize productivity magnitude is high and moderate in districts with high rainfall, slanting topography, and fertile soils. The rest of the 21 districts, which comprise western, northern, and eastern parts, have recorded a low level of maize productivity. Moreover, it is also found that in areas with a predominance of guar or bajra, its index value is noted as low. Further, the study has also noted that in areas with low productivity of bajra and guar, maize productivity is high.
C. Changes in Maize Productivity: 1990-91 to 2014-15
Rajasthan has witnessed significant changes in socioeconomic factors during the period under present investigation, which has affected the changes in the magnitude of maize productivity. Here, an attempt is made to find out the changes in levels of maize productivity. For achieving this purpose, help is taken from figs. 3 & 3 and the table 3, the analysis is as below; Maize remained confined to the southern parts of the study region throughout the period under present investigation. It was enjoying the 6th rank with 5.50 percent of total cropped area in 1990-91 and has maintained its 6th position in 2014-15, also, although its percent share area has declined from 5.50 percent to 3.60 percent. Maize has witnessed a significant increase in yield index, because yield has increased from 988 kg per hectare to 1514 kg per hectare from 1990-91 to 2014-15, owing to the development of agricultural infrastructure in post 1990-91 period, which has affected its productivity magnitude positively. The category of high magnitude of maize productivity had seven districts in 1990-91, which remained seven in 2014-15 also. These districts were Rajasmand, Banswara, Dungarpur, Udaipur, Pratapgarh, Chittaurgarh, and Bhilwara. Here, high rainfall, gentle slopes, high extent of irrigation, fertile soils, etc., followed by developed agricultural infrastructure, were the factors responsible for high productivity. Mostly on gentle slopes, farmers prefer maize, and in low-lying flat areas with irrigation facilities, they cultivate rice. Moderate category of maize productivity magnitude found between the high and low categories of maize productivity during 1990-91 to 2014-15. It surrounds the high category and is found in two belts. The first belt covered the districts of Sirohi, Pali, and Ajmer, while the second belt contained the districts of Bundi, Kota, Baran, and Jhalawar in 1990-91. The share of maize cultivation decreased in 2014-15, because more area came under rice in the second belt. In the second belt, the reasons responsible for moderate productivity were high rainfall and more areas under rice cultivation In 1990-91, as well as in 2014-15. But in 2014-15, the number of districts declined from 7 to 5 in the moderate category, which are Sirohi, Pali, Ajmer, Bundi, and Jhalawar. In Ajmer district, the share of jowar is more, and in Pali and Sirohi districts, the percentage share of bajra is high, which affects maize productivity. But in the case of Bundi district, maize productivity is moderate in nature because of more area under rice, which is another kharif crop. Thus, during the study period, a decline in the number of districts in the moderate level of maize productivity category is noted. The number of districts in the low category of maize productivity has increased from 19 to 21 during the study period. The districts which have joined the low category from the moderate category of maize productivity in 2014-15 are Baran and Kota, where high rainfall, adequate irrigation facilities, etc., have attracted farmers for rice cultivation and consequently, the share of maize in the cropping pattern becomes low which leads to low maize productivity. In the north-eastern districts of low category, reasons for the low level of maize productivity are low to moderate rainfall, low to moderate extent of irrigation, and traditionally predominance of either bajra or jowar, or pulses during the kharif season. While in western districts during both periods, because of the predominance of guar and bajra crops, low rainfall, less irrigation, etc, the area under the maize crop remained less than one percent. The yield is also low in both periods. Thus low yield index and the low concentration index of maize are responsible for low maize productivity in 1990-91 as well as in 2014-15. Secondly, districts falling in the low category are largely non-maize growing areas, because of unfavorable physical factors like sandy soils and low rainfall. It is noticed that the maize productivity magnitude starts declining as one moves from south to north, or east or west, because of a decline in annual rainfall and poor irrigation facilities. Secondly, no major changes in levels of maize productivity as well as the number of districts with high, moderate, and low productivity are found, because the maize belt of Rajasthan is confined only to the southern parts, owing to a favourable physical environment like gentle slopes, high rainfall, fertile soils, etc.
| Sr. No | District | 1990-91 | 2014-15 | Changes |
|---|---|---|---|---|
| 1 | Ajmer | 125.92 | 110.01 | -15.91 |
| 2 | Jaipur | 48.79 | 46.43 | -2.36 |
| 3 | Dausa | 69.48 | 52.63 | -16.85 |
| 4 | Tonk | 67.41 | 56.01 | -11.40 |
| 5 | Sikar | 54.048 | 51.42 | -2.62 |
| 6 | Jhunjhunu | 50.65 | 12.00 | -38.65 |
| 7 | Nagaur | 54.14 | 51.44 | -2.70 |
| 8 | Alwar | 72.24 | 61.43 | -10.81 |
| 9 | Bharatpur | 54.04 | 49.64 | -4.40 |
| 10 | Dhaulpur | 54.10 | 53.74 | -0.36 |
| 11 | Sawai-Madhopur | 40.82 | 52.66 | 11.84 |
| 12 | Karauli | 36.78 | 51.53 | 14.75 |
| 13 | Bikaner | 52.45 | 11.90 | -40.55 |
| 14 | Churu | 50.65 | 20.15 | -30.50 |
| 15 | Jaisalmer' | 24.13 | 23.16 | -0.97 |
| 16 | Ganganagar | 51.64 | 51.11 | -0.53 |
| 17 | Hanumangarh | 47.98 | 50.61 | 2.63 |
| 18 | Jodhpur | 53.61 | 53.23 | -0.38 |
| 19 | Barmer | 53.56 | 51.12 | -2.44 |
| 20 | Jalor | 54.34 | 51.12 | -3.22 |
| 21 | Pali | 102.81 | 110.00 | 7.19 |
| 22 | Sirohi | 194.01 | 189.00 | -5.01 |
| 23 | Kota | 90.99 | 44.90 | -46.09 |
| 24 | Baran | 111.30 | 74.23 | -37.07 |
| 25 | Bundi | 182.60 | 176.54 | -6.06 |
| 26 | Jhalawar | 209.44 | 117.65 | -91.79 |
| 27 | Banswara | 395.68 | 581.12 | 185.44 |
| 28 | Dungarpur | 341.75 | 559.09 | 217.34 |
| 29 | Udaipur | 518.91 | 759.56 | 240.65 |
| 30 | Pratapgarh | 331.12 | 272.43 | -58.69 |
| 31 | Bhilwara | 367.82 | 404.54 | 36.72 |
| 32 | Chittaurgarh | 407.40 | 360.80 | -46.60 |
| 33 | Rajasmand | 488.15 | 718.00 | 229.85 |
| 34 | State average | 147.24 | 187.76 | 40.52 |
Table text extracted from the original PDF; superscript letters are shown inline. The original table image is below.
View original table image
Conclusion
In 1990-91 reveals that maize productivity levels were found to be moderate to high in areas with high rainfall, with slanting slopes confined to the southern parts of the study region. Whereas, areas with predominance of dunes, low to moderate rainfall, sandy loam soil, with predominance of guar and bajra had a poor magnitude of maize productivity. The above discussion reveals that patterns of rainfall, irrigation, types of soils, gradient of land, nature of relief, etc., were the reasons for striking variations in maize productivity. While in 2014-15, maize productivity magnitude is high and moderate in districts with high rainfall, slanting topography, and fertile soils. The rest of the 21 districts, which comprise western, northern, and eastern parts, have recorded a low level of maize productivity. Moreover, it is also found that in areas with a predominance of guar or bajra, its index value is noted as low. Further, the study has also noted that in areas with low productivity of bajra and guar, maize productivity is high. It is noticed that the maize productivity magnitude starts declining as one moves from south to north, or east or west, because of a decline in annual rainfall and poor irrigation facilities. Secondly, no major changes in levels of maize productivity as well as the number of districts with high, moderate, and low productivity are found, because the maize belt of Rajasthan is confined only to the southern parts, owing to a favourable physical environment like gentle slopes, high rainfall, fertile soils, etc.
Suggestions
For increasing Mziae productivity and minimizing regional disparities in Rajasthan, recommended suggestions are; to enthuse sprinkle irrigation, reclamation of kallar soils, introduction of improved seeds of crops of maize, to strengthen village road network, open more agricultural markets, impart training to farmers about new technology in agriculture by agricultural research institutes and government departments, remunerative prices of maize and their ensured marketing, liberal loan facilities to farmers, favourable government policy etc. If these suggestions are implemented than Maize productivity of the state will increase in future.
Figures and tables from the paper
| Sr. No. | Districts | Index Value |
|---|---|---|
| 1. | Ajmer | 125.92 |
| 2. | Jaipur | 48.79 |
| 3. | Dausa | 69.49 |
| 4. | Tonk | 67.41 |
| 5. | Sikar | 54.04 |
| 6. | Jhunjhunu | 50.65 |
| 7. | Nagaur | 54.14 |
| 8. | Alwar | 72.24 |
| 9. | Bharatpur | 54.04 |
| 10. | Dhaulpur | 54.10 |
| 11. | Sawai-Madhopur | 40.82 |
| 12. | Karauli | 36.78 |
| 13. | Bikaner | 52.45 |
| 14. | Churu | 50.65 |
| 15. | Jaisalmer | 24.13 |
| 16. | Ganganagar | 51.64 |
| 17. | Hanumangarh | 47.98 |
| 18. | Jodhpur | 53.61 |
| 19. | Barmer | 53.56 |
| 20. | Jalor | 54.34 |
| 21. | Pali | 102.81 |
| 22. | Sirohi | 194.01 |
| 23. | Kota | 100.99 |
| 24. | Baran | 111.30 |
| 25. | Bundi | 182.60 |
| 26. | Jhalawar | 199.44 |
| 27. | Banswara | 395.68 |
| 28. | Dungarpur | 341.75 |
| 29. | Udaipur | 518.91 |
| 30. | Pratapgarh | 331.12 |
Table text extracted from the original PDF; superscript letters are shown inline. The original table image is below.
View original table image
| Sr. No. | Districts | Index value |
|---|---|---|
| 1. | Ajmer | 110.01 |
| 2. | Jaipur | 46.43 |
| 3. | Dausa | 52.63 |
| 4. | Tonk | 56.01 |
| 5. | Sikar | 51.42 |
| 6. | Jhunjhunu | 12.00 |
| 7. | Nagaur | 51.44 |
| 8. | Alwar | 61.43 |
| 9. | Bharatpur | 49.64 |
| 10. | Dhaulpur | 53.74 |
| 11. | Sawai-Madhopur | 52.66 |
| 12. | Karauli | 51.53 |
| 13. | Bikaner | 11.90 |
| 14. | Churu | 20.15 |
| 15. | Jaisalmer | 23.16 |
| 16. | Ganganagar | 51.11 |
| 17. | Hanumangarh | 50.61 |
| 18. | Jodhpur | 53.23 |
| 19. | Barmer | 51.12 |
| 20. | Jalor | 51.12 |
| 21. | Pali | 110.00 |
| 22. | Sirohi | 189.00 |
| 23. | Kota | 44.90 |
| 24. | Baran | 74.23 |
| 25. | Bundi | 176.54 |
| 26. | Jhalawar | 117.65 |
| 27. | Banswara | 581.12 |
| 28. | Dungarpur | 559.09 |
| 29. | Udaipur | 759.56 |
| 30. | Pratapgarh | 272.43 |
| 31. | Bhilwara | 404.54 |
| 32. | Chittaurgarh | 360.80 |
| 33. | Rajasmand | 718.00 |
| 34. | State average | 183.76 |
Table text extracted from the original PDF; superscript letters are shown inline. The original table image is below.
View original table image
References
10 in the original paper- Census of India. New Delhi: Office of the Registrar General & Census Commissioner; 2011.
- Director of Census, Rajasthan. Rajasthan Census Reports. Jaipur: Directorate of Census Operations; 2011.
- Directorate of Agriculture, Rajasthan. Jaipur: Directorate of Agriculture, Rajasthan; 2011.
- Parihar CM, Jat SL, Singh AK. Maize production technologies in India. New Delhi: Directorate of Maize Research, Indian Council of Agricultural Research; 2011. p. 23-24.
- Gao X, et al. Predicting shifts in land suitability for maize cultivation worldwide due to climate change: a modeling approach. J Land. 2021;47-64.
- Saxon EA. Concept of productivity. Agricultural Productivity. 1965;112-120.
- Pillai U, Phillips K, Wilkins G, Baxter RC, Benn DE, Parker NR, Smith RC, Marsh DJ. Factors that may influence the willingness of cancer patients to consent for biobanking. Biopreservation and Biobanking. 2014 Dec 1;12(6):409-414.
- Kumar K, Parida M, Katiyar VK. Short term traffic flow prediction for a non urban highway using artificial neural network. Procedia-Social and Behavioral Sciences. 2013 Dec 2;104:755-764.
- Gao Z, Xu Y, Sun C, Wang X, Guo Y, Qiu S, Ma K. A systematic review of asymptomatic infections with COVID-19. Journal of Microbiology, Immunology and Infection. 2021 Feb 1;54(1):12-16.
- Saxena N, Kumar A, Mandal A. Adsorption analysis of natural anionic surfactant for enhanced oil recovery: The role of mineralogy, salinity, alkalinity and nanoparticles. Journal of Petroleum Science and Engineering. 2019 Feb 1;173:1264-1283.