
Research article · 2025 · Full text
International Journal of Biology SciencesIsolation of endophytic microorganisms from Parthenium hysterophorus L. and Portulaca oleracea L. for promoting plant growth
Volume 7(8) · Pages 91–103 · DOI: 10.33545/26649926.2025.v7.i8b.450 ↗
Research areasAllelopathy and phytotoxic interactionsPlant-Microbe Interactions and ImmunityPlant Growth Enhancement Techniques
Abstract
Author-writtenEndophytic microorganisms residing within plant tissues play a crucial role in enhancing plant growth and resilience against environmental stresses. This study aimed to isolate endophytic microorganisms from Parthenium heterophorias L. and Portlike oleracea L. to evaluate their potential for promoting plant growth. Healthy plant samples were collected and surface sterilization techniques were employed to isolate true endophytes. A diverse range of bacterial endophytes were isolated, with several demonstrating the production of plant growth-promoting substances such as indole-3-acetic acid (IAA), siderophores, and phosphate solubilization. Additionally, some isolates exhibited antagonistic activity against common plant pathogens. Key isolates, particularly Pseudomonas aeruginosa strains PoR4(a), PoR5 and PoR5(a), exhibited superior plant growth-promoting activities and disease resistance. These findings underscore the potential of these endophytic microorganisms as sustainable bio-inoculants in agriculture, warranting further research into their broader applications and secondary metabolite production. The study highlights the potential of endophytic microorganisms from invasive plants as bio- inoculants to enhance agricultural productivity and sustainability. Further research is recommended to explore their application in various crops and environmental conditions.
Summary
Source-checkedPlain-language reading of the full paper, prepared with AI and checked against the text. Each point links to the authors' own words.
Why it matters
- Endophytic microorganisms live inside plant tissues and are important for improving plant growth and their ability to withstand environmental stress. View evidence ↗
- Parthenium hysterophorus L. and Portulaca oleracea L. are plants of interest due to their unique characteristics and the endophytes they host. View evidence ↗
- Endophytes from invasive weeds may be particularly robust and useful for enhancing crop resilience because they survive in competitive environments. View evidence ↗
The question
- The study aimed to isolate endophytes from Parthenium hysterophorus L. and Portulaca oleracea L. to see if they could promote plant growth. View evidence ↗
What they did
- Plant roots, leaves, and stems were surface-sterilized using a 2% sodium hypochlorite solution for durations ranging from 10 to 60 seconds depending on the plant part. View evidence ↗
- The researchers isolated a total of 44 bacterial strains, with 25 coming from Portulaca oleracea L. and 19 from Parthenium hysterophorus L. View evidence ↗
- Antifungal activity was tested using a modified well diffusion method against seven specific plant pathogenic fungi. View evidence ↗
What they found
- All tested isolates showed activity against Aspergillus niger, with isolate PhR3 producing the largest inhibition zone of 36 mm. View evidence ↗
- At 7 days after inoculation, isolate PoR4(a) released the most inorganic phosphorus at 740.07±1.21 μg/ml. View evidence ↗
- At 3 days after inoculation, isolate PoS1 had the highest potash solubilization efficiency (641.19%), while PoL8 had the largest solubilization zone (46 mm). View evidence ↗
- Isolate PoR5 showed the highest nitrogen fixation capacity, reaching 3.10 g/kg by 7 days after inoculation. View evidence ↗
- At 3 days after inoculation, isolate PoL8 demonstrated the highest zinc solubilization efficiency at 183.07% and a zone of 17 mm. View evidence ↗
- Isolate PoR5(a) produced the largest siderophore production zone, measuring between 20 and 30 mm. View evidence ↗
What it means
- The authors concluded that Pseudomonas aeruginosa strains PoR4(a), PoR5, and PoR5(a) are superior plant growth-promoting rhizobacteria. View evidence ↗
- The authors recommend further research into the secondary metabolites of these strains and their effects on a wider variety of plants. View evidence ↗
Visual summary
2 visualsIllustrations explain the paper; charts are replotted from the paper's own table values.
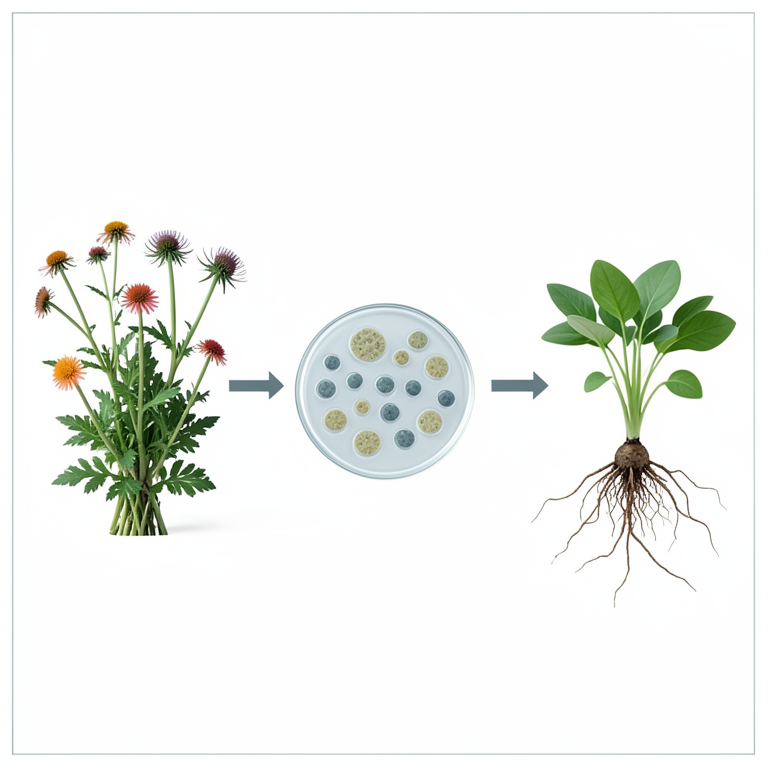
Endophyte Screening Workflow
AI-generated conceptual illustration (Parthenium hysterophorus and Portulaca oleracea plants, bacterial colonies in petri dishes, and young seedlings). It explains the idea and does not show study data.
View source evidence ↗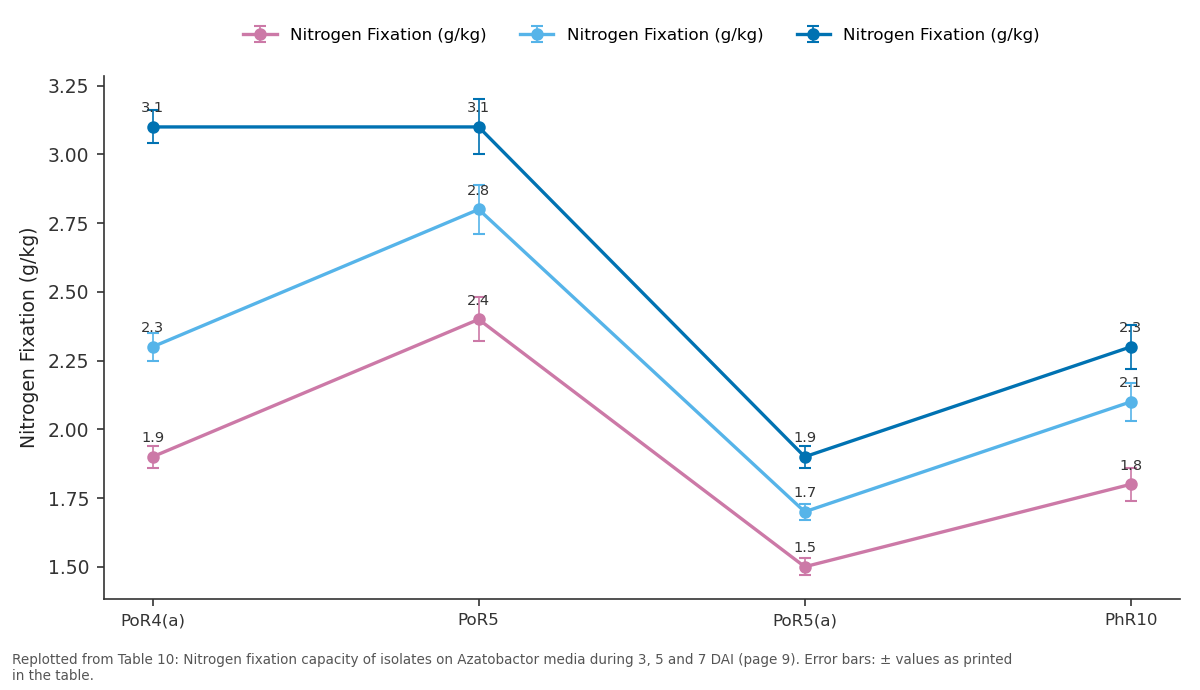
Nitrogen Fixation (g/kg) and Nitrogen Fixation (g/kg) and more: PoR4(a) vs PoR5 vs PoR5(a) vs PhR10
Replotted from Table 10 (page 9) of the original paper. Every bar is the paper's own table value.
View source evidence ↗Figures & tables
From the original paper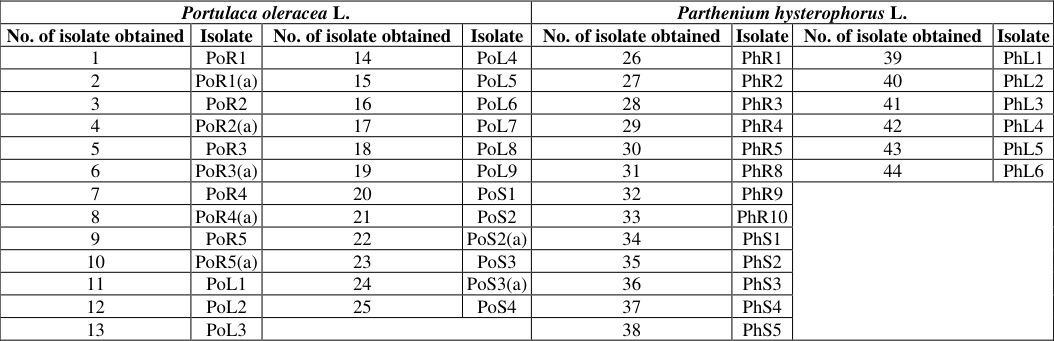 Table 1
 Table 2
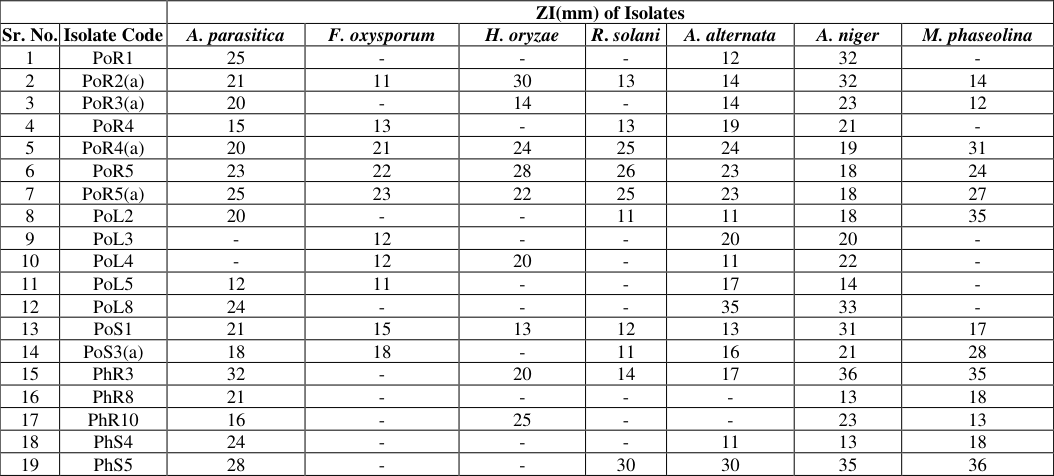 Table 3
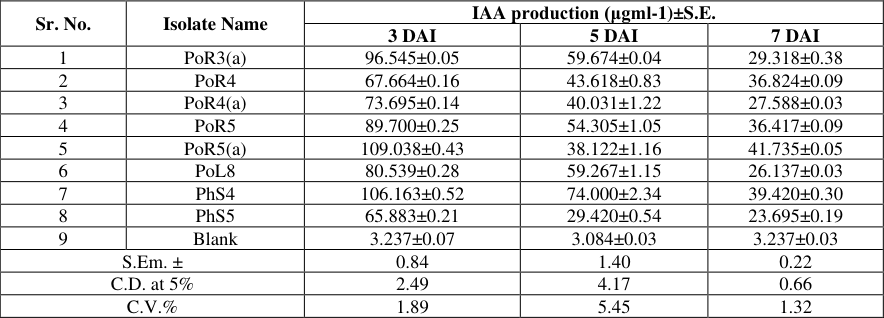 Table 4
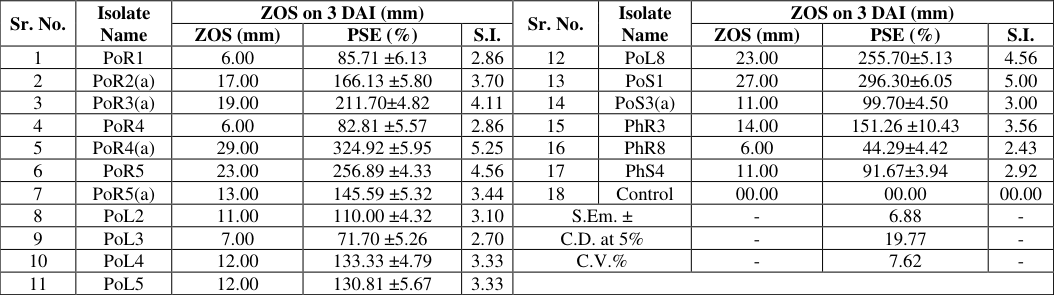 Table 5
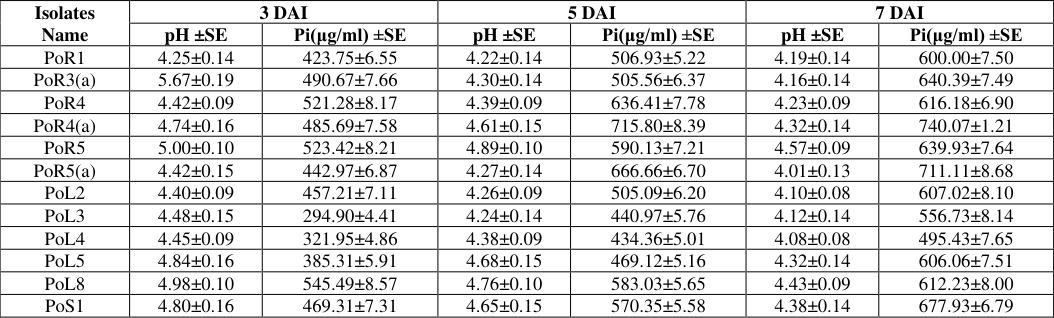 Table 6
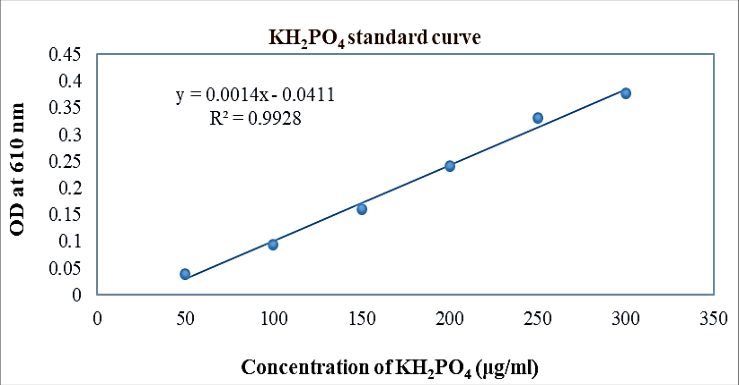 Figure 1
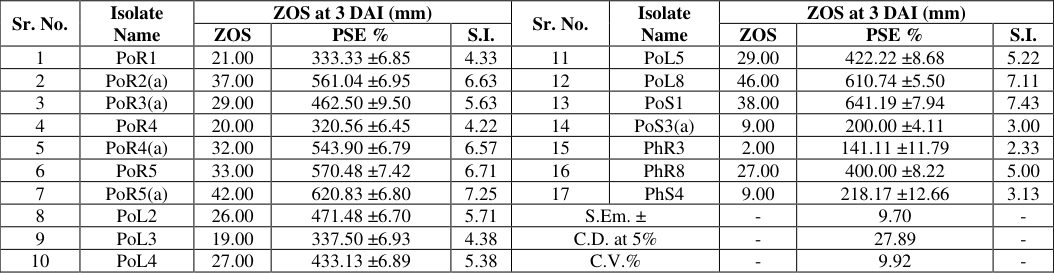 Table 7
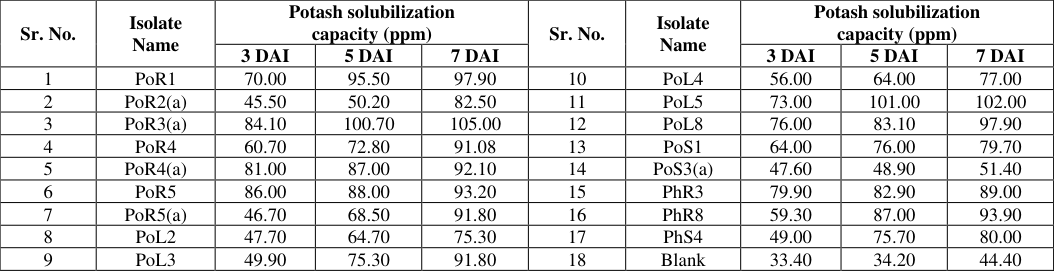 Table 8
 Table 9
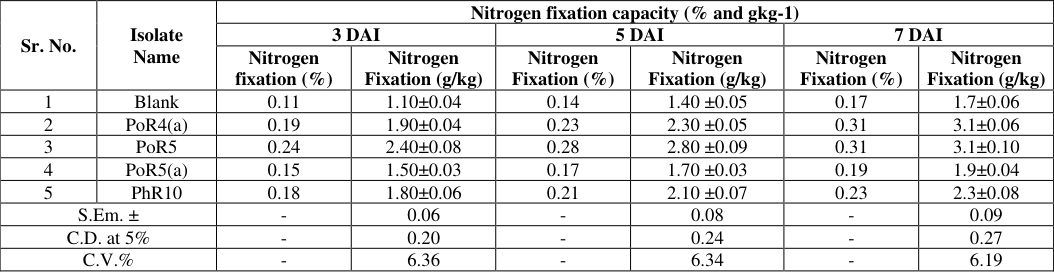 Table 10
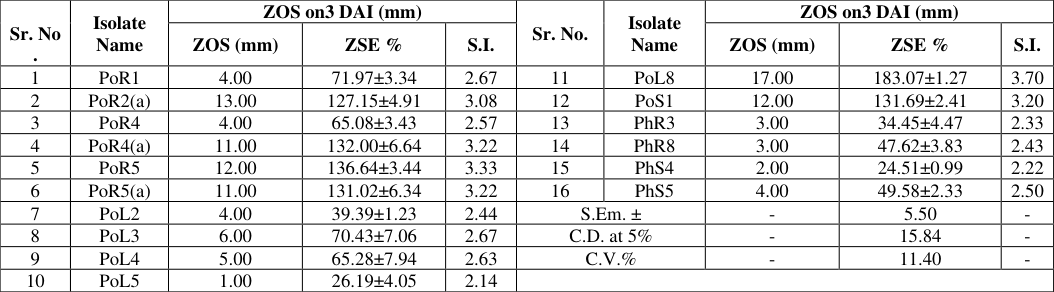 Table 11
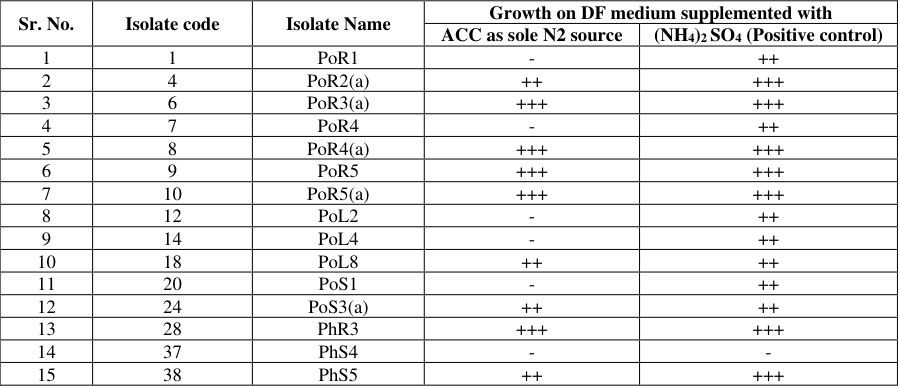 Table 12
 Table 13
Introduction
Endophytic microorganisms, which live within plant tissues without causing apparent harm to their host, have emerged as pivotal agents in sustainable agriculture due to their ability to promote plant growth and enhance stress resilience. These microorganisms can significantly improve nutrient acquisition, bolster resistance against pathogens and increase overall plant vitality, thereby contributing to agricultural productivity. The exploration of endophytic microbes from diverse and often overlooked plant species holds the promise of discovering novel strains with unique and beneficial traits. Recent studies have shown that endophytes and other plant-associated microorganisms play a significant role in weed establishment and growth under suboptimal environmental conditions (Trognitz et al., 2016) [39] . Parthenium heterophorias L. (Parthenium weed) and Portlike oleracea L. (purslane) are two such plant species that have drawn attention for their distinct characteristics and the endophytic communities they harbour. Parthenium heterophorias L. is a global invasive weed growing in different habitats. There are very few reports of endophytes from P. heterophorias (Romero et al., 2001) [35] . Only fungal endophytes from P. hysterophorus were shown to have a growth promotion potential (Priyadharsini and Muthukumar, 2017) [33] . It is, a member of the Asteraceae family, is notorious as an invasive weed with strong allelopathic properties, allowing it to dominate over native vegetation and agricultural crops. Despite its invasive nature, this weed has been found to host a variety of endophytic microorganisms that potentially offer plant growth-promoting (PGP) benefits (Khan and Gurjar, 2023) [20] . The ability of these endophytes to survive within such a competitive and hostile environment indicates their potential robustness and utility in enhancing crop growth and resilience.
Portulaca
oleracea, commonly known as purslane, belongs to the Portulacaceous family and is known for its nutritional and medicinal value. The major bioactive components present in purslane are flavonoids followed by polysaccharides, coumarins, monoterpene glycoside, alkaloids, vitamins, and minerals (Okafor et al., 2014) [25] . Other components such as β-carotene, glutathione, melatonin, and high content of n-3 fatty acids which contribute to the antioxidant properties and free-radical scavenging activities have been shown in numerous in-vitro studies (Naeem and Khan, 2013) [44] . Purslane is a hardy plant that thrives in various environmental conditions. The endophytic microorganisms residing in P. oleracea may play a significant role in its adaptability and vigour, presenting an untapped resource for agricultural biotechnology. Beneficial effects of plant growth-promoting endophytic bacteria on plant drought tolerance are caused by changes in hormonal content mainly that of abscisic acid, ethylen and cytokinins (Cho et al., 2008) [8] . This study is driven by the need to isolate and characterize endophytic microorganisms from P. heterophorias and P. oleracea, aiming to identify strains with plant growth-promoting capabilities. Utilizing molecular characterization techniques, this research seeks to elucidate the mechanisms through which these endophytes contribute to plant growth and stress tolerance. The identification of beneficial endophytes from these plants not only expands our understanding of plant microbe interactions but also opens up new avenues for the development of biotechnological tools to enhance crop productivity and sustainability. Through the comprehensive isolation of endophytic microorganisms from P. hysterophorus and P. oleracea, this research aims to contribute to the growing body of knowledge on endophyte mediated plant growth promotion.
Materials and Methods
Materials and Methods
Isolation of endophytes from weed plants Collection of samples
Healthy plants of Parthenium hysterophorus L. and Portulaca oleracea L. were collected from Junagadh Agricultural University, Junagadh, Gujarat. The plants were placed in polythene bags and transported to the laboratory for further processing.
Sterilization of samples
Healthy plant parts (roots, leaves, and stems) were sorted and thoroughly rinsed with sterile distilled water to eliminate dirt and debris. Following this, the surfaces were sterilized using a 2% sodium hypochlorite solution containing 0.1% Tween 20 for 10 seconds for leaves, 20 seconds for stems and 60 seconds for roots. The disinfectant was removed by rinsing the samples five times in two washes of sterile distilled water, followed by a final rinse in sterile water. The samples were then cut into pieces with a sterile knife under sterile conditions (Zinniel et al., 2002) [42] .
Inoculation of samples
After sterilization, the pieces were placed on Nutrient agar plates to isolate bacteria. The plates were then incubated at 37°C for 48 hours.
Characterization of isolates
The isolated endophytic microorganisms were phenotypically characterized based on their growth characteristics on Nutrient Agar, colony morphology and Gram reaction using standard procedures as described by Panigrahi et al. (2018) [28] and Khilari et al. (2020) [12] .
Morphological and Cultural characterization
The cultural characteristics of the different bacterial isolates were studied by observing and recording various growth parameters, including size, shape, elevation, margin, texture, opacity, consistency, surface and pigment with regard to colonial characteristics.
Microscopic characterization Gram's staining
The Gram's staining method, as described by Shugar and Baranowska in 1952 [36] , was used.
Pathogenicity test by hemolytic activity of endophytic bacterial isolates
The hemolytic activity of the bacterial isolates was assessed using the blood agar plate method, following the procedure described by Vo et al. (2023) [40] .
Antifungal activity of bacterial isolates
Antifungal activity was the tested by modified well diffusion method. Fungal cultures viz., Rhizoctonia solani, Helminthosporium oryzae, Fusarium oxysporum, Alternaria alternata, Aspergillus parasitica, Aspergillus niger and Macrophomina phaseolina were prepared and their broth inoculated onto the MHA media plates by spread plate method. 100μL of isolated endophytic bacterial culture were inoculated into 6 mm diameter well on the MHA media, then incubated for 36 hrs at 28⁰ C. Amphofericin-B, Clofrimazole, Fluconazole, Ketoconazole, Itraconazole and Nysfatin were used as positive control. Antifungal activity was evaluated by measuring the diameter of the clear zone of inhibition.
The activity index of isolates as compared to that of antibiotics were determined using the following formula:
Activity index = (ZI produced by sample/ZI produced by antibiotics)
Activity index = (ZI produced by sample/ZI produced by antibiotics)
Plant growth promoting activity of isolates IAA production
In 50 ml sugar tubes, 10 ml of glucose phosphate broth (GPB) medium was prepared, autoclaved, and cooled for this purpose. L-tryptophan was then added to the liquid medium at the required concentration after being filtersterilized using a 0.2 μm membrane filter. Next, 1 ml of three-day-old bacterial broth (10 7 CFU ml -1 ) was added to the test tubes, and they were then incubated for 48 hrs at 30±2˚C. After incubation, the contents were filtered through Whatman filter paper No. 2. For measuring IAA, 3.0 ml of filtrate was taken in test tube and 2.0 ml of Salkowski's reagent was added. The mixture was allowed to stand for half an hour for color development. Similarly, color was also developed in standard solutions of IAA. The intensity of color was measured at 530nm by spectrophotometer. A standard curve was prepared and used to calculate the IAA produced by the bacterial isolates (Patel and Patel, 2014) and Parakhia et al. (2025) [30,31] .
Phosphate solubilization capacity Qualitative phosphate solubilization test in solid medium
The qualitative phosphate solubilization test was conducted using Pikovskaya's agar medium as per standard protocol followed by Singh et al. (2021) [37] . To assess phosphate solubility, a single wire loop of bacterial culture was placed onto a Pikovskaya's agar plate containing insoluble phosphate. The inoculated plates were incubated at 32°C. The zone of solubilization was recorded at 3 days after inoculation. The Solubilization Index (SI) was determined by measuring the ratio of the total diameter (colony + halo zone) to the colony diameter asperthe formula followed by Noorjahah et al. (2019) and the Solubilization Efficiency (SE) was calculated by the formula followed by Pandey and Putatunda (2018) [27] .
Quantitative phosphate solubilization test in liquid medium
The quantitative phosphate solubilization test in liquid medium was carried out in Pikovskaya's broth medium as per standard protocol followed by Nath et al. (2012) [21] . Sugar tubes (50 ml) containing 10 ml of Pikovskaya's broth medium were inoculated with 100 μl of bacterial suspension (approx. 10 7 CFU/ml). For each isolate three test tubes were inoculated. The test tubes were incubated on rotary shaker (180 rpm) at 28˚C. Samples were taken aseptically at intervals of 3, 5, 7, and 10 days, and centrifuged at 5000x g for 10 minutes to pellet the insoluble phosphate and cell biomass. The supernatants were then used to measure pH using a pH meter to determine acidity and liberated P using the phosphomolybdic blue colour method (Jackson, 1973) [11] . After incubation, the amount of inorganic phosphorus (Pi) released in the broth was calculated from three test tubes, each compared to a set of uninoculated controls. A graph of optical density (OD) versus phosphate concentration in μg was plotted for the standard, and the samples were compared to calculate the P concentration.
Potash solubilization capacity Qualitative potash solubilization test
The qualitative test was carried out by using the spot test method on Aleksandrow agar. The inoculated plates were then incubated upside down at 30°C for 4 days. those isolates that demonstrated a clear zone around their colony. Measurements diameter of the bacterial colony as well as the zone of clearing or solubilization (halo) surrounding it. The Potash Solubilization Index (KSI) was calculated as the ratio of the total diameter (colony + halo zone) to the colony diameter, following the formula used by Noorjahah et al. (2019). The Solubilization Efficiency (SE) was calculated using the formula provided by Pandey and Putatunda (2018) [27] .
Quantitative potash solubilization test
The quantitative potash solubilization test in liquid medium was carried out using Aleksandrow broth medium, following the standard protocol by Azizah et al. (2020) [3] . Sugar tubes (50 ml) containing 10 ml of Aleksandrow broth medium were inoculated with 100 μl of bacterial suspension (approximately 10 7 CFU/ml). Three test tubes were inoculated for each isolate. The test tubes were incubated on a rotary shaker (180 rpm) at 28˚C. Samples were aseptically taken at intervals of 3, 5 and 7 days and centrifuged at 10,000 rpm for 10 minutes. The supernatant was then measured using a flame photometer.
Nitrogen fixation capacity
The nitrogen-fixing capacity of the selected endophytic bacterial isolates was assessed using Azotobacter agar medium. The ready-made Azotobacter agar medium was obtained from HiMedia Prawan and Kumar (2023) [22] . Each chosen isolate was inoculated onto the Azotobacter agar plates using a sterile wire loop. The plates were then incubated at 35±2°C for five days. Bacterial isolates that grew on the agar plates were considered positive for nitrogen fixation.
Quantitative nitrogen fixing capacity
The nitrogen content in the culture medium was determined using the micro kjeldahl digestion and distillation method (A.O.A.C., 1975) to evaluate the nitrogen fixation effect of the isolated strains. In the digestion phase, the sample is broken down using a mixture of 10 ml sulfuric acid, copper sulfate, potassium sulfate and mercuric oxide. The second phase involves distilling the sample, a process that typically takes around five minutes. Completion of digestion is indicated by the clarity of the sample solution. Finally, titration is performed with 0.05 N sulfuric acid. The nitrogen content in the nitrogen-free media, which represents the amount of nitrogen fixed by the isolates, is then calculated using the following formula:
Zinc solubilization capacity Qualitative test for zinc solubilization capacity
The zinc solubilization capacity of the selected endophytic bacterial isolates was tested qualitatively using zinc solubilizing medium agar plates. The inoculated plates were then incubated upside down at 30°C for 4 days. Bacterial isolates that demonstrated zinc solubilization by forming a clear zone around their colony growth were considered positive for zinc solubilization. The diameter of the zone of clearance or solubilization (halo) surrounding the bacterial colony, as well as the diameter of the colony, were measured after 3 days of inoculation in triplicates. The Zinc Solubilization Index (ZSI) was calculated as the ratio of the total diameter (colony + halo zone) to the colony diameter, following the formula used by Nautiyal (1999) [45] . The Solubilization Efficiency (SE) was calculated using the formula provided by Nguyen et al. (1992) [23] .
Quantitative test for zinc solubilization capacity
The quantitative zinc solubilization test in liquid medium was conducted using zinc solubilization broth medium. Sugar tubes (50 ml) containing 10 ml of zinc solubilization medium were inoculated with 100 μl of bacterial suspension (approximately 10 7 CFU/ml). Three test tubes were inoculated for each isolate. The test tubes were incubated on a rotary shaker (180 rpm) at 28°C. Samples were taken aseptically at intervals of 3, 5 and 7 days, and then centrifuged at 10,000 rpm for 10 minutes. The zinc concentration in the supernatant was measured using ICP-MS.
Screening of ACC Deaminase producing endophytes
Selected isolates were inoculated onto Luria-Bertani (LB) medium agar plates. A loopful of bacterial cells was picked from the fresh isolate culture plate and streaked onto LB agar plates, which were then incubated for 24 hours at 28 °C. Morphologically distinct colonies were subsequently screened for ACC deaminase activity on sterile minimal DF (Dworkin and Foster) salts media, where 3 mM ACC was the sole nitrogen source and 0.2% ammonium sulfate was added to the DF minimum media as a positive control. The inoculated plates were incubated at 28 °C for three days, with daily observations recorded. A clear zone around the colony indicated a positive result for ACC deaminase production by the endophytes.
Siderophore production potentiality
The plate assay was used to measure production of siderophores by endophytic bacteria. According to Bhatt (2007) [7] approach, siderophore synthesis by the isolates was detected using Chrome Azurol S blue agar medium (CAS). The process described below is comprehensive and sequential, and it is adapted from Louden et al. (2011) [15] . All the glassware was cleaned with 6 M HCl to remove any trace elements, and then rinsed with ddH2O.
Results and Discussion
Collection of weed samples Endophytic microorganism isolated from two weed plants. A total of 10 plant samples were collected as the source of Endophytic microorganism. Isolation was carried out from the different parts (Root, Stem and Leaf) of plants.
Isolation of endophytic bacteria from weed plants
Endophytic bacteria were isolated from two different weed plants by placing sterilized 1 cm sections of plant material onto freshly prepared nutrient agar plates and incubating them at 37 °C. Observations for bacterial growth were made after 24 hrs incubation. A total of 44 bacterial isolates were obtained from the two weed plants: 25 isolates from Portulaca oleracea L. and 19 isolates from Parthenium hysterophorus L. These isolates exhibiting distinct colony morphologies, were assigned specific isolate codes corresponding to the weed sample numbers they were derived from. The list of different isolates is provided in Table 1.
| Portulaca oleracea L. | — | — | — | Parthenium hysterophorus L. | — | — | — |
|---|---|---|---|---|---|---|---|
| No. of isolate obtained | Isolate | No. of isolate obtained | Isolate | No. of isolate obtained | Isolate | No. of isolate obtained | Isolate |
| 1 | PoR1 | 14 | PoL4 | 26 | PhR1 | 39 | PhL1 |
| 2 | PoR1(a) | 15 | PoL5 | 27 | PhR2 | 40 | PhL2 |
| 3 | PoR2 | 16 | PoL6 | 28 | PhR3 | 41 | PhL3 |
| 4 | PoR2(a) | 17 | PoL7 | 29 | PhR4 | 42 | PhL4 |
| 5 | PoR3 | 18 | PoL8 | 30 | PhR5 | 43 | PhL5 |
| 6 | PoR3(a) | 19 | PoL9 | 31 | PhR8 | 44 | PhL6 |
| 7 | PoR4 | 20 | PoS1 | 32 | PhR9 | ||
| 8 | PoR4(a) | 21 | PoS2 | 33 | PhR10 | ||
| 9 | PoR5 | 22 | PoS2(a) | 34 | PhS1 | ||
| 10 | PoR5(a) | 23 | PoS3 | 35 | PhS2 | ||
| 11 | PoL1 | 24 | PoS3(a) | 36 | PhS3 | ||
| 12 | PoL2 | 25 | PoS4 | 37 | PhS4 | ||
| 13 | PoL3 | 38 | PhS5 |
Table text extracted from the original PDF; superscript letters are shown inline. The original table image is below.
View original table image
Characterization of isolates
The morphological, cultural and microscopic characterization of the isolates were done according to the Panigrahi et al. (2018) [28] and Khilari et al. (2020) [12] as described below.
Morphological and cultural characterization
In vitro multiplication of bacterial isolates was conducted on nutrient agar plates, and their colonial characteristics were recorded based on size, shape, elevation, margin, texture, opacity, consistency, surface, and pigment production. After 24 hours of incubation, all 44 isolates exhibited typical colonies on the medium. The colony morphologies varied, with shapes ranging from irregular to regular, sizes from small to medium and large, and elevations from flat to raised and convex. The opacity ranged from translucent to opaque, and the surfaces were either smooth or rough, with some isolates producing pigments. The colonial pigmentation observed included light yellowish, off-white, yellowish-white, greenish-red, light bluish-green, and pure white. Most colonies displayed translucent opacity, while a few exhibited opaque opacities. These findings are consistent with those reported by Panigrahi et al. (2018) [28] and Khilari et al. (2020) [12] .
Microscopic characterization
Microscopic characterization of the isolates was performed using Gram's staining, focusing on 28 main isolates selected based on hemolytic test. The Gram's staining results revealed a variety of cell sizes and morphologies, with cells ranging from coccus to short or long rod shapes also cocci chain to rod chain, organized in singles, pairs, or bunches.
Pathogenicity activity through hemolytic test of endophytic bacterial isolates
The three types of hemolytic activity-alpha, beta, and gamma-hemolysis were identified in the endophytic isolates (Table 2). The primary difference between alpha and beta hemolysis is that alpha hemolysis partially lyses red blood cells, whereas beta hemolysis completely lyses them. Bacteria exhibiting alpha and beta hemolysis can pose a risk of causing diseases in humans and animals, necessitating careful handling and manipulation. The hemolytic activity test served as a preliminary safety assessment. Six out of forty-four isolates exhibited α hemolysis, eight isolates showed β hemolysis, and twenty-nine isolates exhibited hemolysis, indicating a negative result for hemolytic activity. 3.
| Type | No. of isolates | Name of isolates |
|---|---|---|
| α | 6 | PoL9, PoS2, PhS1, PhL2, PhL3, PhL5 |
| β | 8 | PoR1(a), PoL1, PoL7, PoS2(a), PoS3, PhS2, PhL1, PhL4 |
| | 29 | PoR1, PoR2, PoR2(a), PoR3, PoR3(a), PoR4, PoR4(a), PoR5, PoR5(a), PoL2, PoL3, PoL4, PoL5, PoL6, PoL8, PoS1, PoS3(a), PoS4, PhR1, PhR2, PhR3, PhR4, PhR5, PhR8, PhR9, PhR10, PhS3, PhS4, PhS5 |
Table text extracted from the original PDF; superscript letters are shown inline. The original table image is below.
View original table image
According to Soni and Choure (2021) [38] , the Pseudomonas aeruginosa (P4) isolate exhibited superior plant growthpromoting (PGP) attributes and antagonistic activity against F. oxysporum and M. phaseolina. The P4 isolate demonstrated the highest percentage of inhibition against M. phaseolina. According to Singh et al., (2021) [37] B18 exhibited strong activity against Sporisorium scitamineum and moderate activity against Ceratocystis paradoxa and Fusarium verticillioides. Mingma et al. (2018) [18] and found that S12-10 inhibited all tested fungi, achieving the highest inhibition rates against Fusarium moniliforme (100%), H. oryzae (81.3%), and R. solani (76.3%). Streptomyces sp. R07-04 demonstrated maximum inhibition against R. solani (100%) and effectively inhibited both H. oryzae and F. moniliforme, each at 77.5%.
Plant growth promoting activities of isolates IAA production
The results of Indole Acetic Acid (IAA) production by various isolates are presented in Table 4. The amount of IAA produced was determined using the slope equation of the linear best fit line, obtained by plotting the absorbance of IAA standards at 535 nm (Y-axis) against their varying concentrations (X-axis). The isolates displayed a variable response in terms of IAA production, which decreased over time. After 3 days of incubation, IAA production ranged from 65.883 to 109.038 μg/ml. The highest IAA production (109.038 μg/ml) was observed in isolate PoR5(a), while the lowest (65.883 μg/ml) was in PhS5. After 5 days of incubation, IAA production ranged from 29.420 to 74.000 μg/ml, with the highest production (74.000 μg/ml) in isolate PhS4 and the lowest (29.420 μg/ml) in PhS5. Following 7 days of incubation, IAA production ranged from 23.695 to 41.735 μg/ml, with isolate PoR5(a) showing the highest production (41.735 μg/ml) and PhS5 the lowest (23.695 μg/ml), as depicted in Table 4 Singh et al. (2021) [37] also reported the maximum IAA production with supplementation of L-tryptophan in the medium (432.94±7.85 μg mL-1) was found in CF1 isolate.
| Sr. No. | Isolate Name | IAA production (μgml-1)±S.E. | — | — |
|---|---|---|---|---|
| 3 DAI | 5 DAI | 7 DAI | ||
| 1 | PoR3(a) | 96.545±0.05 | 59.674±0.04 | 29.318±0.38 |
| 2 | PoR4 | 67.664±0.16 | 43.618±0.83 | 36.824±0.09 |
| 3 | PoR4(a) | 73.695±0.14 | 40.031±1.22 | 27.588±0.03 |
| 4 | PoR5 | 89.700±0.25 | 54.305±1.05 | 36.417±0.09 |
| 5 | PoR5(a) | 109.038±0.43 | 38.122±1.16 | 41.735±0.05 |
| 6 | PoL8 | 80.539±0.28 | 59.267±1.15 | 26.137±0.03 |
| 7 | PhS4 | 106.163±0.52 | 74.000±2.34 | 39.420±0.30 |
| 8 | PhS5 | 65.883±0.21 | 29.420±0.54 | 23.695±0.19 |
| 9 | Blank | 3.237±0.07 | 3.084±0.03 | 3.237±0.03 |
| S.Em. ± | 0.84 | 1.40 | 0.22 | |
| C.D. at 5% | 2.49 | 4.17 | 0.66 | |
| C.V.% | 1.89 | 5.45 | 1.32 |
Table text extracted from the original PDF; superscript letters are shown inline. The original table image is below.
View original table image
Padder et al. (2017) [26] also reported the maximum IAA production of 32.41μg ml-1 and lowest IAA production of 16.21 μg ml-1 at varying concentration of tryptophan in the medium. The results indicated that L-tryptophan from the medium was taken up at more or less constant rate and transformed into IAA (Bharucha et al., 2013) [6] . L-Tryptophan is considered as the precursor for IAA production as its addition to medium increases IAA production (Ahmad et al., 2015) [2] . IAA production increased with incubation time. Observed IAA production by OS03 increased up to 8th day of incubation after which there was a slight declination (Panigrahi et al., 2020) [29] .
Phosphate solubilization capacity Qualitative phosphate solubilization test in solid medium
The results of the qualitative phosphate solubilization capacity of isolates, presented in Table 5, reveal that seventeen out of twenty-eight isolates tested on Pikovskaya's agar media showed positive results. These isolates exhibited zones of solubilization (ZOS), while the remaining eleven isolates did not form any solubilization zones. The diameter of the dissolution halos was measured three days after inoculation, and the corresponding solubilization index and efficiency were calculated. The highest Zone of Solubilization (ZOS) and solubilization efficiency were observed in isolate PoR4(a), which exhibited a ZOS of 29 mm and a Phosphate Solubilization Efficiency (PSE) of 324.92%. This was followed by isolate PoR4, with a ZOS of 27 mm and a PSE of 296.30%. Both isolates PoR5 and PoL8 recorded a ZOS of 23 mm, with PSEs of 256.89% and 255.70%, respectively On the other hand, the lowest ZOS values were observed in isolates PhR8, PoR1, and PoR4, each with a ZOS of 6 mm, and PSEs of 44.29%, 85.71%, and 82.81%, respectively. The coefficient of variation (C.V.) percentage of the statistical calculation for PSE indicated a high level of significance, with the calculated F value exceeding the table F value at both the 1% and 5% significance levels. Therefore, observing the phosphate-solubilizing zone is only suitable for qualitative assays (Mohamed et al., 2018) [19] .
| Sr. No. | Isolate Name | ZOS on 3 DAI (mm) | — | — | Sr. No. | Isolate Name | ZOS on 3 DAI (mm) | — | — |
|---|---|---|---|---|---|---|---|---|---|
| ZOS (mm) | PSE (%) | S.I. | ZOS (mm) | PSE (%) | S.I. | ||||
| 1 | PoR1 | 6.00 | 85.71 ±6.13 | 2.86 | 12 | PoL8 | 23.00 | 255.70±5.13 | 4.56 |
| 2 | PoR2(a) | 17.00 | 166.13 ±5.80 | 3.70 | 13 | PoS1 | 27.00 | 296.30±6.05 | 5.00 |
| 3 | PoR3(a) | 19.00 | 211.70±4.82 | 4.11 | 14 | PoS3(a) | 11.00 | 99.70±4.50 | 3.00 |
| 4 | PoR4 | 6.00 | 82.81 ±5.57 | 2.86 | 15 | PhR3 | 14.00 | 151.26 ±10.43 | 3.56 |
| 5 | PoR4(a) | 29.00 | 324.92 ±5.95 | 5.25 | 16 | PhR8 | 6.00 | 44.29±4.42 | 2.43 |
| 6 | PoR5 | 23.00 | 256.89 ±4.33 | 4.56 | 17 | PhS4 | 11.00 | 91.67±3.94 | 2.92 |
| 7 | PoR5(a) | 13.00 | 145.59 ±5.32 | 3.44 | 18 | Control | 00.00 | 00.00 | 00.00 |
| 8 | PoL2 | 11.00 | 110.00 ±4.32 | 3.10 | S.Em. ± | - | 6.88 | - | |
| 9 | PoL3 | 7.00 | 71.70 ±5.26 | 2.70 | C.D. at 5% | - | 19.77 | - | |
| 10 | PoL4 | 12.00 | 133.33 ±4.79 | 3.33 | C.V.% | - | 7.62 | - | |
| 11 | PoL5 | 12.00 | 130.81 ±5.67 | 3.33 |
Table text extracted from the original PDF; superscript letters are shown inline. The original table image is below.
View original table image
Quantitative phosphate solubilization test in liquid medium:
The initial pH of the phosphate solubilization broth was adjusted to 7.0, and the change in pH was recorded at 3, 5, and 7 days after inoculation (DAI) (Table 6). As incubation time progressed, all isolates exhibited an increasing drop in pH. The most significant pH drop (3.6±0.08) was observed in the broth of isolate PhR8 at 7 DAI, followed by isolates PoR5 (a), PoL4, and PoL2 with pH drops of 4.01±0.13, 4.08±0.08, and 4.10 ±0.08, respectively. The least pH drop (4.57±0.09) was recorded forisolate PoR5. This decrease in pH indicated an increase in acidity due to the production of various organic acids by the isolates.
| Isolates Name | 3 DAI | — | 5 DAI | — | 7 DAI | — |
|---|---|---|---|---|---|---|
| pH ±SE | Pi(μg/ml) ±SE | pH ±SE | Pi(μg/ml) ±SE | pH ±SE | Pi(μg/ml) ±SE | |
| PoR1 | 4.25±0.14 | 423.75±6.55 | 4.22±0.14 | 506.93±5.22 | 4.19±0.14 | 600.00±7.50 |
| PoR3(a) | 5.67±0.19 | 490.67±7.66 | 4.30±0.14 | 505.56±6.37 | 4.16±0.14 | 640.39±7.49 |
| PoR4 | 4.42±0.09 | 521.28±8.17 | 4.39±0.09 | 636.41±7.78 | 4.23±0.09 | 616.18±6.90 |
| PoR4(a) | 4.74±0.16 | 485.69±7.58 | 4.61±0.15 | 715.80±8.39 | 4.32±0.14 | 740.07±1.21 |
| PoR5 | 5.00±0.10 | 523.42±8.21 | 4.89±0.10 | 590.13±7.21 | 4.57±0.09 | 639.93±7.64 |
| PoR5(a) | 4.42±0.15 | 442.97±6.87 | 4.27±0.14 | 666.66±6.70 | 4.01±0.13 | 711.11±8.68 |
| PoL2 | 4.40±0.09 | 457.21±7.11 | 4.26±0.09 | 505.09±6.20 | 4.10±0.08 | 607.02±8.10 |
| PoL3 | 4.48±0.15 | 294.90±4.41 | 4.24±0.14 | 440.97±5.76 | 4.12±0.14 | 556.73±8.14 |
| PoL4 | 4.45±0.09 | 321.95±4.86 | 4.38±0.09 | 434.36±5.01 | 4.08±0.08 | 495.43±7.65 |
| PoL5 | 4.84±0.16 | 385.31±5.91 | 4.68±0.15 | 469.12±5.16 | 4.32±0.14 | 606.06±7.51 |
| PoL8 | 4.98±0.10 | 545.49±8.57 | 4.76±0.10 | 583.03±5.65 | 4.43±0.09 | 612.23±8.00 |
| PoS1 | 4.80±0.16 | 469.31±7.31 | 4.65±0.15 | 570.35±5.58 | 4.38±0.14 | 677.93±6.79 |
Table text extracted from the original PDF; superscript letters are shown inline. The original table image is below.
View original table image
The inorganic phosphorus (Pi) released by the isolates from the tricalcium phosphate (TCP) broth during 3, 5, and 7 DAI was determined using the slope equation of the linear best fit line. This line was obtained by plotting the absorbance of KH 2 PO 4 standards at 610 nm on the Y-axis against their varying concentrations on the X-axis, as shown in Fig. 1. The data presented in Table 6 indicates that the amount of inorganic phosphorus (Pi) released from tricalcium phosphate (TCP) by the isolates increased with incubation time for all isolates. At 3 days after inoculation (DAI), the highest Pi release (545.49±8.57 μg/ml) was observed in isolate PoL8, followed by 523.42±8.21 μg/ml in isolate PoR5 and 521.28±8.17 μg/ml in isolate PoR4. The lowest Pi release (292.05±4.36 μg/ml) was recorded in isolate PoS4. At 5 DAI, isolate PoR4(a) showed the maximum Pi release (715.80±8.39 μg/ml), followed by 666.66±6.70 μg/ml in isolate PoR5(a) and 636.41±7.78 μg/ml in isolate PoR4. The lowest Pi release (365.08±4.52 μg/ml) was again recorded in isolate PoS4. By 7 DAI, isolate PoR4(a) still exhibited the highest Pi release (740.07±1.21 μg/ml), followed by 711.11±8.68 μg/ml in isolate PoR5(a) and 677.93±6.79 μg/ml in isolate PoS1. The lowest Pi release (501.04±7.06 μg/ml) was noted in isolate PhR3. Singh et al. (2021) [37] documented that isolates BB2 and ACCR21 exhibited a phosphate solubilization index (PSI) of ≥3, indicating robust phosphate solubilizationcapabilities. Conversely, six other isolates (AE3, AF1, CF1, EA1, EF1, and ACCR4) demonstrated PSI values ranging from 2.81 to 2.34. In a study by Pandey and Putatunda (2018) [27] , isolate D.m-1 displayed the highest phosphate solubilization efficiency (PSE) at 346%, while the remaining isolates exhibited PSE values ranging from 103% to 283% at 5 days after inoculation (DAI). The endophytic bacteria utilized in this study were observed to lower the pH of the TCP broth. A significant reduction in pH coincided with the release of soluble phosphate (Pi) in the culture supernatant, indicating the production of organic acids by the isolates. This observation aligns with previous studies involving rhizobium species (Halder & Chakraborty,1993), which also noted a negative correlation between pH decrease and Pi release. Microorganisms capable of solubilizing phosphate play a crucial role in enhancing the availability of soluble phosphate, thereby promoting plant growth through improved biological nitrogen fixation (Ponmurugan & Gopi, 2006) [32] . These findings highlight phosphate solubilization as an additional benefit of endophytic bacterial isolates, suggesting their potential practical application in field settings to enhance phosphorous availability in the crop rhizosphere, alongside their role in nitrogen fixation.
Quantitative potash solubilization test in liquid medium
The quantitative estimation of potassium released by the isolates, as determined by the method described earlier, is presented in Table 8. The highest potassium release was observed from isolate PoR5, with values of 86 mg/L at 3 DAI, 88 mg/L at 5 DAI, and 93.10 mg/L at 7 DAI. Conversely, the lowest potassium release was from isolate PoS3(a), with values of 47.60 mg/L at 3 DAI, 48.90 mg/L at 5 DAI, and 51.40 mg/L at 7 DAI. Notably, at 7 DAI, the highest potash solubilization capacity was observed in isolate PoR3(a) was 105.00 mg/L, followed by isolate PoL5 was 102.00 mg/L. Overall, potassium solubilization capacity increased with the number of days after incubation. Potassium, a crucial macronutrient for plant growth, plays a vital role in various metabolic processes, including cell synthesis, enzyme production, and the formation of proteins, cellulose, and vitamins. Additionally, potassium enhances plant resistance to both abiotic and biotic stresses (Bashir et al., 2020) [4] . Azizah et al. (2020) [3] identified the endophytic bacteria strain AP1.3 as highly effective in solubilizing phosphate and potassium, making it a promising candidate for use as a biofertilizer.
| Sr. No. | Isolate Name | Potash solubilization capacity (ppm) | — | — | Sr. No. | Isolate Name | Potash solubilization capacity (ppm) | — | — |
|---|---|---|---|---|---|---|---|---|---|
| 3 DAI | 5 DAI | 7 DAI | 3 DAI | 5 DAI | 7 DAI | ||||
| 1 | PoR1 | 70.00 | 95.50 | 97.90 | 10 | PoL4 | 56.00 | 64.00 | 77.00 |
| 2 | PoR2(a) | 45.50 | 50.20 | 82.50 | 11 | PoL5 | 73.00 | 101.00 | 102.00 |
| 3 | PoR3(a) | 84.10 | 100.70 | 105.00 | 12 | PoL8 | 76.00 | 83.10 | 97.90 |
| 4 | PoR4 | 60.70 | 72.80 | 91.08 | 13 | PoS1 | 64.00 | 76.00 | 79.70 |
| 5 | PoR4(a) | 81.00 | 87.00 | 92.10 | 14 | PoS3(a) | 47.60 | 48.90 | 51.40 |
| 6 | PoR5 | 86.00 | 88.00 | 93.20 | 15 | PhR3 | 79.90 | 82.90 | 89.00 |
| 7 | PoR5(a) | 46.70 | 68.50 | 91.80 | 16 | PhR8 | 59.30 | 87.00 | 93.90 |
| 8 | PoL2 | 47.70 | 64.70 | 75.30 | 17 | PhS4 | 49.00 | 75.70 | 80.00 |
| 9 | PoL3 | 49.90 | 75.30 | 91.80 | 18 | Blank | 33.40 | 34.20 | 44.40 |
Table text extracted from the original PDF; superscript letters are shown inline. The original table image is below.
View original table image
Nitrogen fixation capacity Qualitative nitrogen fixation test in solid medium
The results of the nitrogen fixation capacity of isolates tested on Azatobactor agar medium as described in earlier, are presents in Table 9. Out of twenty-eight bacteria only four bacteria showed positive test result. It was measured by colony growth in Azatobactor agar plates.
| Sr. No. | Isolates Name | Nitrogen Fixation Capacity |
|---|---|---|
| 1 | PoR4(a) | +++ |
| 2 | PoR5 | +++ |
| 3 | PoR5(a) | +++ |
| 4 | PhR10 | +++ |
Table text extracted from the original PDF; superscript letters are shown inline. The original table image is below.
View original table image
Quantitative nitrogen fixation capacity in liquid medium
The nitrogen fixation capacity of the isolates ranged from 1.50 to 2.40 g/kg at 3 DAI, from 1.70 to 2.80 g/kg at 5 DAI, and from 1.90 to 3.10 g/kg at 7 DAI. The highest nitrogen fixation capacity was exhibited by isolate PoR5, with values of 2.40 g/kg at 3 DAI, 2.80 g/kg at 5 DAI, and 3.10 g/kg at 7 DAI. Conversely, the lowest nitrogen fixation capacity was shown by isolate PoR5(a), with values of 1.50 g/kg at 3 DAI, 1.70 g/kg at 5 DAI, and 1.90 g/kg at 7 DAI (Table 10). The statistical value of the calculated F was greater than that of the table F at both the 1% and 5% levels, indicating a high level of significance at both thresholds. The positive nitrogen fixation results even though in small quantity indicates the ability of the isolates to fix soil atmospheric nitrogen and make it available to the plants.
| Sr. No. | Isolate Name | Nitrogen fixation capacity (% and gkg-1) | — | — | — | — | — |
|---|---|---|---|---|---|---|---|
| 3 DAI | 5 DAI | 7 DAI | |||||
| Nitrogen fixation (%) | Nitrogen Fixation (g/kg) | Nitrogen Fixation (%) | Nitrogen Fixation (g/kg) | Nitrogen Fixation (%) | Nitrogen Fixation (g/kg) | ||
| 1 | Blank | 0.11 | 1.10±0.04 | 0.14 | 1.40 ±0.05 | 0.17 | 1.7±0.06 |
| 2 | PoR4(a) | 0.19 | 1.90±0.04 | 0.23 | 2.30 ±0.05 | 0.31 | 3.1±0.06 |
| 3 | PoR5 | 0.24 | 2.40±0.08 | 0.28 | 2.80 ±0.09 | 0.31 | 3.1±0.10 |
| 4 | PoR5(a) | 0.15 | 1.50±0.03 | 0.17 | 1.70 ±0.03 | 0.19 | 1.9±0.04 |
| 5 | PhR10 | 0.18 | 1.80±0.06 | 0.21 | 2.10 ±0.07 | 0.23 | 2.3±0.08 |
| S.Em. ± | - | 0.06 | - | 0.08 | - | 0.09 | |
| C.D. at 5% | - | 0.20 | - | 0.24 | - | 0.27 | |
| C.V.% | - | 6.36 | - | 6.34 | - | 6.19 |
Table text extracted from the original PDF; superscript letters are shown inline. The original table image is below.
View original table image
Nitrogen fixation by free living organisms is a process that needs considerable amounts of organic matter to be effective. The use of N-fixing beneficial microbes in agriculture might reduce the usage of chemical N fertilizers in agriculture, and reducing their negative environmental impacts (Noar and BrunoBárcena, 2018) [24] . Jolly et al. (2010) reported that the nitrogen-fixing potential of ten isolates of Azospirillum sp. ranged from 2 to 6.16 g N kg-1 substrate in a semisolid nitrogen-free malate medium. Similarly, Gupta et al. (2016) [9] found that the highest amount of nitrogen fixed by Azospirillum sp. ranged from 11.1 to 25.0 g N kg-1. Therefore, the nitrogen fixation results obtained from these isolates are considered negligible to very low compared to those of free-living biological nitrogen fixers.
Zinc solubilization capacity
The results of zinc solubilization Capacity (ZSB) for the isolates, determined by the method described in earlier, are presented in Table 11. Out of twenty-eight isolates, sixteen demonstrated positive zinc solubilization capacity in zinc solubilizing medium. The isolate PoL8 exhibited the highest Zone of Solubilization (ZOS) with 17 mm. and highest Zinc Solubilization Efficiency (ZSE) of 183.07% at 3 days after inoculation (DAI) followed by isolates PoR5, PoR4(a) and PoS1 exhibited the zone of solubilization (ZOS) with 12 mm, 11mm and 12mm and Zink solubilization efficiency (ZSE) of 136.64%, 132.00% and 131.69% respectively at 3 DAI. The lowest solubilization was shown by isolate PhS4 with a ZOS of 2 mm and a ZSE of 24.51%, followed by isolates PoL5 and PhR3, which had ZOS values of 2 mm and 3 mm and ZSE values of 26.19% and 34.45%, respectively. The coefficient of variation (C.V.) percentage of the statistical calculation for ZSE indicated a high level of significance, with the calculated F value exceeding the table F value at both the 1% and 5% significance levels.
| Sr. No . | Isolate Name | ZOS on3 DAI (mm) | — | — | Sr. No. | Isolate Name | ZOS on3 DAI (mm) | — | — |
|---|---|---|---|---|---|---|---|---|---|
| ZOS (mm) | ZSE % | S.I. | ZOS (mm) | ZSE % | S.I. | ||||
| 1 | PoR1 | 4.00 | 71.97±3.34 | 2.67 | 11 | PoL8 | 17.00 | 183.07±1.27 | 3.70 |
| 2 | PoR2(a) | 13.00 | 127.15±4.91 | 3.08 | 12 | PoS1 | 12.00 | 131.69±2.41 | 3.20 |
| 3 | PoR4 | 4.00 | 65.08±3.43 | 2.57 | 13 | PhR3 | 3.00 | 34.45±4.47 | 2.33 |
| 4 | PoR4(a) | 11.00 | 132.00±6.64 | 3.22 | 14 | PhR8 | 3.00 | 47.62±3.83 | 2.43 |
| 5 | PoR5 | 12.00 | 136.64±3.44 | 3.33 | 15 | PhS4 | 2.00 | 24.51±0.99 | 2.22 |
| 6 | PoR5(a) | 11.00 | 131.02±6.34 | 3.22 | 16 | PhS5 | 4.00 | 49.58±2.33 | 2.50 |
| 7 | PoL2 | 4.00 | 39.39±1.23 | 2.44 | S.Em. ± | - | 5.50 | - | |
| 8 | PoL3 | 6.00 | 70.43±7.06 | 2.67 | C.D. at 5% | - | 15.84 | - | |
| 9 | PoL4 | 5.00 | 65.28±7.94 | 2.63 | C.V.% | - | 11.40 | - | |
| 10 | PoL5 | 1.00 | 26.19±4.05 | 2.14 |
Table text extracted from the original PDF; superscript letters are shown inline. The original table image is below.
View original table image
Our zinc solubilization efficiency is comparable to the results of Kumawat et al. (2021) [13] , which ranged from 223.87% to 533.15%. Zinc is an essential micronutrient for growth and biological nitrogen fixation in legumes. Selected potential strains demonstrated the ability to solubilize ZnO and Zn3(PO4)2 on Tris minimal medium. Iron, which is abundant in its ferric (Fe+3) form in aerobic environments, occurs as hydroxides and oxy-hydroxides, making it inaccessible to both plants and rhizobacteria (Kumawat et al., 2019a) [14] . Rhizospheric microbes produce low molecular mass iron-chelating compounds, known as siderophores, which can bind to most of the iron in the rhizosphere with high affinity. This binding inhibits the proliferation of phytopathogens by limiting their access to iron. Using zinc solubilizers and siderophore producers is an environmentally friendly and sustainable alternative to agrochemicals, as it enhances the biological availability of zinc and iron to plants. This approach contributes to the growth and nutritional status of legume and cereal crops (Deka, 2020).
ACC deaminase activity
Fifteen isolates were screened for ACC deaminase activity using DF minimal medium supplemented with 1aminocyclopropane-1-carboxylate (ACC) as the sole nitrogen source (Table 12). These isolates were selected based on their plant growth-promoting rhizobacteria (PGPR) activity. Out of the fifteen isolates, nine exhibited growths on DF minimal salts medium supplemented with ACC as well as ammonium sulfate. With the exception of one isolate, all showed growth on DF minimal salts medium supplemented with ammonium sulfate. The isolates PoR3(a), PoR4(a), PoR5, PoR5(a), and PhR3 exhibited the maximum zones in the plate assay, indicating the highest ACC deaminase activity. The study by Maheshwari et al. (2020) [17] provides significant insights into ability of these isolates to grow on DF minimal medium as well as on nitrogen-free media underscores their potential for nitrogen fixation and their versatility in utilizing various nitrogen sources. This finding is crucial for understanding their role in plant growth promotion, particularly in nutrient-deficient soils. In their study, 16 isolates exhibited growth on DF minimal salts medium supplemented with ACC and ammonium sulfate, as well as on the negative control medium devoid of any nitrogen source. This robust growth in various media conditions suggests that these isolates possess multiple metabolic pathways for nitrogen assimilation. The ability to grow on the negative control medium is particularly noteworthy as it indicates the potential for nitrogen fixation, a trait valuable for promoting plant growth in nitrogen-poor environments
| Sr. No. | Isolate code | Isolate Name | Growth on DF medium supplemented with | — |
|---|---|---|---|---|
| ACC as sole N2 source | (NH4)2 SO4 (Positive control) | |||
| 1 | 1 | PoR1 | - | ++ |
| 2 | 4 | PoR2(a) | ++ | +++ |
| 3 | 6 | PoR3(a) | +++ | +++ |
| 4 | 7 | PoR4 | - | ++ |
| 5 | 8 | PoR4(a) | +++ | +++ |
| 6 | 9 | PoR5 | +++ | +++ |
| 7 | 10 | PoR5(a) | +++ | +++ |
| 8 | 12 | PoL2 | - | ++ |
| 9 | 14 | PoL4 | - | ++ |
| 10 | 18 | PoL8 | ++ | ++ |
| 11 | 20 | PoS1 | - | ++ |
| 12 | 24 | PoS3(a) | ++ | ++ |
| 13 | 28 | PhR3 | +++ | +++ |
| 14 | 37 | PhS4 | - | - |
| 15 | 38 | PhS5 | ++ | +++ |
Table text extracted from the original PDF; superscript letters are shown inline. The original table image is below.
View original table image
Siderophore production potentiality Qualitative test for siderophore production
The results of the siderophore production potential of the isolates, as determined by the CAS plate assay, are presented in Table 13. Only fifteen isolates were tested for siderophore production test based on their PGPR activity. The formation of an orange-colored zone around the bacterial colonies indicated siderophore production by the bacterial strains. It was observed that twelve out of the fifteen bacterial strains studied were positive for siderophore [16] , 14 isolates were found to be positive for siderophore production and were subsequently assessed for their plant growth-promoting capabilities. Ten bacterial isolates with significant siderophore production were selected and characterized for the type of siderophore produced. Siderophores are low molecular weight organic compounds with a high specific affinity for chelating iron. Additionally, bacterial endophytic strains isolated from aquatic weed plants showed positive results for siderophore production (Zaveri et al., 2023).
| Sr. No. | Isolates Name | Siderophore Production | Sr. No. | Isolates Name | Siderophore Production |
|---|---|---|---|---|---|
| 1 | PoR1 | ++ | 9 | PoL4 | ++ |
| 2 | PoR2(a) | ++ | 10 | PoL8 | ++ |
| 3 | PoR3(a) | - | 11 | PoS1 | ++ |
| 4 | PoR4 | ++ | 12 | PoS3(a) | - |
| 5 | PoR4(a) | ++ | 13 | PhR3 | ++ |
| 6 | PoR5 | ++ | 14 | PhS4 | ++ |
| 7 | PoR5(a) | +++ | 15 | PhS5 | ++ |
| 8 | PoL2 | - |
Table text extracted from the original PDF; superscript letters are shown inline. The original table image is below.
View original table image
Conclusion
This study aimed to isolate and characterize diverse endophytic microorganisms from two weed species Parthenium hysterophorus L. and Portulaca oleracea L., yielding 44 bacterial isolates. Each isolate exhibited unique colony morphologies, highlighting variations in size, shape, pigmentation, and other traits across different plant parts. Hemolytic activity assessment and microscopic characterization further revealed varied biological properties among the isolates, including different types and arrangements of cells. These findings highlight the rich diversity and potential applications of endophytic microorganisms in agriculture, biotechnology and microbial ecology, paving the way for future research into their ecological roles and practical uses in various fields. The isolates displayed diverse bioactive compound production and plant growth-promoting characteristics. High indole-3acetic acid (IAA) production was observed in isolate PoR5(a), while robust phosphate and potassium solubilization capacities were noted in PoR4(a) and PoL8, respectively. Significant nitrogen fixation by isolate PoR5 and strong siderophore production by PoR5(a) underscored their roles in promoting plant growth and health. Varied enzymatic activities, such as chitinase in PhS4 and protease in PoR4(a), highlighted their potential for biological control and nutrient cycling in agricultural ecosystems. These findings collectively emphasize the multifaceted potential of these isolates as sustainable tools in agricultural biotechnology and crop improvement strategies. These findings underscore the potential of these bacterial strains, particularly P. aeruginosa, in sustainable agriculture by improving crop growth, vigor, and disease resistance, advocating their application as bio-inoculants for enhanced agricultural productivity and plant health management. At last, I concluded that Pseudomonas aeruginosa isolates PoR4(a), PoR5, and PoR5(a) exhibit superior PGPR activities and significant plant growth promotion effects. Further research focusing on their secondary metabolite production and broader PGP effects across various plants is recommended. Continued investigation into its secondary metabolites and PGPR activities will enhance its applicability in sustainable agriculture.
Figures and tables from the paper
| — | — | ZI(mm) of Isolates | — | — | — | — | — | — |
|---|---|---|---|---|---|---|---|---|
| Sr. No. | Isolate Code | A. parasitica | F. oxysporum | H. oryzae | R. solani | A. alternata | A. niger | M. phaseolina |
| 1 | PoR1 | 25 | - | - | - | 12 | 32 | - |
| 2 | PoR2(a) | 21 | 11 | 30 | 13 | 14 | 32 | 14 |
| 3 | PoR3(a) | 20 | - | 14 | - | 14 | 23 | 12 |
| 4 | PoR4 | 15 | 13 | - | 13 | 19 | 21 | - |
| 5 | PoR4(a) | 20 | 21 | 24 | 25 | 24 | 19 | 31 |
| 6 | PoR5 | 23 | 22 | 28 | 26 | 23 | 18 | 24 |
| 7 | PoR5(a) | 25 | 23 | 22 | 25 | 23 | 18 | 27 |
| 8 | PoL2 | 20 | - | - | 11 | 11 | 18 | 35 |
| 9 | PoL3 | - | 12 | - | - | 20 | 20 | - |
| 10 | PoL4 | - | 12 | 20 | - | 11 | 22 | - |
| 11 | PoL5 | 12 | 11 | - | - | 17 | 14 | - |
| 12 | PoL8 | 24 | - | - | - | 35 | 33 | - |
| 13 | PoS1 | 21 | 15 | 13 | 12 | 13 | 31 | 17 |
| 14 | PoS3(a) | 18 | 18 | - | 11 | 16 | 21 | 28 |
| 15 | PhR3 | 32 | - | 20 | 14 | 17 | 36 | 35 |
| 16 | PhR8 | 21 | - | - | - | - | 13 | 18 |
| 17 | PhR10 | 16 | - | 25 | - | - | 23 | 13 |
| 18 | PhS4 | 24 | - | - | - | 11 | 13 | 18 |
| 19 | PhS5 | 28 | - | - | 30 | 30 | 35 | 36 |
Table text extracted from the original PDF; superscript letters are shown inline. The original table image is below.
View original table image
| Sr. No. | Isolate Name | ZOS at 3 DAI (mm) | — | — | Sr. No. | Isolate Name | ZOS at 3 DAI (mm) | — | — |
|---|---|---|---|---|---|---|---|---|---|
| ZOS | PSE % | S.I. | ZOS | PSE % | S.I. | ||||
| 1 | PoR1 | 21.00 | 333.33 ±6.85 | 4.33 | 11 | PoL5 | 29.00 | 422.22 ±8.68 | 5.22 |
| 2 | PoR2(a) | 37.00 | 561.04 ±6.95 | 6.63 | 12 | PoL8 | 46.00 | 610.74 ±5.50 | 7.11 |
| 3 | PoR3(a) | 29.00 | 462.50 ±9.50 | 5.63 | 13 | PoS1 | 38.00 | 641.19 ±7.94 | 7.43 |
| 4 | PoR4 | 20.00 | 320.56 ±6.45 | 4.22 | 14 | PoS3(a) | 9.00 | 200.00 ±4.11 | 3.00 |
| 5 | PoR4(a) | 32.00 | 543.90 ±6.79 | 6.57 | 15 | PhR3 | 2.00 | 141.11 ±11.79 | 2.33 |
| 6 | PoR5 | 33.00 | 570.48 ±7.42 | 6.71 | 16 | PhR8 | 27.00 | 400.00 ±8.22 | 5.00 |
| 7 | PoR5(a) | 42.00 | 620.83 ±6.80 | 7.25 | 17 | PhS4 | 9.00 | 218.17 ±12.66 | 3.13 |
| 8 | PoL2 | 26.00 | 471.48 ±6.70 | 5.71 | S.Em. ± | - | 9.70 | - | |
| 9 | PoL3 | 19.00 | 337.50 ±6.93 | 4.38 | C.D. at 5% | - | 27.89 | - | |
| 10 | PoL4 | 27.00 | 433.13 ±6.89 | 5.38 | C.V.% | - | 9.92 | - |
Table text extracted from the original PDF; superscript letters are shown inline. The original table image is below.
View original table image
References
44 in the original paper- AOAC Association of Official Analytical Chemists. Official methods of analysis of the Association of Official Analytical Chemists. Washington, DC: AOAC; 1975.
- Ahmad P, Sarwat M, Bhat NA, Wani MR, Kazi AG, Tran LS. Alleviation of cadmium toxicity in Brassica juncea L. (Czern. & Coss.) by calcium application involves various physiological and biochemical strategies. PLoS One. 2015;10(1): e0116037.
- Azizah H, Rahajeng SM, Jatmiko YD. Isolation and screening of phosphate-and potassium-solubilizing endophytic bacteria in maize (Zea mays L.). J Exp Life Sci. 2020;10(3):165-170.
- Bashir Z, Zargar MY, Husain M, Mohiddin FA, Kousar S, Ahmad A, Rathore JP. Potassium-solubilizing microorganisms: mechanism and diversity. Int J Pure Appl Biosci. 2020;5(5):653-660.
- Bell CR, Dickie GA, Harvey WLG, Chan JWYF. Endophytic bacteria in grapevine. Can J Microbiol. 1995;41(1):46-53.
- Bharucha U, Patel K, Trivedi UB. Optimization of indole acetic acid production by Pseudomonas putida UB1 and its effect as plant growth-promoting rhizobacteria on mustard (Brassica nigra). Agric Res. 2013;2(3):215-221.
- Anand (Gujarat): Anand Agricultural University; 2007.
- Cho SM, Kang BR, Han SH, Anderson AJ, Park JY, Lee YH, Cho BH, Yang KY, Ryu CM, Kim YC. 2R,3R-Butanediol, a bacterial volatile produced by Pseudomonas chlororaphis O6, is involved in induction of systemic tolerance to drought in Arabidopsis thaliana. Mol Plant Microbe Interact. 2008;21(8):10671075.
- Gupta DG, Pandya HA, Mistry SJ, Patel AR, Shelat HN, Vyas RV. Isolation of Azospirillum and compatibility testing with micronutrients, PGPR activity and efficacy on tomato. Int Q J Life Sci. 2016;11(2):891-896.
- Halder AK, Chakrabartty PK. Solubilization of inorganic phosphate by Rhizobium. Folia Microbiol (Praha). 1993; 38:325-330.
- Jackson ML. Soil chemical analysis. New Delhi: Prentice-Hall of India; 1973.
- Khilari PB, Karale V, Ingole D. Isolation and characterization of endophytes from Justicia adhatoda as a source of novel antibiotics. Int Adv Res J Sci Eng Technol. 2020;7(2):18-23.
- Kumawat KC, Sharma P, Nagpal S, Gupta RK, Sirari A, Nair RM, Singh S. Dual microbial inoculation, a game changer? -bacterial biostimulants with multifunctional growth-promoting traits to mitigate salinity stress in spring mungbean. Front Microbiol. 2021; 11:600576.
- Louden BC, Haarmann D, Lynne AM. Use of blue agar CAS assay for siderophore detection. J Microbiol Biol Educ. 2011;12(1):51-53.
- Maheshwari R, Bhutani N, Suneja P. Screening and characterization of siderophore-producing endophytic bacteria from Cicer arietinum and Pisum sativum plants. J Appl Biol Biotechnol. 2019;7(5):7-14.
- Maheshwari R, Bhutani N, Suneja P. Isolation and characterization of ACC deaminase producing endophytic Bacillus mojavensis PRN2 from Pisum sativum. Iran J Biotechnol. 2020;18(2): e2308.
- Mingma R, Duangmal K, Mai Sci CJ. Characterization, antifungal activity and plant growth-promoting potential of endophytic actinomycetes isolated from rice (Oryza sativa L.). Chiang Mai J Sci. 2018;45(7):2652-2665.
- Mohamed EA, Farag AG, Youssef SA. Phosphate solubilization by Bacillus subtilis and Serratia marcescens isolated from tomato plant rhizosphere. J Environ Prot. 2018;9(3):266-?? [Note: single page? If only page 266, retained; otherwise, if it is only "266"- that's fine.]
- Khan WA, Gurjar OP. Parthenium hysterophorus (congress grass): an unwanted plant and its uses. South Asian J Agric Sci. 2023;3(1):01-07.
- Nath R, Sharma GD, Barooah M. Efficiency of tricalcium phosphate solubilization by two different endophytic Penicillium sp. isolated from tea (Camellia sinensis L.). Eur J Exp Biol. 2012;2(4):1354-1361.
- Koppula P, Kumar BK. Isolation and characterization of Azotobacter sp. for plant growth promotion and abiotic stress tolerance in Telangana's agro-climatic regions: towards sustainable development. South Asian J Agric Sci. 2023;3(1):125-132.
- Nguyen C, Yan W, Le-Tacon F, Lapeyrie F. Genetic variability of phosphate solubilizing activity by monokaryotic and dikaryotic mycelia of the ectomycorrhizal fungus Laccaria bicolor (Maire) P.D. Orton. Plant Soil. 1992; 143:193-199.
- Noar JD, Bruno-Bárcena JM. Azotobacter vinelandii: the source of 100 years of discoveries and many more to come. Microbiology. 2018; 164:421-436.
- Okafor IA, Ayalokunrin MB, Orachu LA. A review on Portulaca oleracea (purslane) plant-its nature and biomedical benefits. Int J Biomed Res. 2014;5(2):75-80.
- Padder SA, Bhat ZA, Kuldeep. Isolation and characterization of indole-3-acetic acid producing bacterial root endophytes associated with brown sarson (Brassica rapa L.). Int J Adv Sci Eng Technol. 2017;5(3):79-82.
- Pandey D, Putatunda C. Isolation and characterization of phosphate-solubilizing bacteria from the rhizosphere of potato plant. Int J Curr Microbiol Appl Sci. 2018;7(1):967-975.
- Panigrahi S, Dash D, Rath CC. Characterization of endophytic bacteria with plant growth-promoting activities isolated from six medicinal plants. J Exp Biol Agric Sci. 2018;6(5):782-791.
- Panigrahi S, Mohanty S, Rath CC. Characterization of endophytic bacteria Enterobacter cloacae MG00145 isolated from Ocimum sanctum with indole acetic acid (IAA) production and plant growth-promoting capabilities against selected crops. S Afr J Bot. 2020; 134:17-26.
- Parakhia MV, Kandoliya UK, Gajera HP, Bhalani H. Comparative analysis of the rhizospheric microbiome of groundnut (Arachis hypogaea L.) in response to dry root rot disease. J Adv Biol Biotechnol. 2025;28(6):1036-1049.
- Patel MV, Patel RK. Indole-3-acetic acid (IAA) production by endophytic bacteria isolated from saline desert, the Little Rann of Kutch. Curr Indian Biotechnol J Microbiol. 2014;3(2):2319-3867.
- Ponmurugan P, Gopi C. In vitro production of growth regulators of phosphatase activity by phosphate-solubilizing bacteria. Afr J Biotechnol. 2006;5(4):348-350.
- Priyadharsini P, Muthukumar T. The root endophytic fungus Curvularia geniculata from Parthenium hysterophorus roots improves plant growth through phosphate solubilization and phytohormone production. Fungal Ecol. 2017; 27:69-77.
- Reang L, Bhatt S, Tomar RS, Joshi K, Padhiyar S, Vyas UM, Kheni JK. Plant growth-promoting characteristics of halophilic and halotolerant bacteria isolated from coastal regions of Saurashtra, Gujarat. Sci Rep. 2020;12(1):4699.
- Romero A, Carrion G, Rico-Gray V. Fungal latent pathogens and endophytes from leaves of Parthenium hysterophorus (Asteraceae). Fungal Divers. 2001; 7:8187.
- Shugar D, Baranowska J. Studies on the Gram stain; the importance of proteins in the Gram reaction. Acta Microbiol Pol. 1952;3(1):11-20.
- Singh P, Singh RK, Guo DJ, Sharma A, Singh RN, Li DP, Li YR. Whole genome analysis of sugarcane root-associated endophyte Pseudomonas aeruginosa B18-A, a plant growth-promoting bacterium with antagonistic potential against Sporisorium scitamineum. Front Microbiol. 2021; 12:628376.
- Soni M, Choure K. Characterization of multi-trait plant growth-promoting Pseudomonas aeruginosa from chickpea (Cicer arietinum) rhizosphere. J Appl Nat Sci. 2021;13(3):1003-1010.
- Trognitz F, Hackl E, Whidhalm S, Sessitsch A. The role of plant-microbiome interactions in weed establishment International Journal of Biology Sciences https://www.biologyjournal.net and control. FEMS Microbiol Ecol. 2016;92(10): fiw138. (If 'fiw138' is the article number, acceptable; otherwise, try replacing with page range if available.)
- Vo TMD, Vo BT, Vo TX, Nguyen NN. Isolation of endophytic bacteria from Cavendish banana pseudostem (Musa acuminata) and plant growth-promoting characterization. Res J Biotechnol. 2023;18(8):8-? (If only page 8, fine; otherwise, adjust.)
- Zaveri SH, Dasgupta S, Desai P. Characterization of siderophore produced by bacterial endophytes isolated from aquatic weed plant. Indian J Sci Technol. 2023;16(14):91-101.
- Zinniel DK, Lambrecht P, Harris NB, Feng Z, Kuczmarski D, Higley P, Vidaver AK. Isolation and characterization of endophytic colonizing bacteria from agronomic crops and prairie plants. Appl Environ Microbiol. 2002;68(5):2198-2208.
- Priyadharsini P, Muthukumar T. The root endophytic fungus Curvularia geniculata from Parthenium hysterophorus roots improves plant growth through phosphate solubilization and phytohormone production. Fungal Ecol. 2017;27:69-77.
- Naeem F, Khan SH. Purslane (Portulaca oleracea L.) as phytogenic substance -a review. J Herbs Spices Med Plants. 2013;19(3):216-232.
- Nautiyal CS. An efficient microbiological growth medium for screening phosphate solubilizing microorganisms. FEMS Microbiol Lett. 1999; 170:265270.