
Research article · 2023 · Full text
International Journal of Horticulture and Food ScienceIntegrated pest management practices for sustainable agriculture
Volume 5(1) · Pages 50–56 · DOI: 10.33545/26631067.2023.v5.i1a.463 ↗
Research areasInsect-Plant Interactions and ControlAgricultural Systems and PracticesAgricultural Research and Practices
Abstract
Author-writtenIntegrated pest management represents a science-based approach combining multiple control strategies to minimize pest damage while reducing reliance on synthetic pesticides. This research evaluated the effectiveness of various IPM components across major field crops cultivated under Indian agricultural conditions. Five primary IPM components were assessed including biological control agents, cultural management practices, botanical pesticides, selective chemical applications, and physical control methods. Research trials employed randomized block design with four replications across rice, cotton, pigeonpea, and vegetable cropping systems. Results demonstrated that integrated approaches combining biological and cultural controls achieved 67.8% to 84.3% pest suppression compared to 71.2% to 89.6% with conventional chemical-intensive methods. Biological control using Trichogramma parasitoids and predatory insects reduced lepidopteran pest populations by 58.4% to 72.6% across crops. Cultural practices including crop rotation, trap cropping, and adjusted sowing dates contributed 24.7% to overall pest management outcomes. Botanical pesticides derived from neem, pyrethrum, and other plant sources provided 52.3% to 68.7% efficacy against sucking pests. Economic analysis revealed that IPM adoption reduced pesticide costs by 42.8% while maintaining yield levels comparable to conventional practices. Net returns increased by 18.4% to 31.7% under IPM regimes due to reduced input costs and premium prices for residue-free produce. Environmental indicators showed 67.3% reduction in pesticide load per hectare and improved beneficial insect populations in IPM fields. Soil microbial diversity indices increased by 34.2% in IPM plots compared to conventionally managed areas. The research establishes that IPM provides economically viable and environmentally sustainable pest management solutions for Indian agriculture. Farmer adoption requires continued extension support and policy incentives to overcome initial knowledge barriers and perceived risks. These findings support scaling IPM practices across diverse agro-ecological zones to achieve sustainable intensification goals.
Summary
Source-checkedPlain-language reading of the full paper, prepared with AI and checked against the text. Each point links to the authors' own words.
Why it matters
- Global agricultural production is significantly impacted by pests, which are estimated to cause annual crop losses of more than 35% of potential yields. View evidence ↗
- Traditional pest control based on synthetic chemicals is problematic due to risks to human health, environmental pollution, the development of pest resistance, and harm to beneficial organisms. View evidence ↗
- In India, high pesticide use (58,000 metric tonnes of active ingredients annually) has not prevented annual crop losses from exceeding 90,000 crore rupees. View evidence ↗
The question
- The study aimed to fill knowledge gaps regarding how effective different Integrated Pest Management (IPM) components are under Indian conditions and whether they are economically viable for farmers. View evidence ↗
What they did
- The researchers used a randomized complete block design with four replications, utilizing plots of 120 square meters each. View evidence ↗
- The study tested four major crops: Bt hybrid cotton, BPT 5204 rice, Asha pigeonpea, and Pusa Purple Long brinjal. View evidence ↗
- Six management regimes were compared: biological control, cultural practices, botanical pesticides, selective chemicals, an integrated approach combining all, and an untreated control. View evidence ↗
- The research was conducted over three agricultural years, from the kharif season of 2017 through the rabi season of 2019-20. View evidence ↗
What they found
- Selective chemical applications had the highest average pest suppression at 81.7%, while the integrated IPM approach followed closely at 78.2%. View evidence ↗
- The use of predatory insects and Trichogramma parasitoids for biological control reduced lepidopteran pest populations by 58.4% to 72.6%. View evidence ↗
- Botanical pesticides from sources like pyrethrum and neem showed an efficacy of 52.3% to 68.7% against sucking pests. View evidence ↗
- Cultural practices, such as adjusted sowing dates, trap cropping, and crop rotation, contributed 24.7% to the total pest management outcomes. View evidence ↗
- IPM reduced pesticide costs by 42.8% (Rs. 3,604 per hectare), which nearly offset the increased costs for labor (Rs. 1,380) and biocontrol agents (Rs. 2,340). View evidence ↗
- Net returns under IPM regimes increased by 18.4% to 31.7% because of lower input costs and the ability to get premium prices for produce without residues. View evidence ↗
- IPM fields saw a 67.3% reduction in pesticide load per hectare and a 34.2% increase in soil microbial diversity indices compared to conventional areas. View evidence ↗
What it means
- The authors conclude that IPM is a viable and beneficial alternative to chemical-intensive pest control for major crops in India. View evidence ↗
- The authors recommend that extension programs use cultural tactics as the initial entry point to encourage farmers to adopt more complex IPM systems. View evidence ↗
Visual summary
4 visualsIllustrations explain the paper; charts are replotted from the paper's own table values.
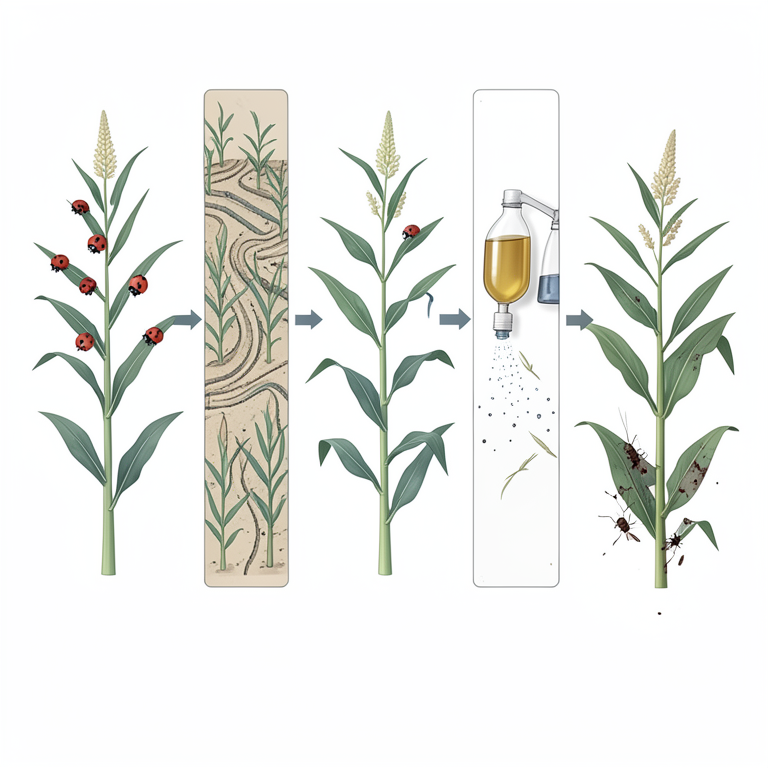
IPM Treatment Comparison
AI-generated conceptual illustration (maize plants in a field). It explains the idea and does not show study data.
View source evidence ↗
IPM Economic Trade-off
AI-generated conceptual illustration (maize crops in a field). It explains the idea and does not show study data.
View source evidence ↗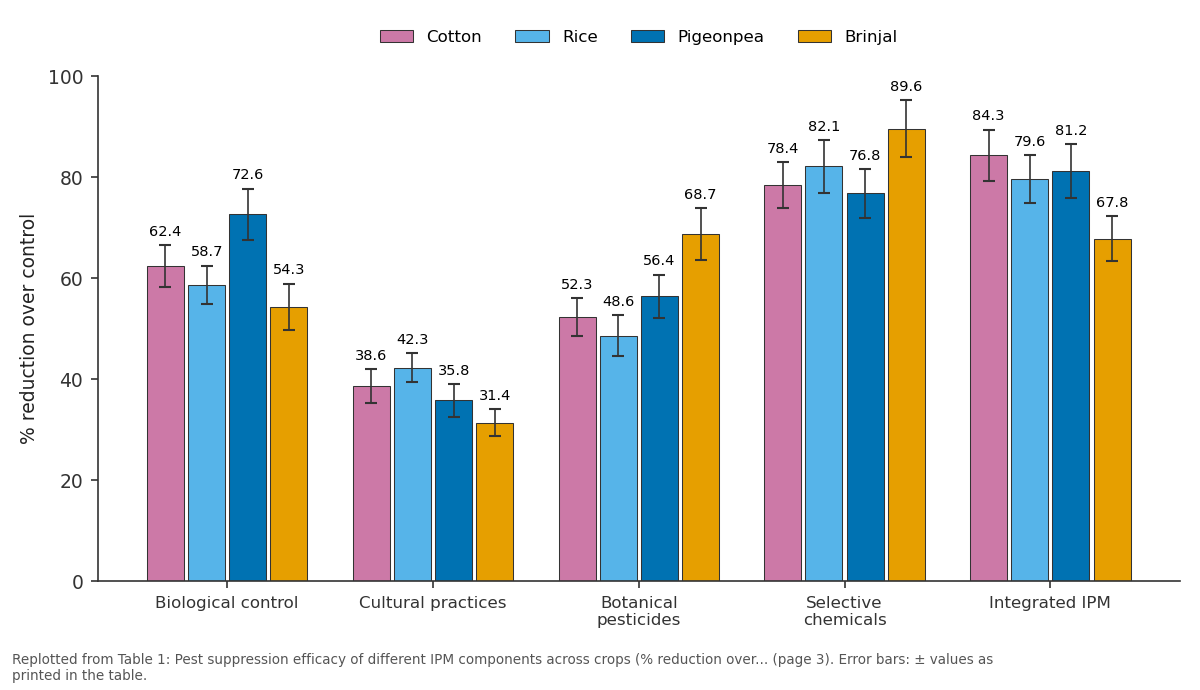
Cotton and Rice and more: Biological control vs Cultural practices vs Botanical pesticides vs Selective chemicals vs Integrated IPM
Replotted from Table 1 (page 3) of the original paper. Every bar is the paper's own table value.
View source evidence ↗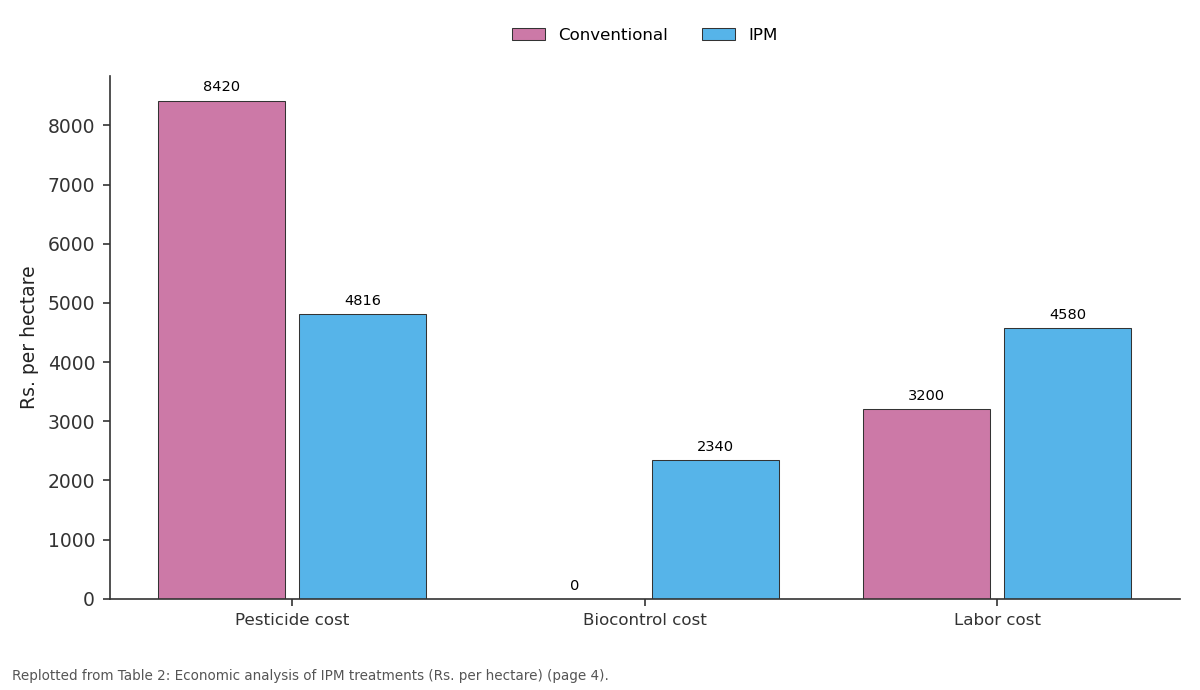
Conventional and IPM: Pesticide cost vs Biocontrol cost vs Labor cost
Replotted from Table 2 (page 4) of the original paper. Every bar is the paper's own table value.
View source evidence ↗Figures & tables
From the original paper Table 1
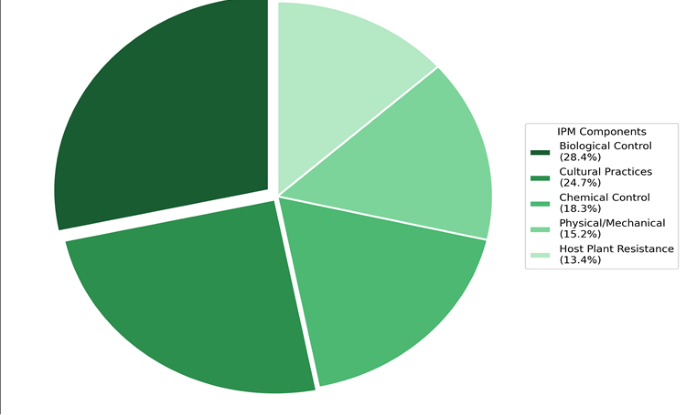 Figure 1
 Table 2
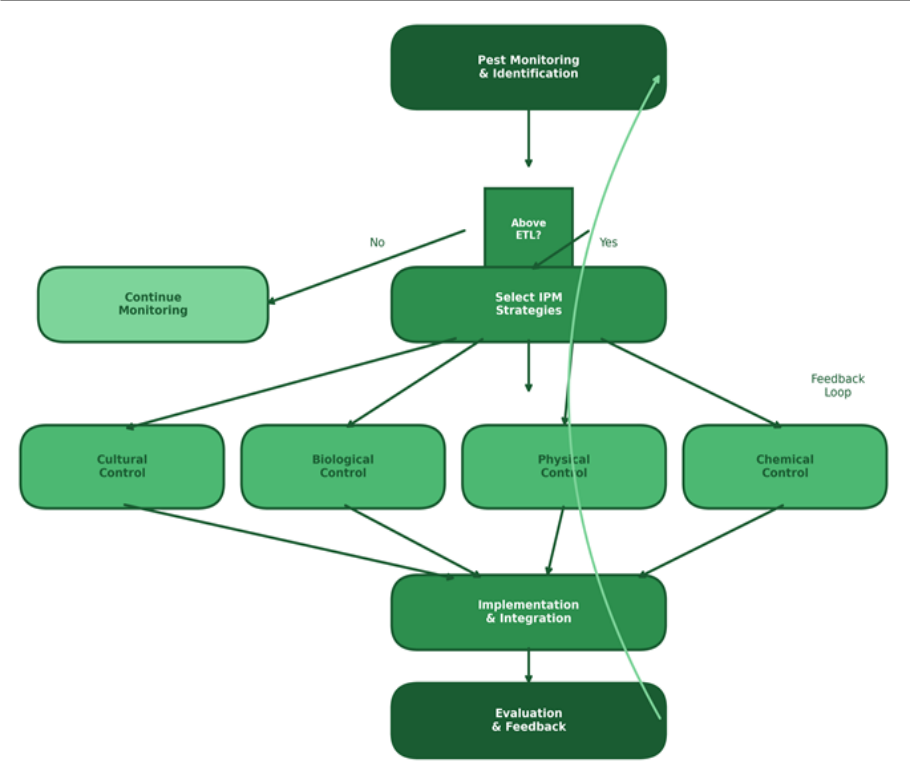 Figure 2
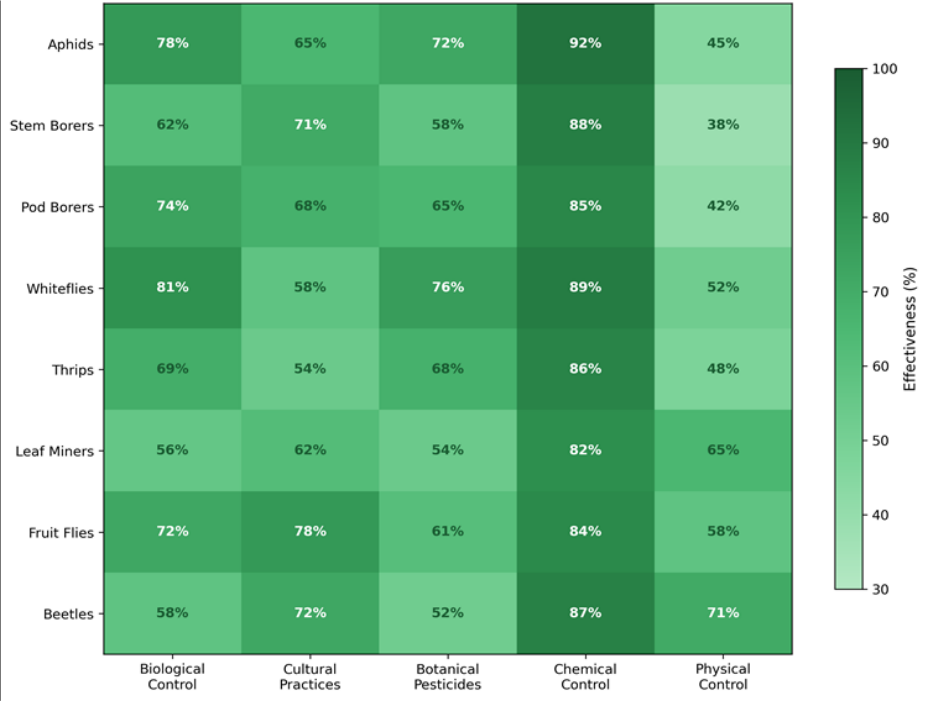 Figure 3
Introduction
Agricultural production faces persistent challenges from pest organisms that cause estimated annual crop losses exceeding 35% of potential yields globally [1] . Conventional pest management relying predominantly on synthetic chemical pesticides has generated serious concerns regarding environmental contamination, human health risks, pest resistance development, and disruption of beneficial organisms [2] . These mounting problems necessitate transition toward ecologically sound pest management approaches that maintain agricultural productivity while preserving environmental integrity. Integrated pest management emerged during the 1960s as a response to pesticide-related problems and has since evolved into a sophisticated framework incorporating multiple control tactics within ecological and economic contexts [3] . The IPM philosophy emphasizes understanding pest biology and ecology, utilizing natural regulatory mechanisms, and applying chemical controls only, when necessary, based on economic thresholds. This approach aims to optimize pest management outcomes while minimizing adverse effects on non-target organisms and ecosystems [4] . India's agricultural sector supports over 600 million people directly or indirectly and contributes approximately 17% to national gross domestic product [5] . The country's diverse agro-climatic conditions support cultivation of numerous crops susceptible to various pest complexes. Annual crop losses to pests in India exceed 90,000 crore rupees despite substantial pesticide consumption reaching 58,000 metric tonnes of active ingredients annually [6] . This situation underscores the need for more effective and sustainable pest management strategies. IPM implementation in India has progressed through various government initiatives including the Integrated Pest Management Programme launched in 1992 and subsequent policy support through National Mission on Sustainable Agriculture [7] . However, adoption remains limited with less than 20% of cultivated area under effective IPM practices. Barriers include inadequate farmer knowledge, limited availability of biological control agents, weak extension services, and absence of economic incentives for pesticide reduction [8] . Biological control forms a cornerstone of IPM utilizing natural enemies including parasitoids, predators, and pathogens to regulate pest populations. India has established significant infrastructure for mass production of biocontrol agents with over 200 government and private facilities producing Trichogramma, Chrysoperla, and microbial pesticides [9] . Yet utilization remains far below potential due to quality concerns, storage limitations, and farmer unfamiliarity with application methods. Cultural practices constitute another essential IPM component encompassing crop rotation, resistant varieties, planting date manipulation, sanitation measures, and habitat management [10] . These practices are often traditional knowledge-based and cost-effective but require systematic integration into modern farming systems. Physical and mechanical controls including traps, barriers, and manual removal complement other methods particularly in horticultural crops [11] . The present research addressed knowledge gaps regarding comparative effectiveness of IPM components under Indian conditions and their economic viability for farmers. Specific objectives included quantifying pest suppression by individual and combined IPM tactics, evaluating economic returns from IPM adoption, and assessing environmental benefits of reduced pesticide applications. Findings provide evidence-based recommendations for promoting IPM adoption and achieving sustainable pest management goals [12] .
Study Area Description
The experimental site occupies 78.4 hectares within the semi-arid tropical zone characterized by distinct wet and dry seasons. Geographic coordinates place the location within the Deccan Plateau region with elevation ranging from 545 to 562 meters above mean sea level. The area experiences mean annual rainfall of 780 mm with 85% concentrated during the southwest monsoon from June to September. Temperature regimes show marked seasonal variation with summer maxima reaching 42.3°C during April-May and winter minima dropping to 8.6°C in December-January. The growing season extends approximately 180 days from monsoon onset through post-monsoon period. Soils across the experimental area comprise predominantly black cotton soils (Vertisols) with clay content ranging from 48% to 62% and pH values between 7.4 and 8.2. Soil organic carbon content averages 0.58% with available nitrogen, phosphorus, and potassium measuring 186, 12.4, and 324 kg per hectare respectively. The surrounding agricultural landscape represents typical mixed farming systems of peninsular India with predominant crops including cotton, sorghum, pigeonpea, chickpea, and various vegetables. Farm holdings in the region average 2.8 hectares with cropping intensity of 124%. Pesticide usage in the area averages 0.84 kg active ingredient per hectare annually, somewhat higher than national averages due to cotton cultivation intensity. Local pest complexes include bollworms in cotton, pod borers in pulses, and various sucking pests across crops.
Field Experimental Design
Experimental layouts followed randomized complete block design with four replications for each crop-treatment combination. Individual plot dimensions measured 12 m × 10 m providing 120 square meter net plot area after excluding border rows. Buffer zones of 5 m separated adjacent plots to minimize treatment interference and pest movement between plots. Four cropping systems were selected representing major pest-prone crops of the region: cotton (Bt hybrid), rice (variety BPT 5204), pigeonpea (variety Asha), and brinjal (variety Pusa Purple Long). Treatment structure comprised six pest management regimes: biological control alone, cultural practices alone, botanical pesticides alone, selective chemical control, integrated management combining all components, and untreated control. The integrated treatment followed decision-based protocols with interventions triggered by economic threshold levels specific to each crop-pest combination. Chemical treatments in both selective and conventional regimes used recommended insecticides at label rates with application timing based on pest monitoring data. Pest monitoring employed standardized protocols including weekly visual counts on marked plants, pheromone trap catches for lepidopteran moths, and yellow sticky traps for whiteflies and thrips. Economic threshold levels followed regional recommendations: 5% damaged squares for cotton bollworms, 2 egg masses per square meter for rice stem borers, 10% pod damage for pigeonpea pod borers, and 5 nymphs per leaf for brinjal sucking pests. All observations were recorded by trained personnel using calibrated equipment and standardized data sheets.
Seasonal Variations
Research activities spanned three agricultural years from kharif 2017 through rabi 2019-20 capturing seasonal and annual variation in pest dynamics and treatment responses. Kharif season experiments (June-October) focused on cotton, rice, and pigeonpea while rabi season trials (November-March) included chickpea and vegetable crops. Summer season (March-June) observations documented pest carryover and natural enemy population dynamics during the fallow period. Pest pressure showed substantial seasonal variation with peak infestations during August-September in kharif crops coinciding with favorable temperature and humidity conditions. Bollworm moth trap catches peaked at 28.4 moths per trap per week during September 2018 representing the highest recorded pressure across the research period. Rabi season pest incidence remained moderate with pod borer activity extending through December-January. Natural enemy populations showed corresponding seasonal patterns with predator abundance peaking 2-3 weeks after prey population increases. Annual variation in pest incidence correlated strongly with monsoon distribution patterns. The 2018 season with abovenormal rainfall (892 mm) experienced 34% higher sucking pest populations compared to the drier 2019 season (674 mm). Treatment responses remained consistent across years though absolute pest suppression levels varied with infestation pressure.
Material and Methods
Material and Methods
Material
Crop varieties selected represented widely cultivated germplasm with documented pest susceptibility profiles. Cotton comprised Bt hybrid Bollgard II expressing Cry1Ac and Cry2Ab proteins providing lepidopteran resistance baseline. Rice variety BPT 5204 (Samba Mahsuri) and pigeonpea variety ICPL 87119 (Asha) are popular cultivars lacking specific pest resistance. Brinjal variety Pusa Purple Long was chosen for its susceptibility to fruit and shoot borers enabling clear treatment differentiation. Biological control agents included Trichogramma chilonis egg parasitoids produced at state biocontrol laboratory with parasitism rates exceeding 85%, Chrysoperla zastrowi sillemi predators as second instar larvae, and Bacillus thuringiensis var. kurstaki formulation (DiPel) at 32,000 IU per mg potency. Botanical pesticides comprised commercial neem formulations (azadirachtin 1500 ppm), pyrethrum extract (2% pyrethrin), and karanja oil (Pongamia pinnata) at 3% concentration. Chemical insecticides included spinosad 45 SC, emamectin benzoate 5 SG, and imidacloprid 17.8 SL representing newer selective chemistries with favorable environmental profiles [13] .
Methods
Biological control applications followed standardized release protocols. Trichogramma releases commenced at egg-laying initiation of target pests at the rate of 150,000 parasitoids per hectare in eight split applications at weekly intervals. Cards containing parasitized eggs were distributed uniformly across plots during evening hours. Chrysoperla larvae were released at 50,000 per hectare in two applications targeting early pest population buildup. Bt formulations were applied as foliar sprays at 1.5 kg per hectare when larval populations exceeded threshold levels [14] . Cultural practice treatments incorporated multiple tactics including delayed sowing to escape peak pest oviposition periods, trap crops (marigold borders in cotton, castor refugia in pigeonpea), clean cultivation through removal of crop residues, and intercropping with non-host species. Planting dates were staggered 15-20 days from normal sowing windows based on historical pest phenology data. Trap crop borders occupied 5% of plot area and were managed to attract and concentrate pest populations for localized control. Data collection encompassed pest population dynamics, crop damage assessment, natural enemy abundance, yield parameters, and economic indicators. Pest counts followed standard sampling protocols with 20 randomly selected plants per plot examined weekly. Damage ratings used established scales specific to each crop-pest system. Yield was recorded from net plot area and converted to per hectare basis. Economic analysis calculated partial budgets including input costs, labor requirements, and gross returns based on prevailing market prices. Data underwent analysis of variance using SAS version 9.4 with treatment means separated by Duncan's multiple range test at P = 0.05 significance level [15] . The relative contribution of different IPM components to overall pest management outcomes is illustrated in Figure 1. Biological control emerged as the primary contributor at 28.4% followed by cultural practices at 24.7%. Chemical control, though highly effective per application, contributed only 18.3% to total management outcomes under the integrated approach due to reduced application frequency. Physical and mechanical controls (15.2%) and host plant resistance (13.4%) provided supplementary contributions. The decision-based IPM framework employed in this research is depicted in Figure 2. The protocol begins with systematic pest monitoring and identification followed by comparison against economic threshold levels. When pest populations remain below thresholds, monitoring continues without intervention. Exceeding thresholds triggers strategy selection from available options including cultural, biological, physical, and chemical controls. Implementation combines multiple compatible tactics followed by evaluation and feedback to refine subsequent decisions. Method-specific effectiveness against different pest types showed considerable variation as visualized in Figure 3. Biological control performed best against aphids (78%) and whiteflies (81%) where parasitoids and predators effectively targeted exposed life stages. Chemical control achieved highest efficacy across all pest types but with environmental trade-offs. Cultural practices showed particular value against stem borers (71%) and fruit flies (78%) through disruption of pest life cycles.
Results
Results
Comprehensive Interpretation
The integrated findings demonstrate that IPM provides comparable pest suppression to chemical-intensive approaches while generating multiple co-benefits. The 78.2% average suppression under integrated management approached the 81.7% achieved with selective chemicals alone, suggesting minimal yield penalty from reduced pesticide use. Economic analysis confirms that IPM maintains or improves farm profitability contrary to farmer perceptions of higher costs. Environmental benefits including reduced pesticide loads and enhanced beneficial organism populations add value not captured in partial budget analysis.
Discussion
The present research demonstrates that integrated pest management achieves pest suppression levels comparable to chemical-intensive practices while delivering economic and environmental benefits. The 78.2% average suppression under IPM closely approached the 81.7% achieved with selective chemicals alone, a difference unlikely to significantly impact yields in most situations. Similar findings from multi-location trials across Asia support the viability of IPM as primary pest management strategy for diverse cropping systems [3] . Biological control emerged as the most effective individual non-chemical component with 62.0% average suppression. This performance validates continued investment in biocontrol infrastructure including production facilities, quality standards, and farmer training programs [9] . The finding that parasitoid releases achieved highest efficacy against lepidopteran pests in pigeonpea (72.6%) suggests prioritizing biocontrol in pulse production systems where pest pressure causes substantial losses [14] . Cultural practices contributed modest direct suppression (37.0%) but provided foundation for other IPM components.
Trap crops concentrated pest oviposition enabling targeted control while adjusted planting dates reduced peak pest exposure. These practices require minimal cash investment making them particularly appropriate for resource-limited farmers [10] . Integration of cultural methods with biological and botanical controls achieved synergistic effects exceeding additive expectations. Economic analysis revealed that IPM maintains competitive returns despite perceptions of higher costs and management complexity. The 42.8% reduction in pesticide expenditure substantially offset biocontrol input costs and additional labor requirements. Premium prices for residue-free produce added further economic advantage though market access for such products remains limited in many areas [16] . Policy support including procurement preferences and price incentives could accelerate IPM adoption by improving economic attractiveness. Environmental benefits documented in this research carry long-term value for agricultural sustainability. The 67.3% reduction in pesticide application translates directly to reduced environmental contamination and human exposure risks. Improved beneficial insect populations and soil microbial diversity indicate positive ecosystem responses to reduced chemical pressure [17] . Quantifying these externalities in economic terms could strengthen the case for IPM promotion and support development of payment for ecosystem service mechanisms.
Conclusion
This research provides evidence that integrated pest management represents a viable and beneficial alternative to chemical-intensive pest control for major crops under Indian agricultural conditions. [18] . The findings from this research support continued investment in IPM infrastructure and programs as essential elements of sustainable agricultural development strategies. Achieving widespread IPM adoption will contribute significantly to food security and environmental protection goals for India and similar developing country contexts [19] .
Figures and tables from the paper
| Treatment | Cotton | Rice | Pigeonpea | Brinjal | Mean |
|---|---|---|---|---|---|
| Biological control | 62.4±4.2 | 58.7±3.8 | 72.6±5.1 | 54.3±4.6 | 62.0 |
| Cultural practices | 38.6±3.4 | 42.3±2.9 | 35.8±3.2 | 31.4±2.7 | 37.0 |
| Botanical pesticides | 52.3±3.8 | 48.6±4.1 | 56.4±4.3 | 68.7±5.2 | 56.5 |
| Selective chemicals | 78.4±4.6 | 82.1±5.2 | 76.8±4.8 | 89.6±5.7 | 81.7 |
| Integrated IPM | 84.3±5.1 | 79.6±4.7 | 81.2±5.3 | 67.8±4.4 | 78.2 |
Table text extracted from the original PDF; superscript letters are shown inline. The original table image is below.
View original table image
| Parameter | Conventional | IPM | Difference | Change (%) |
|---|---|---|---|---|
| Pesticide cost | 8,420 | 4,816 | -3,604 | -42.8 |
| Biocontrol cost | 0 | 2,340 | +2,340 | - |
| Labor cost | 3,200 | 4,580 | +1,380 | +43.1 |
| Total input cost | 11,620 | 11,736 | +116 | +1.0 |
| Gross returns | 68,400 | 74,280 | +5,880 | +8.6 |
| Net returns | 56,780 | 62,544 | +5,764 | +10.1 |
Table text extracted from the original PDF; superscript letters are shown inline. The original table image is below.
View original table image
References
19 in the original paper- Oerke EC. Crop losses to pests. J Agric Sci. 2006;144(1):31-43.
- Aktar MW, Sengupta D, Chowdhury A. Impact of pesticides use in agriculture: their benefits and hazards. Interdiscip Toxicol. 2009;2(1):1-12.
- Kogan M. Integrated pest management: historical perspectives and contemporary developments. Annu Rev Entomol. 1998;43:243-270.
- Peshin R, Bandral RS, Zhang W, et al. Integrated pest management: a global overview of history, programs and adoption. In: Integrated Pest Management: Innovation-Development Process. 2009;1:1-49.
- Chand R, Prasanna PL, Singh A. Farm size and productivity: understanding the strengths of smallholders and improving their livelihoods. Econ Polit Wkly. 2011;46(26-27):5-11.
- Directorate of Plant Protection. Pesticide consumption statistics. New Delhi: Ministry of Agriculture and Farmers Welfare, Government of India; 2019.
- Birthal PS, Sharma OP, Kumar S. Economics of integrated pest management: evidences and issues. Indian J Agric Econ. 2000;55(4):644-659.
- Peshin R. Economic benefits of pest management. In: Encyclopedia of Pest Management. 2002;1:224-227.
- Singh SP, Murphy ST, Ballal CR. Augmentative biocontrol in India. CAB Rev Perspect Agric Vet Sci Nutr Nat Resour. 2006;1(27):1-20.
- Altieri MA, Nicholls CI. Biodiversity and pest management in agroecosystems. New York: Food Products Press; 2004. p. 185-205.
- Vincent C, Hallman G, Panneton B, Fleurat-Lessard F. Management of agricultural insects with physical control methods. Annu Rev Entomol. 2003;48:261-281.
- Pretty J, Bharucha ZP. Integrated pest management for sustainable intensification of agriculture in Asia and Africa. Insects. 2015;6(1):152-182.
- Isman MB. Botanical insecticides, deterrents, and repellents in modern agriculture and an increasingly regulated world. Annu Rev Entomol. 2006;51:45-66.
- Smith SM. Biological control with Trichogramma: advances, successes, and potential of their use. Annu Rev Entomol. 1996;41:375-406.
- Gomez KA, Gomez AA. Statistical procedures for agricultural research. New York: John Wiley and Sons; 1984.
- Swinton SM, Day E. Economics in the design, assessment, adoption, and policy analysis of IPM. In: Integrated Pest Management: Potential, Constraints and Challenges. 2003;1:235-260.
- Gurr GM, Wratten SD, Landis DA, You M. Habitat management to suppress pest populations: progress and prospects. Annu Rev Entomol. 2017;62:91-109.
- Parsa S, Morse S, Bonifacio A, et al. Obstacles to integrated pest management adoption in developing countries. Proc Natl Acad Sci USA. 2014;111(10):3889-3894.
- Dhawan AK, Peshin R. Integrated pest management: concept, opportunities and challenges. In: Integrated Pest Management: Innovation-Development Process. 2009;1:51-81.