
Research article · 2026 · Full text
International Journal of Geography Geology and EnvironmentSub-watershed prioritization using MDCM techniques based on landslide susceptibility mapping in the Pindar river watershed
Volume 8(1) · Pages 52–62 · DOI: 10.22271/27067483.2026.v8.i1a.474 ↗
Research areasLandslides and related hazardsGroundwater and Watershed AnalysisSoil erosion and sediment transport
Abstract
Author-writtenIn the present study an integrated geospatial and multi-criteria decision-making (MCDM) based on framework for landslide susceptibility assessment and sub-watershed prioritization in the Pindar River watershed in uttarakhand. Landslide susceptibility mapping was carried out using eleven thematic layers representing topographic, hydrological, geological, climatic, vegetation, and anthropogenic factors, weighted through the Analytic Hierarchy Process (AHP) and integrated using a weighted overlay approach. The watershed was delineated into 33 sub-watersheds, which were subsequently prioritized using three MCDM techniques TOPSIS, VIKOR, and PROMETHEE. The results reveal that sub-watersheds SW5, SW1, SW7, SW3, SW16, SW26, and SW30 consistently ranked as very high priority, indicating pronounced susceptibility due to steep slopes, high relative relief, intense rainfall, proximity to roads and streams, sparse vegetation, and fragile lithology. Conversely, SW32, SW20, SW11, SW15, and SW28 were identified as low-priority sub-watersheds, reflecting comparatively stable terrain conditions. Comparative evaluation using percentage change (ΔP) and intensity change (ΔI) metrics indicates that PROMETHEE outperformed TOPSIS and VIKOR, demonstrating higher sensitivity and superior discriminatory capability in differentiating sub-watershed vulnerability. Overall, the study confirms that PROMETHEE based prioritization, integrated with GIS, provides a robust decision-support tool for landslide risk mitigation and sustainable watershed management in the Himalayan region.
Summary
Source-checkedPlain-language reading of the full paper, prepared with AI and checked against the text. Each point links to the authors' own words.
Why it matters
- Landslides are a critical geo-environmental hazard in mountainous areas, especially in tectonically active and climatically sensitive regions like the Himalayas. View evidence ↗
- Slope instability in the Indian Himalayan Region has been intensified by factors such as deforestation, unplanned land-use, road network expansion, and rainfall variability. View evidence ↗
- The Pindar River basin in the Kumaon Garhwal Himalaya is highly susceptible to mass movements due to its fragile lithology, steep slopes, high relative relief, and intense monsoon rains. View evidence ↗
The question
- The study aims to develop an integrated geospatial and multi-criteria decision-making (MCDM) framework to assess landslide susceptibility and prioritize sub-watersheds in the Pindar River watershed. View evidence ↗
What they did
- The study area is the Pindar River watershed, covering approximately 1903.78 km². View evidence ↗
- Landslide susceptibility was mapped using eleven thematic layers (topographic, hydrological, geological, climatic, vegetation, and anthropogenic), which were weighted via the Analytic Hierarchy Process (AHP). View evidence ↗
- The catchment was divided into 33 sub-watersheds for the purpose of susceptibility and prioritization analysis. View evidence ↗
- Three different MCDM techniques, TOPSIS, VIKOR, and PROMETHEE, were used to prioritize the 33 sub-watersheds. View evidence ↗
What they found
- Sub-watersheds SW5, SW1, SW7, SW3, SW16, SW26, and SW30 were consistently identified as very high priority across the methods. View evidence ↗
- Sub-watersheds SW32, SW20, SW11, SW15, and SW28 were identified as low priority, indicating more stable terrain. View evidence ↗
- In terms of percentage change (ΔP), PROMETHEE had the highest average value (82.14%), followed by VIKOR (78.57%) and TOPSIS (75.00%). View evidence ↗
- PROMETHEE showed the highest average intensity change (ΔI) value of 1.21, compared to 1.18 for both TOPSIS and VIKOR. View evidence ↗
- Based on ΔP and ΔI metrics, PROMETHEE outperformed TOPSIS and VIKOR by showing superior discriminatory capability and higher sensitivity in identifying vulnerable sub-watersheds. View evidence ↗
What it means
- The authors conclude that the integrated geospatial and MCDM approach is effective for identifying critical sub-watersheds that need immediate management. View evidence ↗
- The study recommends PROMETHEE-based prioritization integrated with GIS as a robust tool for sustainable watershed management and landslide risk mitigation in the Himalayas. View evidence ↗
- The authors suggest that future research could improve spatial accuracy by using high-temporal rainfall products and higher-resolution datasets like LiDAR-derived DEMs. View evidence ↗
- The authors note that combining MCDM with machine learning models could reduce subjectivity in weighting and improve predictive performance. View evidence ↗
Visual summary
3 visualsIllustrations explain the paper; charts are replotted from the paper's own table values.
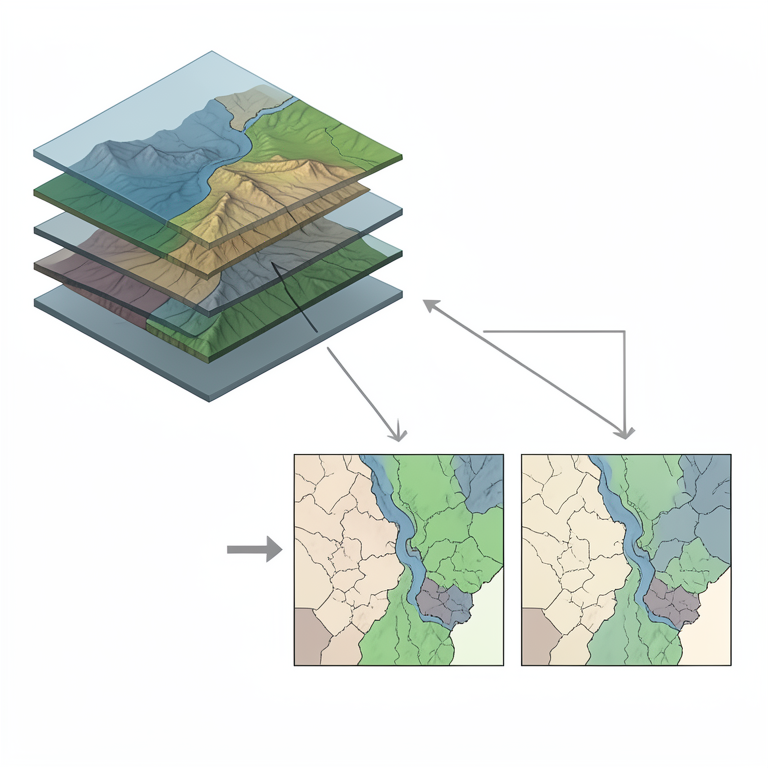
MCDM Prioritization Workflow
AI-generated conceptual illustration (Pindar river watershed landscape). It explains the idea and does not show study data.
View source evidence ↗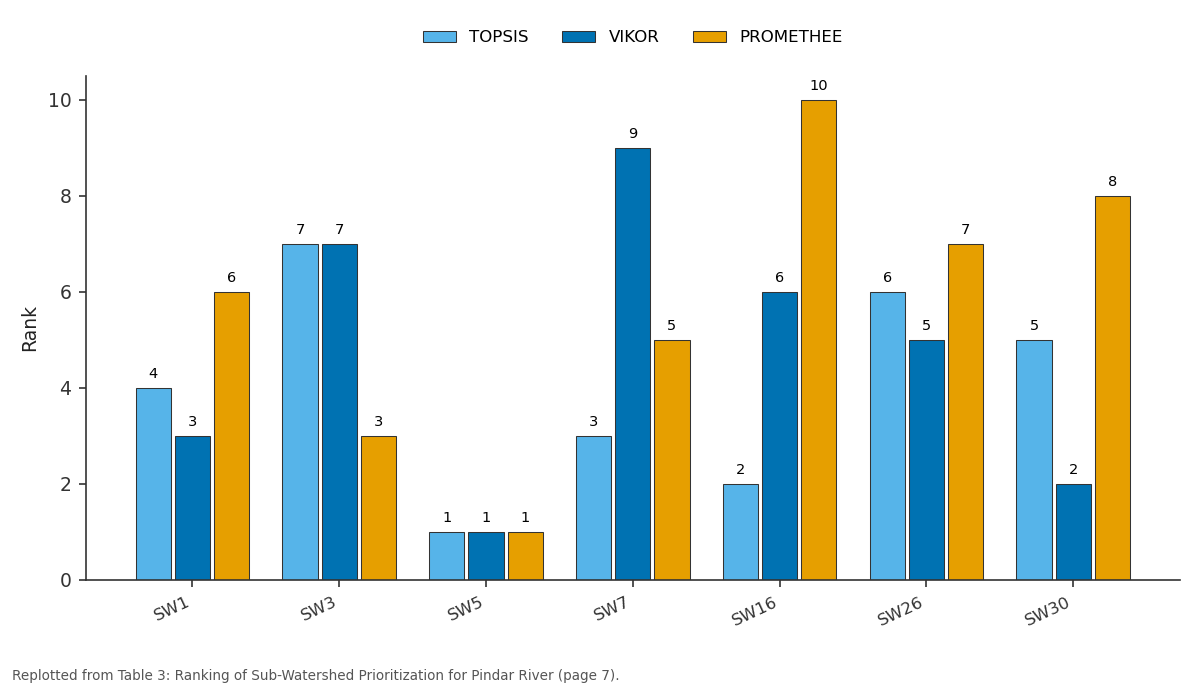
TOPSIS and VIKOR and more: SW1 vs SW3 vs SW5 vs SW7 vs SW16
Replotted from Table 3 (page 7) of the original paper. Every bar is the paper's own table value.
View source evidence ↗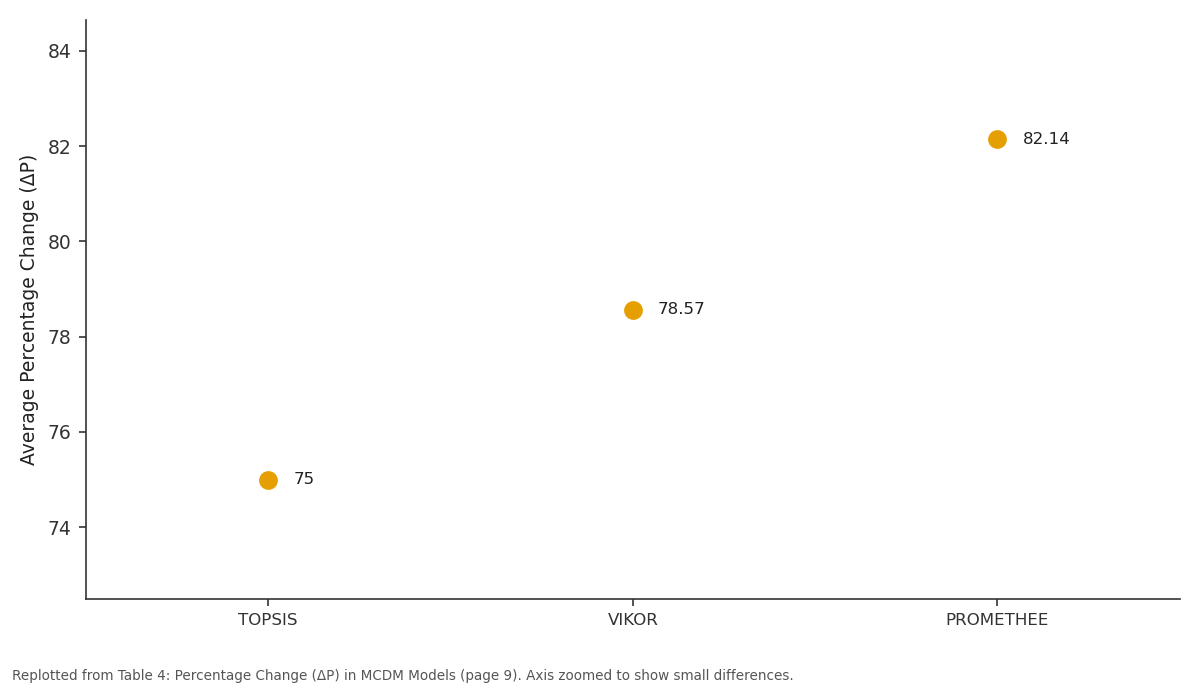
Average: TOPSIS vs VIKOR vs PROMETHEE
Replotted from Table 4 (page 9) of the original paper. Every bar is the paper's own table value.
View source evidence ↗Figures & tables
From the original paper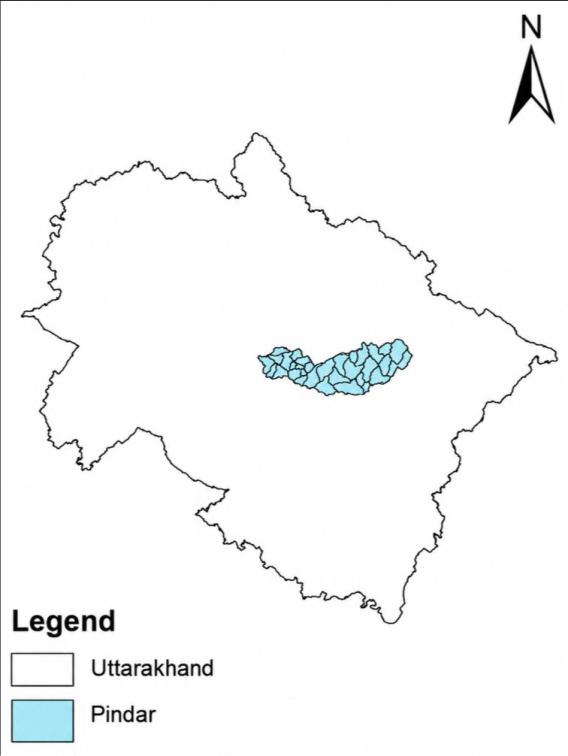 Figure 1
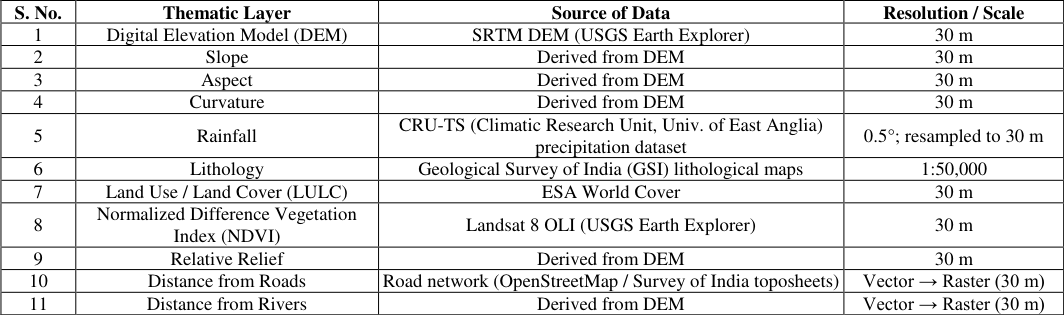 Table 1
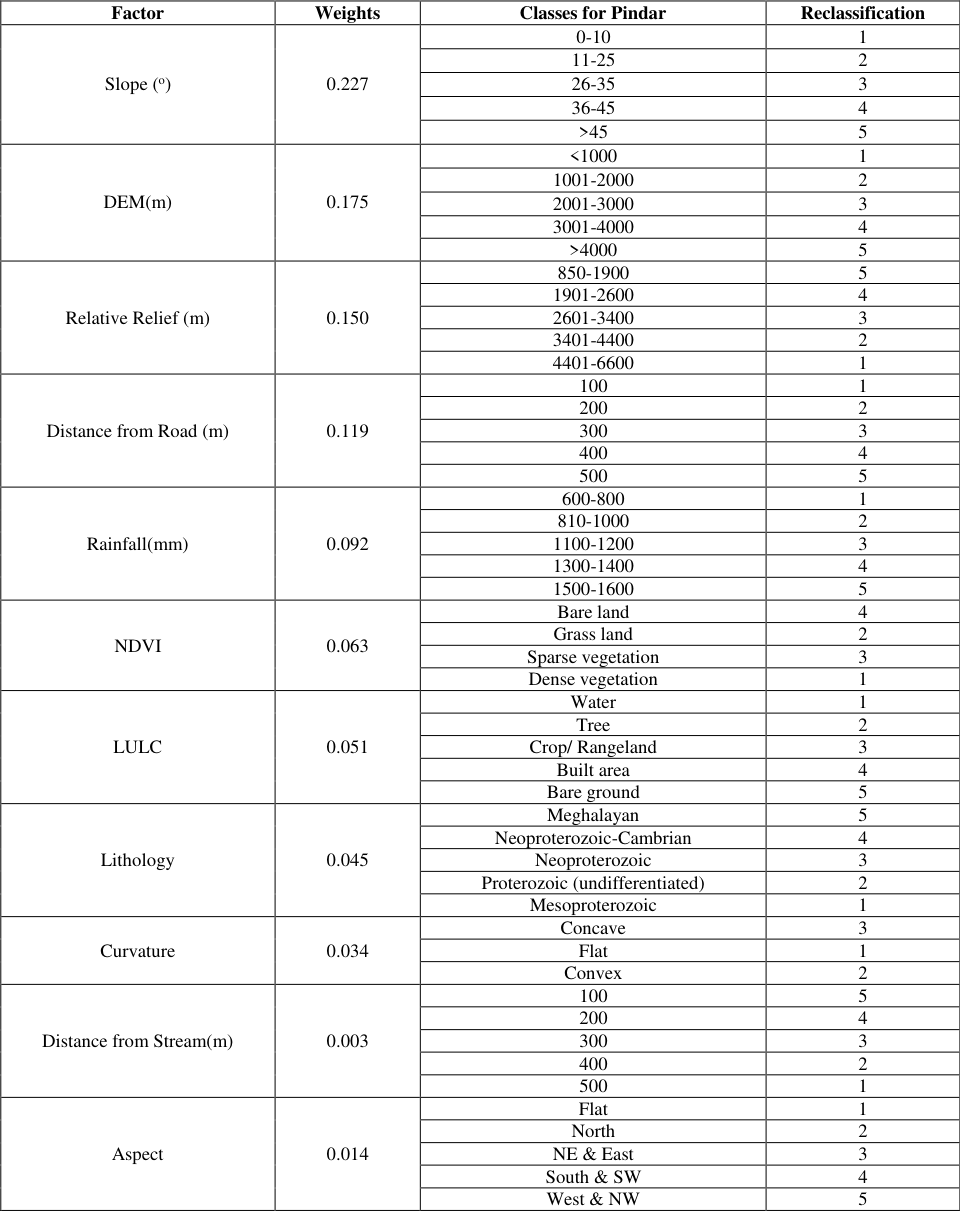 Table 2
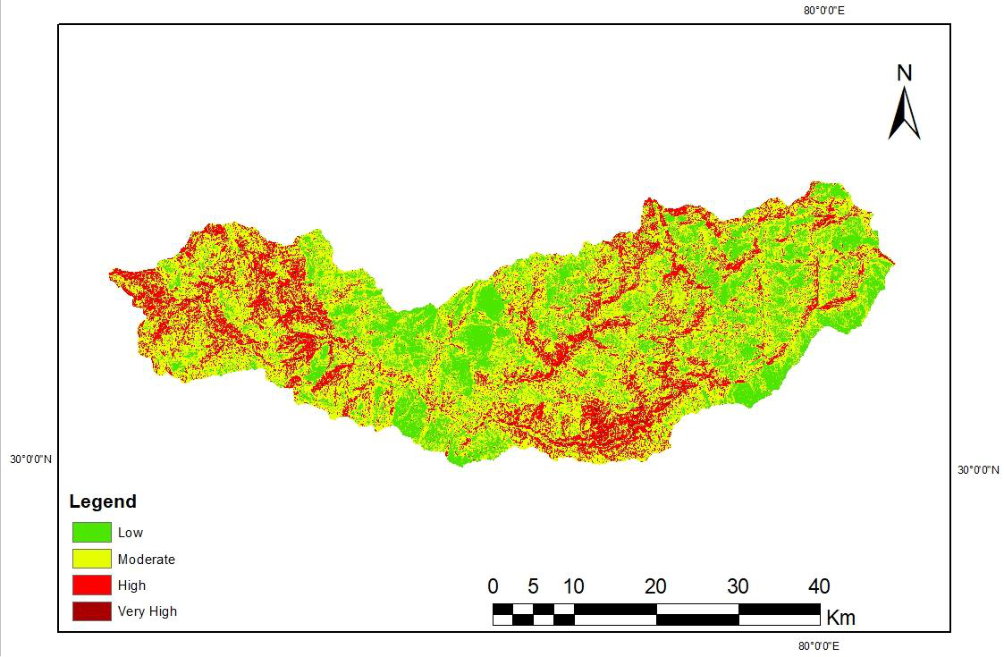 Figure 2
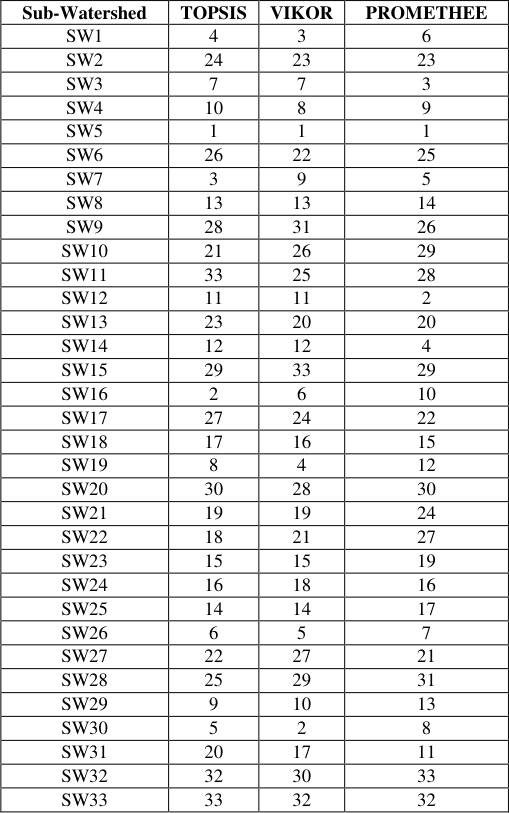 Table 3
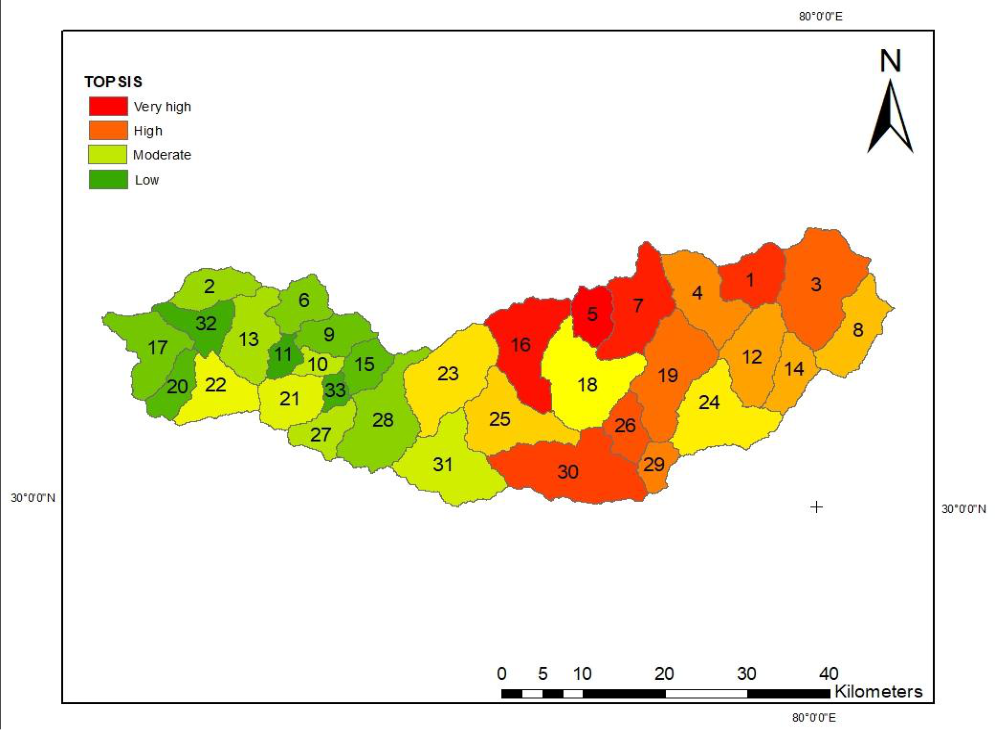 Figure 3
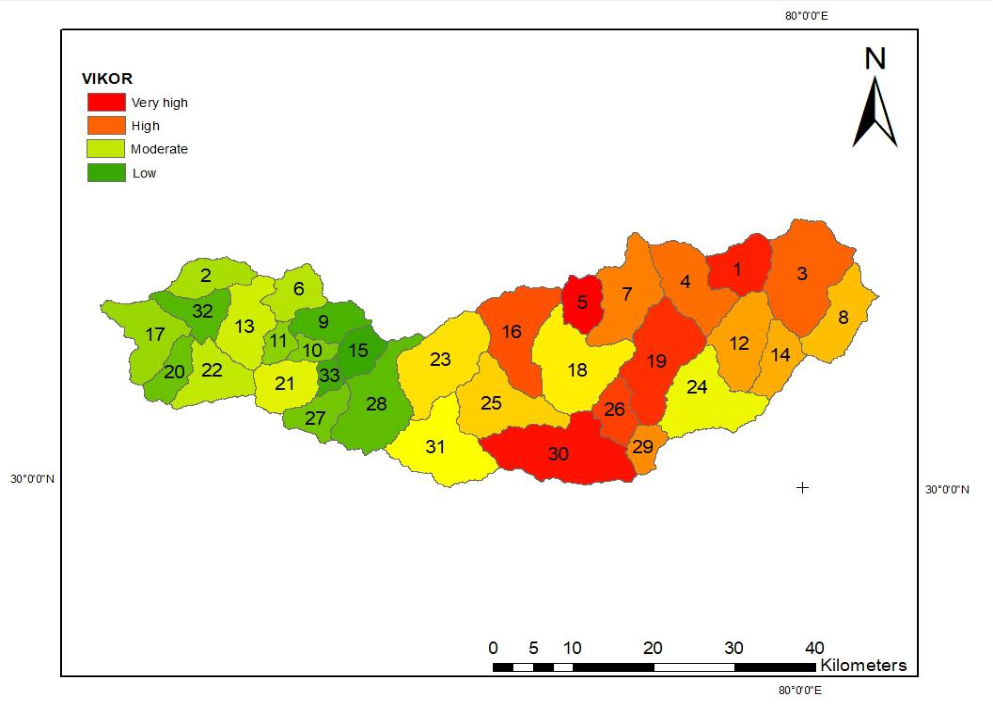 Figure 4
 Table 4
 Table 5
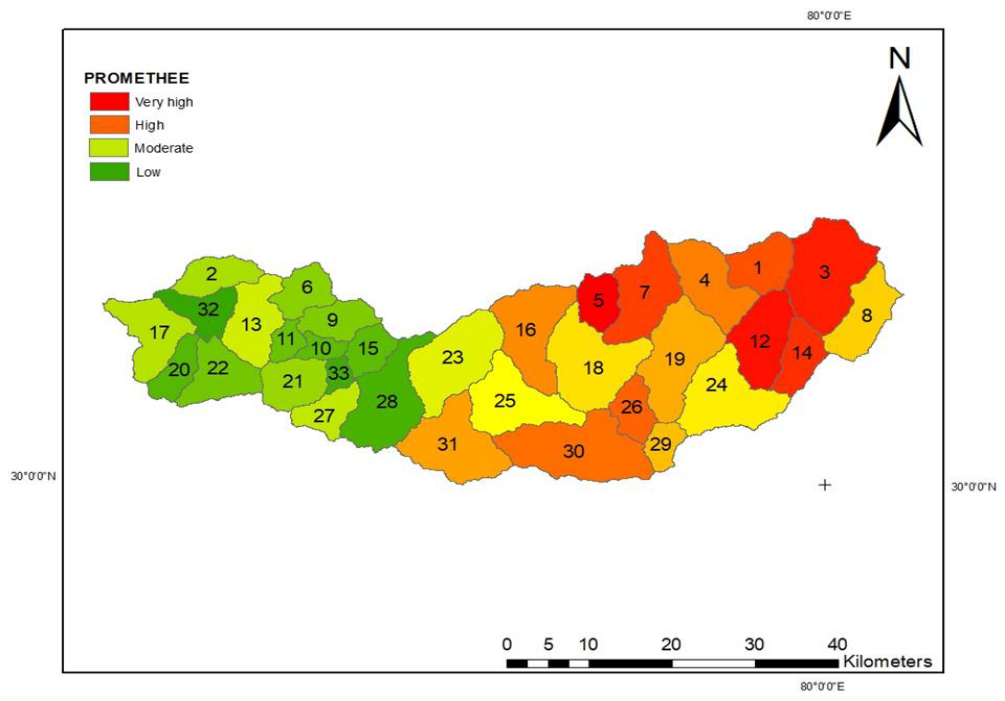 Figure 5
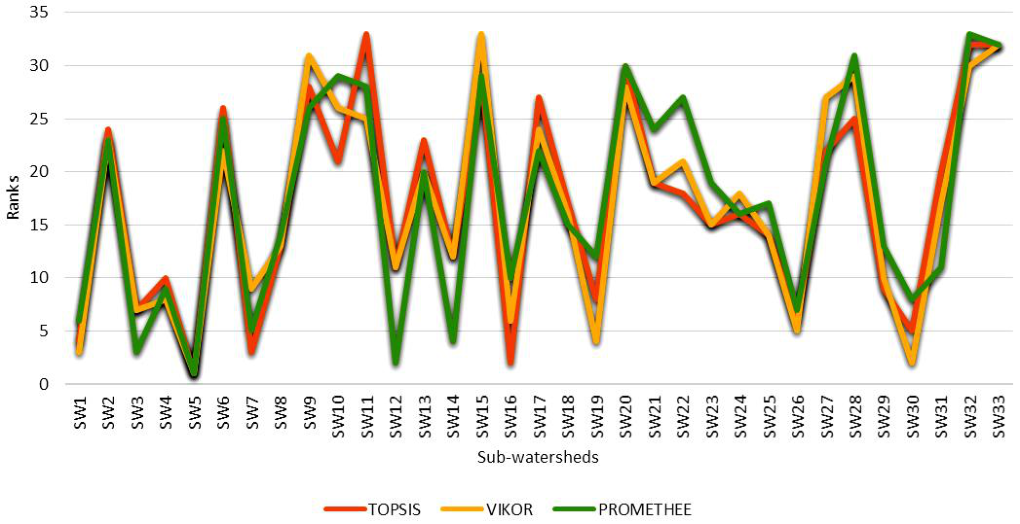 Figure 6
Introduction
Landslides represent one of the most critical geo-environmental hazards in mountainous regions, particularly within tectonically active and climatically sensitive terrains such as the Himalaya (Goswami et.al 2024) [5] . These slope failure processes arise from the combined influence of geological, geomorphological, hydrological, climatic, and anthropogenic factors, often resulting in significant damage to infrastructure, disruption of livelihoods, and environmental degradation. In the Indian Himalayan Region (IHR), increasing rainfall variability, rapid expansion of road networks, deforestation, and unplanned land-use practices have substantially intensified slope instability, highlighting the urgent need for scientific assessment and prioritization of vulnerable areas. The Kumaon Garhwal Himalaya, including the Pindar River basin, is characterized by steep slopes, high relative relief, fragile lithological formations, and intense monsoonal precipitation, making it highly susceptible to mass movement processes. The Pindar River, a major tributary of the Alaknanda River and part of the upper Ganga river system, drains a gynomorphically dynamic watershed that frequently experiences slope failures (Pawar et.al 2017) [10] . Ongoing infrastructure development and anthropogenic pressure within the basin further aggravate natural instability, underscoring the importance of sub-watershed-level analysis for effective watershed management and disaster mitigation planning. Advances in remote sensing and Geographic Information System (GIS) techniques have enabled the systematic extraction and analysis of terrain, hydrological, climatic, geological, and land-use parameters relevant to slope stability and watershed behavior.
The integration of thematic factors such as slope, elevation, relative relief, rainfall, vegetation cover, land use/land cover (LULC), lithology, curvature, aspect, and proximity to roads and drainage networks provides a comprehensive understanding of spatial variability within mountainous watersheds. However, translating this multi-dimensional information into practical prioritization outcomes requires decision-support frameworks capable of handling multiple criteria simultaneously. Multi-Criteria Decision-Making (MCDM) techniques have proven to be effective tools for prioritizing spatial units by integrating diverse and often conflicting environmental parameters in a structured and quantitative manner. Techniques such as the Technique for Order of Preference by Similarity to Ideal Solution (TOPSIS), VIKOR, and PROMETHEE are widely used in watershed and hazardrelated studies due to their ability to rank alternatives based on relative performance while reducing subjective bias. When combined with objective weighting approaches such as the Analytic Hierarchy Process (AHP), these methods provide a robust framework for comparative evaluation and prioritization of sub-watersheds. In this study, an integrated GIS-based MCDM approach is applied to the Pindar River watershed to prioritize 33 subwatersheds based on key terrain, hydrological, climatic, geological, and anthropogenic factors influencing slope instability. The prioritization outcomes derived from TOPSIS, VIKOR, and PROMETHEE techniques are further compared using quantitative indicators such as percentage change and intensity change to evaluate consistency and discriminatory capability among the models. The results of this study aim to support targeted watershed management, slope stabilization measures, and informed planning strategies in the fragile Himalayan environment.
Study Area
The Pindar River originates from the Pindari Glacier in the higher Kumaon Himalaya and is among the most dynamic catchments of the region. The watershed extends over an area of about 1903.78 km², geographically situated between 30°18′ N to 29°54′ N latitudes and 80°3′ E to 79°8′ E longitudes. Administratively, it covers large portions of the Bageshwar district in the Kumaon division and partially falls in the Chamoli district of the Garhwal division. The watershed exhibits sharp relief, rugged terrain, and varied climatic conditions, which together enhance its geomorphic sensitivity. For watershed delineation, the outlet was taken at Karnaprayag in Rudraprayag district, where the Pindar joins the Alaknanda River, forming an important confluence of the upper Ganga river system. Hydrologically, the catchment was divided into 33 sub-watersheds, providing a systematic framework for sub-watershed level landslide susceptibility and prioritization studies. In the present study a total no of 11 thematic layers were selected to generate the landslide susceptibility map, based on their established relevance in landslide related geospatial studies. Slope was considered one of the most influential parameters, as steeper slopes experience higher gravitational forces and shear stress along potential failure planes, thereby increasing instability. The Digital Elevation Model (DEM) was used to represent surface elevation and served as a fundamental input for terrain analysis, watershed characterization, and hydrological modeling. Relative relief, expressing the elevation difference between the highest and lowest points within a unit area, was employed to assess terrain ruggedness, with higher values indicating dissected and potentially unstable landscapes. Anthropogenic influence was represented through distance from roads, as road construction often involves slope cutting, excavation, and blasting, which disturb natural slope equilibrium. Rainfall was incorporated as a key triggering factor, as increased soil moisture and pore water pressure significantly reduce slope shear strength. Vegetation conditions were evaluated using the Normalized Difference Vegetation Index (NDVI), where lower values indicate sparse cover and higher susceptibility. Land use/land cover (LULC) was included to capture the stabilizing effect of vegetation and the destabilizing influence of barren and built-up areas. Lithology was considered due to variations in structural strength and weathering characteristics among geological formations. Additionally, distance from streams, aspect, and curvature were integrated to account for erosion processes, moisture retention, solar radiation effects, and surface water accumulation, all of which play critical roles in slope stability.
Prioritization of sub-watersheds using MCDM technique
The techniques used for prioritization of the Pindar river watershed are discussed as follow
TOPSIS
The Technique for Order of Preference by Similarity to Ideal Solution is a multi-criteria decision analysis method used for identifying the best alternative among a set of feasible options. This technique operates on the principle that the chosen alternative should have the shortest geometric distance from the ideal solution and the farthest geometric distance from the negative-ideal solution (Ameri et al. 2018) [1] TOPSIS is particularly valued for its efficiency and minimal reliance on subjective inputs, making it a robust choice for complex decision-making scenarios TOPSIS ranks susceptibility is based on their proximity to the ideal (least risk) and farthest from the negative-ideal (most risk) conditions. It evaluates each alternative with respect to a normalized decision matrix of landslide factors.
Steps
Normalize the decision matrix (e.g., slope, NDVI, LULC, rainfall etc.). Multiply by weights to form the weighted normalized matrix. Determine the ideal (A+) and negative-ideal (A-) solutions. Calculate the Euclidean distances:
Compute the relative closeness to the ideal:
Rank regions based on descending Ci values.
VIKOR
The VIKOR method is a robust MCDM technique designed to found compromise solutions from a set of alternatives based on conflicting criteria. Developed by Opricović, this method helps to find solution that is closest to the ideal solution, where the ideal solution is taken from the optimal values across all criteria (Ameri et al. 2018) [1] This approach is spatially useful in scenarios where decision makers need to evaluate various alternatives against multiple, often conflicting, criteria to arrive at a balanced decision.The VIKOR method is applied to landslide analysis to identify best solutions among rest alternatives (e.g., subwatersheds) based on parameters taken to make landslide susceptibility map. It helps in prioritizing regions for intervention.
Steps
Determine the best (f * ) and worst (f -) values for each landslide criterion.
Compute the utility (Si) and regret (Ri) measures:
Rank the zones or units based on Qi values. This technique is useful for compromise ranking among various landslide-prone areas.
PROMETHEE
It provides a robust framework for the prioritization of landslide prone area. These techniques is particularly useful when integrating diverse and often conflicting criteria such as hydro metrological, anthropogenic, topographic related and geological parameters to generate a comprehensive landslide susceptibility map. The Analytic Hierarchy Process, for instance, systematically evaluates multiple criteria by assigning relative weights based on their relative importance in contributing to landslides, often incorporating both objective and subjective data (Noorollahi, 2018) [9] .
Steps 1. Choose a preference function for each criterion.
Rank the areas based on net flow values.
PROMETHEE allows for both complete and partial ranking of zones vulnerable to landslides.
Comparison of MCDM models
The discrepancy in the rankings derived from each MCDM approach may be related to the methods' inherent features
Result and Discussion
The comprehensive outcomes of a geospatially driven watershed analysis for the Pindar River Basin. A total of eleven thematic layers representing key topographic, hydrological, geological, climatic, vegetation, and anthropogenic factors were considered based on their relevance and frequent application in recent geospatial and environmental studies (Arabameri et al., 2020) [3] . These thematic layers include slope, digital elevation model (DEM), relative relief, distance from roads, rainfall, normalized difference vegetation index (NDVI), land use/land cover (LULC), lithology, curvature, distance from rivers, and aspect. Each layer was systematically derived, processed, and standardized to ensure spatial consistency and analytical reliability. The relative importance of these factors was determined using the Analytic Hierarchy Process (AHP), a well-established weighting technique widely applied in environmental and watershed-related studies (Mandal & Mandal, 2021; Kaur et al.) [7] . The weighted integration of thematic layers was carried out using the Weighted Overlay Method (WOM) to generate landslide susceptibly map. To further enhance decision-oriented outcomes, subwatershed prioritization was performed within the Pindar River Basin, which comprises 33 sub-watersheds. The primary objective was to identify critical sub-watersheds requiring immediate attention for sustainable watershed management, infrastructure planning, and disaster preparedness. For this purpose, advanced Multi-Criteria Decision-Making (MCDM) techniques, namely TOPSIS, VIKOR, and PROMETHEE, were applied. These methods integrate multiple thematic criteria to enable a comparative and objective evaluation of sub-watershed conditions (Saha et al., 2021) [7] .
Each method generated a performance score for the sub-watersheds, reflecting their relative vulnerability to landslides. Sub-watersheds with steep slopes, high DEM and relative relief, Distance from roads and streams, high rainfall, low NDVI, unstable LULC, weak lithology, concave or convex curvature, and moistureretaining aspects consistently ranked as high priority across all three methods, indicating elevated landslide susceptibility. Conversely, sub-watershed with gentle slopes, lower DEM and relief, greater distance from roads and streams, lower rainfall, dense vegetation, stable LULC and lithology, and flat terrain were classified as low priority, reflecting more stable conditions. The integration of these MCDM techniques provided a robust, quantitative framework for prioritizing sub-watersheds for targeted landslide susceptibility management and conservation planning in both watersheds.
Ranking on the basis of TOPSIS technique for Pindar River watershed
In TOSPIS model, the best solution should be nearest to the Ideal solution. By using the weightage values determined by the AHP for each criterion, the weighted normalized matrix is obtained for TOPSIS. The best and the worst values were extracted of each criterion based on beneficial and nonbeneficial. The value of the parameter of each watershed was compared with both positive and negative ideals to determine the closeness of each sub-watershed to the ideal solution. Now the best alternative is the one which is nearest to the optimum solution. Thus, in this case too, SW5 is most preferable compared to the other sub-watersheds, whereas, SW 11 has the least susceptible to landslide (Table 4.4). Finally, all the sub-watersheds were classified into four priority categories: Very High, High, Moderate and Low Priority. So, out of thirty-three sub-watersheds SW16, SW5, SW 7, SW 4, SW 1, SW 3, SW 30, SW 26, SW 19 and SW29 are ranked as very high priority based on TOPSIS technique. SW23, SW 25, SW 18, SW 24, SW 12, SW 4, and SW8 are listed as high priority, while SW21, SW 22, SW 31, SW 10, SW 13, SW 2and SW6 are classed as moderate priority. Contrarily, SW17, SW 20, SW 32, SW 13, SW 11, SW 9, SW 15, SW 28, and SW33 are considered as low priority. Subsequently, TOPSIS prioritized map of Pindar's sub-watersheds created has been shown in (Fig 3). As a result, it can be observed that the priority of the subwatersheds is nearly same in the 3 distinct MCDM approaches of Pindar watershed. The comparative results of final priorities for sub-watersheds based on the four previous discussed Multi-Criteria Decision-Making methods suggest that, in the presence of Landslide susceptibility map data, the above techniques of study can be used to prioritize sub-watersheds for watershed management measures along with the use of remote sensing and GIS techniques.
| — | TOPSIS | VIKOR | PROMETHEE | Average |
|---|---|---|---|---|
| TOPSIS | 0 | 71.43 | 78.57 | 75.00 |
| VIKOR | 71.43 | 0 | 85.71 | 78.57 |
| PROMETHEE | 78.57 | 85.71 | 0 | 82.14 |
Table text extracted from the original PDF; superscript letters are shown inline. The original table image is below.
View original table image
Ranking on the basis of VIKOR technique for Pindar River Watershed
The VIKOR method is a mechanism for multi-criteria analysis that can help you find a compromise ranking list and weights for each criterion. In this, the compromise solution should be closest to the Ideal solution. By using the AHP weightage values for each criterion, the boundary measures (mink Sk and mink Rk) were obtained for the best and worst values for all criterion were determined. The best and the worst values were extracted of each criterion which are desired according to each criterion. By taking a balance between mink Sk (maximum group utility) and mink Rk (minimum individual regret of an opponent), a final measure Qk was used for inducing the ranking list of VIKOR. So, in this case, SW5 has the highest priority among all the subwatersheds of Pindar which tends for Landslide whereas, SW15 with the lowest priority demonstrating least susceptible to landslide (Table 3). Finally, all the subwatersheds were classified into four priority categories: Very High, High, Moderate and Low Priority. So, out of thirty-three sub-watersheds SW1, SW 5, SW 19, SW 30, SW 26, SW 3, SW 4 and SW7 are ranked as very high priority based on VIKOR technique. SW8, SW 14, SW 12, SW 24, SW 29, SW 18, SW 25, SW 31, SW 23, and SW16 are listed as high priority, while SW 2, SW 6, SW 13, SW 22, SW 21, SW 27, and SW17 are classed as moderate priority. Contrarily, SW 32, SW 20, SW 11, SW 9, SW 15, SW 33, SW 28and SW10, are considered as low priority. Subsequently, a VIKOR prioritized map of Pindar's subwatersheds has been shown in (Fig 4)
| Sub-Watershed | TOPSIS | VIKOR | PROMETHEE |
|---|---|---|---|
| SW1 | 4 | 3 | 6 |
| SW2 | 24 | 23 | 23 |
| SW3 | 7 | 7 | 3 |
| SW4 | 10 | 8 | 9 |
| SW5 | 1 | 1 | 1 |
| SW6 | 26 | 22 | 25 |
| SW7 | 3 | 9 | 5 |
| SW8 | 13 | 13 | 14 |
| SW9 | 28 | 31 | 26 |
| SW10 | 21 | 26 | 29 |
| SW11 | 33 | 25 | 28 |
| SW12 | 11 | 11 | 2 |
| SW13 | 23 | 20 | 20 |
| SW14 | 12 | 12 | 4 |
| SW15 | 29 | 33 | 29 |
| SW16 | 2 | 6 | 10 |
| SW17 | 27 | 24 | 22 |
| SW18 | 17 | 16 | 15 |
| SW19 | 8 | 4 | 12 |
| SW20 | 30 | 28 | 30 |
| SW21 | 19 | 19 | 24 |
| SW22 | 18 | 21 | 27 |
| SW23 | 15 | 15 | 19 |
| SW24 | 16 | 18 | 16 |
| SW25 | 14 | 14 | 17 |
| SW26 | 6 | 5 | 7 |
| SW27 | 22 | 27 | 21 |
| SW28 | 25 | 29 | 31 |
| SW29 | 9 | 10 | 13 |
| SW30 | 5 | 2 | 8 |
| SW31 | 20 | 17 | 11 |
| SW32 | 32 | 30 | 33 |
| SW33 | 33 | 32 | 32 |
Table text extracted from the original PDF; superscript letters are shown inline. The original table image is below.
View original table image
Ranking on the basis of PROMETHEE technique for Pindar River Wate##rshed
In the PROMETHEE model, the ranking of alternatives is determined based on preference functions and net outranking flows. By using the weightage values determined through the AHP for each criterion, the preference indices for all alternatives were computed. The net outranking flow for each sub-watershed was then calculated, where higher positive flow values indicate better performance (greater susceptibility or priority), while lower or negative flow values indicate lesser preference. The sub-watersheds were subsequently ranked according to their net flow scores, with the most critical ones being placed higher in the ranking order (Table 3). In this case, SW5 emerged as the most preferable sub-watershed compared to the others, whereas SW32 exhibited the least susceptibility to landslide. Based on the PROMETHEE analysis, all the sub-watersheds were classified into four priority categories: Very High, High, Moderate, and Low. Accordingly, SW1, SW5, SW 7, SW 3, SW 14, SW 12, SW 4, SW 16, SW 30 and SW26 were identified as very high priority, while SW 31, SW 25, SW 18, SW 19, SW 8, SW 24, and SW29 were placed in the high priority group. Similarly, SW 17, SW 2, SW 13, SW 27, SW 23, and SW21 were categorized under moderate priority, whereas SW 20, SW 32, SW 22, SW 11, SW 6, SW 9, SW 10, SW 33, SW 15and SW28 were ranked as low priority. The PROMETHEE based prioritized map of Pindar's sub-watersheds is presented in Fig. 5. The results further reveal that the prioritization pattern of sub-watersheds remains nearly consistent across the 3different MCDM approaches applied in the Pindar river watershed. The comparative evaluation of prioritization outcomes suggests that, when integrated with soil loss data, PROMETHEE and other MCDM techniques provide a robust framework for prioritizing sub-watersheds and designing suitable watershed management strategies with the aid of GIS and remote sensing. The percentage change (ΔP) metric was used to evaluate variations in ranking positions between the MCDM techniques TOPSIS, VIKOR, and PROMETHEE and to assess the degree of agreement and divergence in subwatershed prioritization results. The analysis reveals noticeable differences among the applied methods. A ΔP value of 71.43% between TOPSIS and VIKOR indicates a moderate level of agreement with observable ranking variations. In contrast, a higher divergence was observed between TOPSIS and PROMETHEE (78.57%), suggesting that PROMETHEE produces prioritization patterns that differ more substantially from those generated by TOPSIS.
The greatest dissimilarity was identified between VIKOR and PROMETHEE, with a ΔP value of 85.71%, reflecting fundamental methodological differences between the compromise-based approach of VIKOR and the outranking framework of PROMETHEE. The average percentage change values further reinforce these observations. PROMETHEE recorded the highest average ΔP value (82.14%), followed by VIKOR (78.57%), while TOPSIS exhibited the lowest average percentage change (75.00%).
These results indicate a higher sensitivity of PROMETHEE in differentiating sub-watersheds. Similarly, the intensity change (ΔI) values showed a relatively narrow range across the three techniques. PROMETHEE demonstrated the highest average ΔI value (1.21), followed by TOPSIS and VIKOR (1.18 each). Overall, while all three MCDM techniques produced broadly comparable prioritization outcomes, PROMETHEE consistently exhibited greater sensitivity and discriminatory capability, making it particularly effective for sub-watershed prioritization in the Pindar River watershed.
Summary
This study presents a systematic sub-watershed prioritization of the Pindar River watershed in the Kumaon Himalaya using an integrated geospatial and multi-criteria decision-making (MCDM) framework. A total of 11 carefully selected thematic layers representing topographic, hydrological, geological, climatic, vegetation, and anthropogenic factors were generated using remote sensing and GIS techniques. These layers were standardized and weighted using the Analytic Hierarchy Process (AHP) to ensure objective representation of their relative importance.
The watershed was delineated into 33 sub-watersheds, which were then evaluated and ranked using three widely applied MCDM techniques: TOPSIS, VIKOR, and PROMETHEE. The prioritization results obtained from all three methods showed a high degree of spatial consistency, with several sub-watersheds repeatedly identified as highpriority zones due to unfavorable terrain conditions, high relief, proximity to roads and streams, high rainfall, sparse vegetation, and weak lithological formations. Comparative evaluation using percentage change (ΔP) and intensity change (ΔI) metrics revealed methodological differences among the techniques, with PROMETHEE demonstrating relatively higher sensitivity and discriminatory capability in ranking sub-watersheds. Overall, the integrated approach proved effective in identifying critical sub-watersheds requiring immediate management attention.
Conclusion
The present study demonstrates that the integration of GISbased thematic analysis with advanced MCDM techniques provides a robust and reliable framework for sub-watershed prioritization in mountainous terrains.
Figures and tables from the paper
| S. No. | Thematic Layer | Source of Data | Resolution / Scale |
|---|---|---|---|
| 1 | Digital Elevation Model (DEM) | SRTM DEM (USGS Earth Explorer) | 30 m |
| 2 | Slope | Derived from DEM | 30 m |
| 3 | Aspect | Derived from DEM | 30 m |
| 4 | Curvature | Derived from DEM | 30 m |
| 5 | Rainfall | CRU-TS (Climatic Research Unit, Univ. of East Anglia) precipitation dataset | 0.5°; resampled to 30 m |
| 6 | Lithology | Geological Survey of India (GSI) lithological maps | 1:50,000 |
| 7 | Land Use / Land Cover (LULC) | ESA World Cover | 30 m |
| 8 | Normalized Difference Vegetation Index (NDVI) | Landsat 8 OLI (USGS Earth Explorer) | 30 m |
| 9 | Relative Relief | Derived from DEM | 30 m |
| 10 | Distance from Roads | Road network (OpenStreetMap / Survey of India toposheets) | Vector → Raster (30 m) |
| 11 | Distance from Rivers | Derived from DEM | Vector → Raster (30 m) |
Table text extracted from the original PDF; superscript letters are shown inline. The original table image is below.
View original table image
| Factor | Weights | Classes for Pindar | Reclassification |
|---|---|---|---|
| Slope (o) | 0.227 | 0-10 | 1 |
| 11-25 | 2 | ||
| 26-35 | 3 | ||
| 36-45 | 4 | ||
| >45 | 5 | ||
| DEM(m) | 0.175 | <1000 | 1 |
| 1001-2000 | 2 | ||
| 2001-3000 | 3 | ||
| 3001-4000 | 4 | ||
| >4000 | 5 | ||
| Relative Relief (m) | 0.150 | 850-1900 | 5 |
| 1901-2600 | 4 | ||
| 2601-3400 | 3 | ||
| 3401-4400 | 2 | ||
| 4401-6600 | 1 | ||
| Distance from Road (m) | 0.119 | 100 | 1 |
| 200 | 2 | ||
| 300 | 3 | ||
| 400 | 4 | ||
| 500 | 5 | ||
| Rainfall(mm) | 0.092 | 600-800 | 1 |
| 810-1000 | 2 | ||
| 1100-1200 | 3 | ||
| 1300-1400 | 4 | ||
| 1500-1600 | 5 | ||
| NDVI | 0.063 | Bare land | 4 |
| Grass land | 2 | ||
| Sparse vegetation | 3 | ||
| Dense vegetation | 1 | ||
| LULC | 0.051 | Water | 1 |
| Tree | 2 | ||
| Crop/ Rangeland | 3 | ||
| Built area | 4 | ||
| Bare ground | 5 | ||
| Lithology | 0.045 | Meghalayan | 5 |
| Neoproterozoic-Cambrian | 4 | ||
| Neoproterozoic | 3 | ||
| Proterozoic (undifferentiated) | 2 | ||
| Mesoproterozoic | 1 | ||
| Curvature | 0.034 | Concave | 3 |
| Flat | 1 | ||
| Convex | 2 | ||
| Distance from Stream(m) | 0.003 | 100 | 5 |
| 200 | 4 | ||
| 300 | 3 | ||
| 400 | 2 | ||
| 500 | 1 | ||
| Aspect | 0.014 | Flat | 1 |
| North | 2 | ||
| NE & East | 3 | ||
| South & SW | 4 | ||
| West & NW | 5 |
Table text extracted from the original PDF; superscript letters are shown inline. The original table image is below.
View original table image
| — | TOPSIS | VIKOR | PROMETHEE | Average |
|---|---|---|---|---|
| TOPSIS | 1 | 1.23 | 1.32 | 1.18 |
| VIKOR | 1.23 | 1 | 1.30 | 1.18 |
| PROMETHEE | 1.32 | 1.30 | 1 | 1.21 |
Table text extracted from the original PDF; superscript letters are shown inline. The original table image is below.
View original table image
References
15 in the original paper- Ameri AA, Pourghasemi HR, Cerda A. Erodibility prioritization of sub-watersheds using morphometric parameter analysis and its mapping: comparison among TOPSIS, VIKOR, SAW and CF multi-criteria decisionmaking models. Science of the Total Environment. 2018;613:1385-1400.
- Amrei SYG, Teymourian A. Application of TOPSIS and BWM for portfolio allocation. Accounting. 2024;10(4):221. DOI:10.5267/j.ac.2024.7.001
- Arabameri A, Pradhan B, Pourghasemi HR, Rezaei K. Identification of erosion-prone areas using different multi-criteria decision-making techniques and GIS. Geomatics, Natural Hazards and Risk. 2018;9(1):11291155.
- Erdoğan NK, Altınırmak S, Karamaşa Ç. Comparison of multi-criteria decision-making methods with respect to performance of food firms listed in BIST. Copernican Journal of Finance & Accounting. 2016;5(1):67-84. DOI:10.12775/cjfa.2016.004
- Goswami A, Kundu G. Geological and geomorphological interaction of landslides in the Himalayan region. In: Landslides in the Himalayan Region: Risk Assessment and Mitigation Strategy for Sustainable Management. Singapore: Springer Nature; 2024. p. 3-21.
- Madanchian M, Taherdoost H. A comprehensive guide to the TOPSIS method for multi-criteria decisionmaking. Sustainable Social Development. 2023;1(1):120. DOI:10.54517/ssd.v1i1.2220
- Mandal K, Saha S, Mandal S. Applying deep learning and benchmark machine learning algorithms for landslide susceptibility modelling in Rorachu River Basin of Sikkim Himalaya, India. Geoscience Frontiers. 2021;12(5):101203. DOI:10.1016/j.gsf.2021.101203
- Mateo JRS. TOPSIS. In: Green Energy and Technology. Berlin: Springer; 2012. p. 43-62. DOI:10.1007/978-1-4471-2346-0_7
- Noorollahi Y. Landslide modelling and susceptibility mapping using AHP and fuzzy approaches. International Journal of Hydrology. 2018;2(2):1-10. DOI:10.15406/ijh.2018.02.00063
- Panwar S, Agarwal V, Chakrapani GJ. Morphometric and sediment source characterization of the Alaknanda River Basin, headwaters of River Ganga, India. Natural Hazards. 2017;87(3):1649-1671.
- Papathanasiou J, Ploskas N. TOPSIS. In: Springer Optimization and Its Applications. Cham: Springer International Publishing; 2018. p. 1-30. DOI:10.1007/978-3-319-91648-4_1
- Saragih DF, Ginting B. Landslide susceptibility mapping using GIS-based multi-criteria decision analysis method. Jurnal Teknik Sipil. 2023;12(1):9-18. DOI:10.24815/jts.v12i1.28743
- Tomić L, Karović-Maričić V, Danilović D, Leković B, Crnogorac M. Application of the PROMETHEE and VIKOR methods for selecting the most suitable carbon dioxide geological storage option. Podzemni Radovi. 2019;34:43-55. DOI:10.5937/podrad1934043t
- Tubog MV, Villahermosa RL, Perong JG. Landslide susceptibility modeling derived from remote sensing, multi-criteria decision analysis and GIS techniques: a case study in Southeast Bohol Province, Philippines. Research Square. 2023:1-28. DOI:10.21203/rs.3.rs2547208/v1
- Yazdani M, Zaraté P, Zavadskas EK, Turskis Z. A combined compromise solution (CoCoSo) method for multi-criteria decision-making problems. Management Decision. 2019;57(9):2501-2518. DOI:10.1108/MD-052017-0458