
Research article · 2026 · Full text
International Journal of Advanced Chemistry ResearchA review-study of FTIR analysis of linseed oil
Volume 8(1) · Pages 13–15 · DOI: 10.33545/26646781.2026.v8.i1a.352 ↗
Research areasEdible Oils Quality and AnalysisFood Chemistry and Fat AnalysisFatty Acid Research and Health
Abstract
Author-writtenFourier Transform Infrared (FTIR) spectroscopy is a powerful analytical technique for investigating the molecular composition and chemical properties of oils. This study focuses on the FTIR analysis of linseed oil, a widely used drying oil rich in polyunsaturated fatty acids, to characterize its functional groups and assess its chemical structure. The oil sample was analyzed in the mid-infrared region (4000- 400 cm-1) to identify characteristic absorption bands corresponding to hydroxyl (-OH), carbonyl (C=O), and unsaturated (C=C) groups. Prominent peaks were observed at ~1745 cm-1, indicating ester carbonyl stretching, and at ~3010 cm⁻¹, associated with = C-H stretching of unsaturated fatty acids. Additional bands corresponding to -CH2 and -CH3 stretching (~2920 cm-1 and ~2850 cm-1) and C-O stretching (~1160 cm-1) were also identified. The FTIR spectral profile provided insight into the degree of unsaturation and oxidative state of linseed oil, which is crucial for its applications in coatings, paints, and polymer formulations. The study demonstrates that FTIR spectroscopy offers a rapid, non- destructive, and reliable method for characterizing linseed oil and monitoring its quality.
Summary
Source-checkedPlain-language reading of the full paper, prepared with AI and checked against the text. Each point links to the authors' own words.
Why it matters
- Vegetable oils are plant-derived, water-insoluble triglycerides composed of saturated and unsaturated fatty acids. View evidence ↗
- Linseed oil is highly valued for its high unsaturated fatty acid content (around 90%), including omega-3 and omega-6, and an iodine value of 175-204 g I2/100 g. View evidence ↗
- Understanding the oxidative state and degree of unsaturation in linseed oil is essential for its use in paints, coatings, and polymers. View evidence ↗
The question
- The study aims to determine the chemical composition of flax seed (linseed) oil using Fourier Transform Infrared (FTIR) spectroscopy. View evidence ↗
What they did
- Measurements were performed using a Thermo Scientific Nicolet 6700 FT-IR equipped with a DLaTGS detector, CsI beamsplitter, and a 'Smart Orbit' micro-ATR across the 4000-225 cm-1 range. View evidence ↗
- The analysis focused on the mid-infrared region (4000-400 cm-1) to identify hydroxyl, carbonyl, and unsaturated functional groups. View evidence ↗
What they found
- A broad absorption band at approximately 3400 cm-1 indicates the presence of hydroxyl (-OH) groups, suggesting trace water or free fatty acids. View evidence ↗
- Strong bands at 2920 cm-1 and 2850 cm-1 correspond to the asymmetric and symmetric stretching of methylene and methyl groups, reflecting the long aliphatic chains of the fatty acids. View evidence ↗
- A prominent peak at 1745 cm-1 confirms the presence of ester carbonyl (C=O) groups, indicating the oil exists primarily as esterified triglycerides. View evidence ↗
- A peak near 1655 cm-1 identifies cis carbon-carbon double bonds (C=C), confirming the high degree of unsaturation responsible for the oil's drying properties. View evidence ↗
- Bending vibrations of methylene and methyl groups were observed at 1465 cm-1 and 1375 cm-1, confirming the aliphatic backbone of the fatty acid chains. View evidence ↗
- C-O stretching vibrations of ester groups were identified between 1160 and 1240 cm-1, further supporting the triglyceride structure. View evidence ↗
What it means
- The authors conclude that FTIR spectroscopy is a rapid, non-destructive, and reliable method for characterizing linseed oil and monitoring its quality. View evidence ↗
- The spectral analysis confirms that the studied linseed oil sample is of standard quality and suitable for industrial use. View evidence ↗
Figures & tables
From the original paper Figure 1
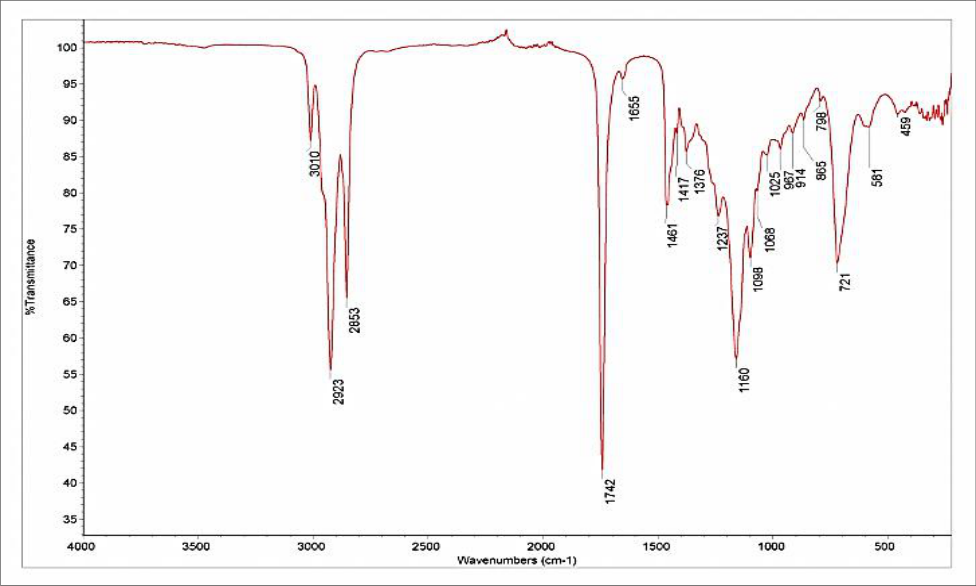 Figure 2
Introduction
Vegetable oils are water insoluble products of plants and represent triesters of glycerol (or triglycerides) with saturated and unsaturated fatty acids. They can also be produced through reaction of glycerol with fatty acids [4] . Vegetable oil molecule includes an ester part (triglyceride) and a non-ester part represented by: phospholipids, sterols, vitamins and their precursors, antioxidants, pigments and impurities [5] . Triglyceride itself represents that part of the oil molecule which can be exploited in the industry, due to a great number of the double bonds on the fatty acid structure. The fatty acid composition of vegetable oils is the main factor influencing their properties, concerning both nutrition and exploitation as raw materials for oleo chemistry [6,7] . Linum usitatissimum is a member of the family Linaceae. The unsaturated fatty acids content of linseed oil is in a range of 90% with high content of omega-3 and omega-6 fatty acids which makes it an excellent choice as edible oil (nutritional supplement), in surfactants and detergents, cosmetics and pharmaceutical industry, with an iodine value of 175-204 g I2/100 g. The object of this article is to determine the chemical composition of flax seed oil by FTIR spectroscopy [8][9][10][11][12][13][14][15][16][17] .
Materials and Methods
All measurements for linseed oil were carried out using a Thermo Scientific Nicolet 6700 FT-IR (has DLaTGS detector and CsI beamsplitter) with a "Smart Orbit" micro-ATR in mid-IR and far-IR region (4000-225 cm -1 ).
Results and Discussion
Figure 2 shows the FTIR spectrum of linseed oil with frequencies between 3010 and 459 cm -1 . ATR-FTIR signals: FTIR (ATR, cm -1 ): 3010 (ν=CH-); 2923, 2853 (νC-H asym, sym), 1742 (νC=O); 1655 (νC=C from unsaturated acids); 1461 (δCH2); 1376 (δCH3); 1237, 1160, 1098 (νC-O); 721 (ρCH2). The Fourier Transform Infrared (FTIR) spectrum of linseed oil was recorded in the mid-infrared region (4000-400 cm⁻¹) to investigate its chemical composition and functional groups. The spectrum revealed several characteristic peaks that correspond to the molecular structure of linseed oil, which is predominantly composed of triglycerides rich in polyunsaturated fatty acids, such as linolenic, linoleic, and oleic acids. A broad absorption band observed around 3400 cm -1 corresponds to the stretching vibration of hydroxyl (-OH) groups. Although linseed oil is primarily composed of esterified fatty acids, small amounts of free fatty acids or residual moisture can contribute to this broad band. The presence of this band suggests minor hydrolysis or the presence of trace water content, which is common in natural oils. The broad nature of the band indicates hydrogen bonding interactions, which can slightly influence the oil's viscosity and oxidative stability. Strong absorption bands were observed at approximately 2920 cm -1 and 2850 cm -1 , corresponding to the asymmetric and symmetric stretching vibrations of methylene (-CH2) and methyl (-CH3) groups, respectively. These vibrations are characteristic of long aliphatic chains present in the fatty acids of linseed oil. The relative intensity of these peaks provides information about the chain length and the relative abundance of saturated versus unsaturated fatty acids. In linseed oil, these peaks are consistent with its high content of long-chain unsaturated fatty acids. A prominent peak at 1745 cm -1 is assigned to the carbonyl (C=O) stretching vibration of ester functional groups in triglycerides. This is a key feature of all natural oils and confirms that linseed oil exists primarily in an esterified triglyceride form. The sharpness and intensity of this peak indicate a relatively low degree of hydrolysis, suggesting the sample is of good quality. Additionally, the C=O stretching band can shift slightly in cases of oxidation or chemical modification, making it an important marker for monitoring oil stability. A peak near 1655 cm -1 corresponds to the stretching vibration of cis carbon-carbon double bonds (C=C) in unsaturated fatty acids. This band confirms the high degree of unsaturation in linseed oil, which is primarily responsible for its drying properties and reactivity in polymerization and crosslinking reactions. The intensity of this peak correlates with the content of polyunsaturated fatty acids such as linolenic acid. FTIR analysis thus provides a simple method to assess the unsaturation level, which is crucial for predicting the oil's performance in industrial applications like paints, varnishes, and coatings. Bands observed around 1465 cm -1 and 1375 cm -1 are attributed to bending vibrations of methylene and methyl groups, respectively. These peaks are indicative of the aliphatic backbone of the fatty acid chains. The presence of these bands confirms that linseed oil contains long-chain hydrocarbon structures, which contribute to its hydrophobic nature and stability. Variations in these peaks can indicate structural modifications, such as oxidation or polymerization, which are relevant in quality assessment. The absorption bands between 1160 and 1240 cm -1 correspond to C-O stretching vibrations of ester groups. These peaks further support the triglyceride structure of linseed oil and are consistent with literature reports on vegetable oils. These bands are particularly useful for distinguishing esterified oils from free fatty acids or degraded samples. The relative intensity and position of the C-O bands can also provide information about the oil's oxidative state and purity. Weak bands in the 720-730 cm⁻¹ region are attributed to -CH2 rocking vibrations and out-of-plane bending modes of the hydrocarbon chains. These bands are characteristic of long-chain fatty acids and provide additional confirmation of the molecular structure of linseed oil. The FTIR spectrum of linseed oil reflects its chemical integrity and high degree of unsaturation. The presence of prominent C=O and C-O bands confirms the triglyceride structure, while the C=C band indicates polyunsaturation critical for drying and oxidative polymerization. Minor O-H absorption suggests trace free fatty acids or moisture, which may influence storage stability. The FTIR profile also serves as a reference for detecting adulteration or degradation in commercial samples, making it a valuable tool for quality control. Overall, FTIR spectroscopy provides rapid, non-destructive, and accurate information about linseed oil's functional groups, unsaturation level, and structural features. The spectral analysis confirms that the sample under study is of standard quality, suitable for industrial applications, and highlights the technique's utility in monitoring chemical changes such as oxidation, hydrolysis, or polymerization over time.
Conclusion
The FTIR analysis of linseed oil successfully identified its characteristic functional groups and provided detailed insight into its chemical structure. Key absorption bands corresponding to ester carbonyl (C=O), hydroxyl (-OH), unsaturated (C=C), and aliphatic (-CH2/-CH3) groups were clearly observed, confirming the presence of polyunsaturated fatty acids typical of linseed oil. The spectral data also revealed information about the degree of unsaturation and potential oxidative changes, which are critical for its performance in industrial applications such as paints, varnishes, and polymer formulations. Overall, FTIR spectroscopy proved to be a rapid, non-destructive, and reliable analytical tool for characterizing linseed oil, monitoring its quality, and assessing its chemical integrity. This study reinforces the utility of FTIR as an essential technique for both research and quality control in natural oils.
Figures and tables from the paper
References
17 in the original paper- Subagio A, Morita N. Chemical properties of linseed oil. Food Chem. 2003;81:97-102.
- Dupont J, White PJ, Carpenter MP, Schaefer EJ, Meydani SN, Elson CE, et al. Food components and human health. J Am Coll Nutr. 1990;9(5):438-470.
- Veljković VB, Biberdžić MO, Banković-Ilić IB, Djalović IG, Tasi MB, Nježić ZB, et al. Biodiesel production and properties. Renew Sustain Energy Rev. 2018;91:531-548.
- Guner FS, Yagci Y, Erciyes AT. Polymers from triglyceride oils. Prog Polym Sci. 2006;31:633-670.
- Sharma V, Kundu PP. Addition polymers from natural oils. Prog Polym Sci. 2006;31:983-1008.
- Chira NA, Todasca MC, Nicolescu A, Rosu A, Nicolae M, Rosca SI. Compositional characterisation of Romanian grape seed oils using spectroscopic methods. Rev Chim. 2011;62:42-46.
- Mutlu H, Meier MAR. Castor oil as a renewable resource for the chemical industry. Eur J Lipid Sci Technol. 2010;112:10-30.
- Stanciu I. Modeling the temperature dependence of dynamic viscosity for rapeseed oil. J Sci Arts. 2011;1:55-58.
- Meneghetti SMP, Meneghetti MR, Wolf CR, Silva EC, Lima GE, Coimbra MDA, et al. Chemical modification of vegetable oils. J Am Oil Chem Soc. 2006;83(9):819822.
- Stanciu I. Rheological studies of biodegradable oils. J Sci Arts. 2018;18(2):453-458.
- Sheibani A, Ghotbaddini-Bahraman N, Sadeghi F. Chemical and rheological properties of vegetable oils. Orient J Chem. 2014;30(3):1205-1209.
- Stanciu I. Some methods for determining the viscosity index of hydraulic oil. Indian J Sci Technol. 2023;16(4):254-258.
- Stanciu I. Rheological behavior of corn oil at different viscosity and shear rate. Orient J Chem. 2023;39(2):335-339.
- Stanciu I. Rheological characteristics of corn oil used in biodegradable lubricant. Orient J Chem. 2023;39(3):592-595.
- Stanciu I. Effect of temperature on rheology of corn (Zea mays) oil. Orient J Chem. 2023;39(4):1068-1070.
- Stanciu I. Study rheological behavior of rapeseed oils compared to mineral oil. Orient J Chem. 2021;37(1):247-249.
- Stanciu I. Influence of temperature on the rheological behavior of orange honey. Orient J Chem. 2021;37(2):440-443.