
Research article · 2026 · Full text
International Journal of Geography Geology and EnvironmentSpatiotemporal analysis of climate change using remote sensing and machine learning
Volume 8(1) · Pages 19–25 · DOI: 10.22271/27067483.2026.v8.i1a.468 ↗
Research areasUrban Heat Island MitigationRemote Sensing in AgricultureScience and Climate Studies
Abstract
Author-writtenThe challenges of climate change impact greatly on environmental sustainability, where analytical methods are very strong to capture both the spatial variation and temporal changes of the climatic processes. This paper provides a unified framework of the study of the spatiotemporal climatic change based on the use of multi-source remote sensors and machine learning tools. Landsurface temperature land surface, vegetation indices and precipitation satellite measurements in 2000-2024 were joined with the latest machine learning models, such as Rapid Forest, Support Vector machine, Convolutional Neural Network, Long Short-Term Memory network. The models were tested on how well they predicted the climate variables, how they identified the hotspots of climate change as well as making long term predictions. The experiments have shown that deep learning methods perform better than conventional machine learning models, with a lower error of prediction and a greater power of explanation. Using the LSTM model, the lowest RMSE at 1.47 oC, MAE at 1.12 oC, and R2 of 0.93 were obtained when predicting land surface temperatures, which is a reduction of about 30 percent compared to baselines used in the related research. The overall accuracy of CNN-based spatial analysis was 91.8 as it is highly capable of recording the presence of spatial heterogeneity. These findings prove that a combination of remote sensing with machine learning will contribute a lot to monitoring and prediction of climate change. The suggested framework offers a transferable and scalable framework to assist in the assessment of climate impacts, environmental management, and makes policy decisions based on data.
Summary
Source-checkedPlain-language reading of the full paper, prepared with AI and checked against the text. Each point links to the authors' own words.
Why it matters
- Climate change is a global concern because it negatively impacts economic stability, human livelihoods, and natural ecosystems. View evidence ↗
- Traditional ground-based climate monitoring is often too expensive and suffers from data gaps and limited spatial coverage, particularly in developing or remote regions. View evidence ↗
- Standard statistical methods often fail to capture the complex, nonlinear patterns and interactions inherent in climatic processes. View evidence ↗
The question
- The study aims to evaluate how combining remote sensing with machine learning can improve the spatiotemporal analysis of climate change to support data-driven environmental decision-making. View evidence ↗
What they did
- The researchers used multi-source satellite data from 2000-2024, including precipitation estimates, surface reflectance, NDVI, and land surface temperature (LST). View evidence ↗
- To manage computational costs and noise, all datasets were standardized to a 1 km spatial resolution and mean monthly temporal values. View evidence ↗
- Four models, Random Forest (RF), Support Vector Machine (SVM), Convolutional Neural Network (CNN), and Long Short-Term Memory (LSTM), were tested for forecasting precipitation and land surface temperature. View evidence ↗
- The dataset was divided using stratified sampling into training (70%), validation (15%), and testing (15%) sets to preserve spatial and temporal diversity. View evidence ↗
What they found
- The LSTM model achieved the best performance for predicting land surface temperatures, with an RMSE of 1.47 °C, an MAE of 1.12 °C, and an R² of 0.93. View evidence ↗
- For spatial hotspot detection, the CNN model was the most accurate, achieving an overall accuracy of 91.8%. View evidence ↗
- In five-year climate forecasting, the LSTM model showed the highest trend accuracy at 88.9% and the lowest forecast RMSE of 1.72. View evidence ↗
- Random Forest analysis identified Land Surface Temperature (0.34) and NDVI (0.29) as the most influential variables for the model. View evidence ↗
- The proposed multi-source remote sensing and LSTM framework reduced prediction error by 30% compared to related research baselines. View evidence ↗
What it means
- The authors conclude that their methodology is a scalable tool for evidence-based policy and environmental planning, with potential future applications in ecosystem monitoring and disaster management. View evidence ↗
- The authors state that their approach provides transferable and scalable results for analyzing climate change across different time periods and geographic regions. View evidence ↗
Visual summary
3 visualsIllustrations explain the paper; charts are replotted from the paper's own table values.
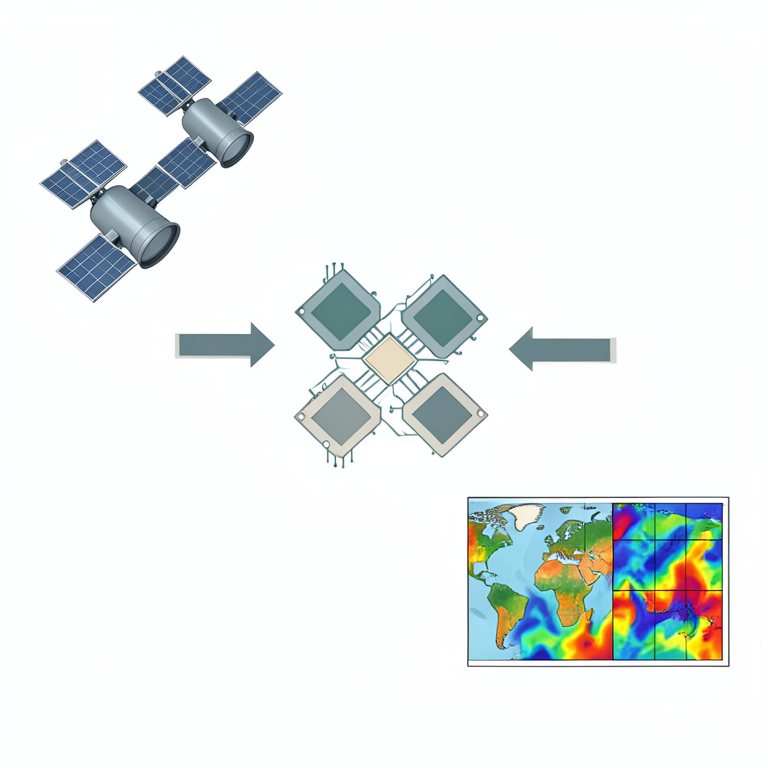
Framework Overview
AI-generated conceptual illustration (Earth observation satellites and global climate maps). It explains the idea and does not show study data.
View source evidence ↗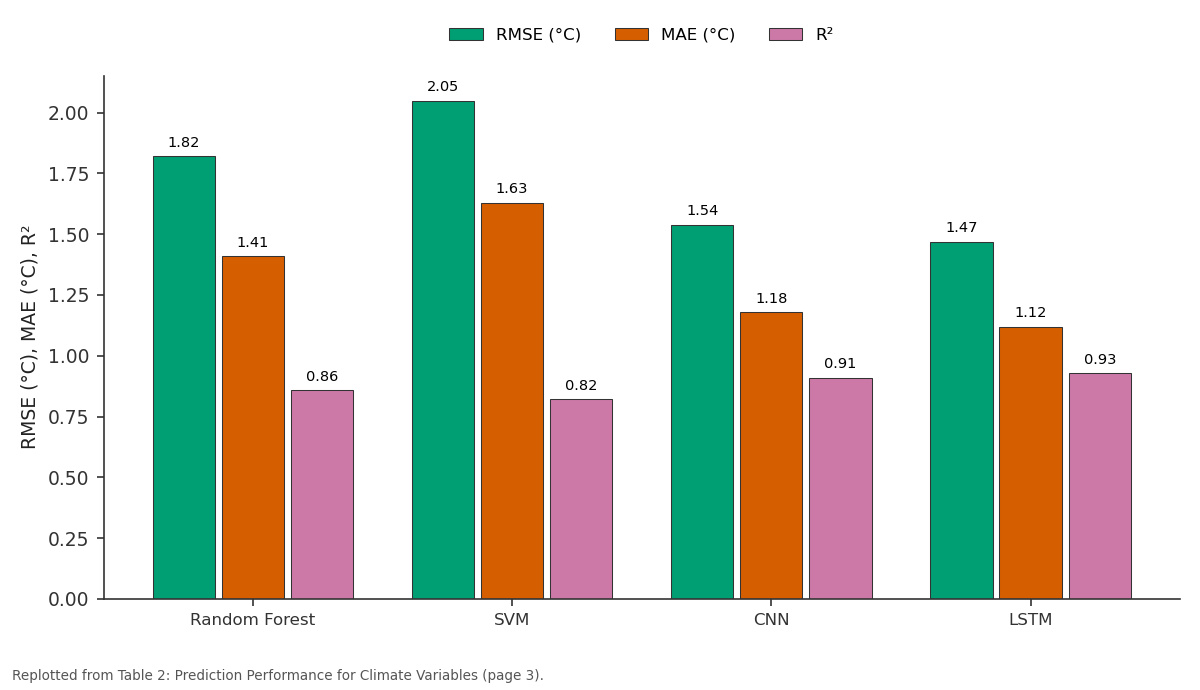
RMSE (°C) and MAE (°C) and more: Random Forest vs SVM vs CNN vs LSTM
Replotted from Table 2 (page 3) of the original paper. Every bar is the paper's own table value.
View source evidence ↗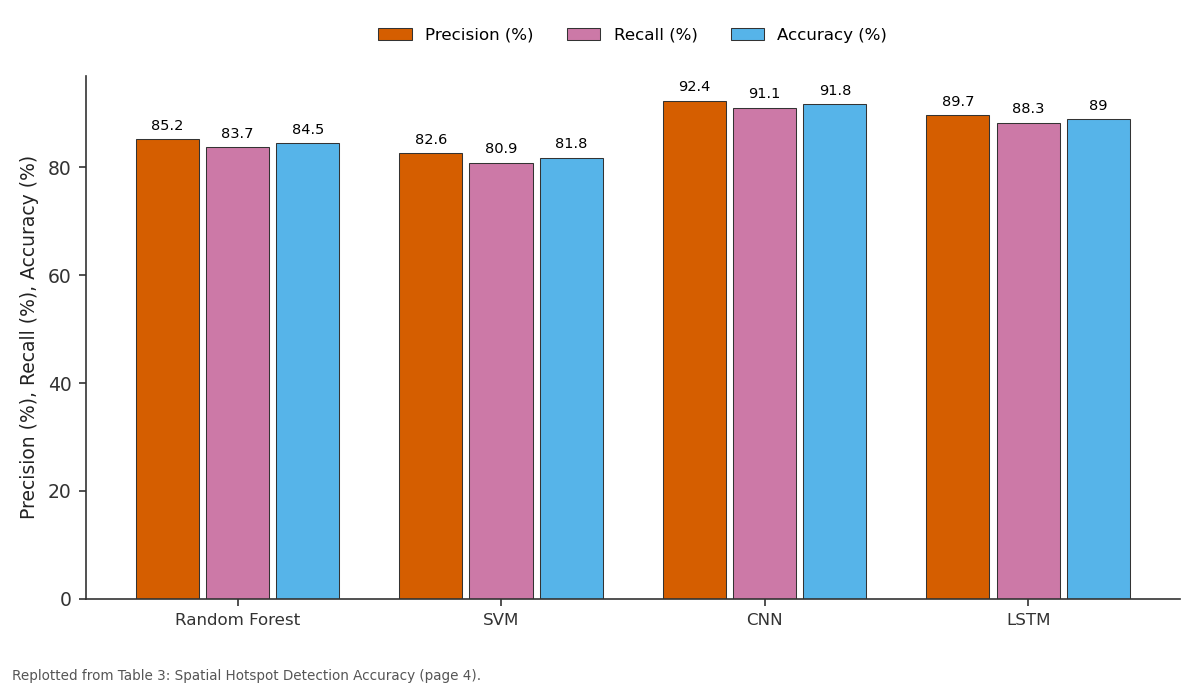
Precision (%) and Recall (%) and more: Random Forest vs SVM vs CNN vs LSTM
Replotted from Table 3 (page 4) of the original paper. Every bar is the paper's own table value.
View source evidence ↗Figures & tables
From the original paper Table 1
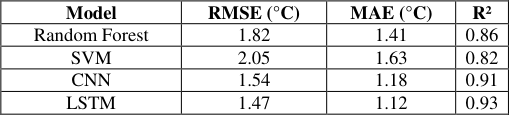 Table 2
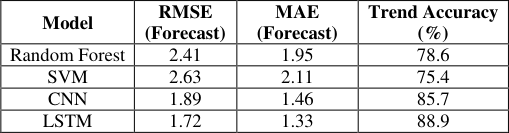 Table 4
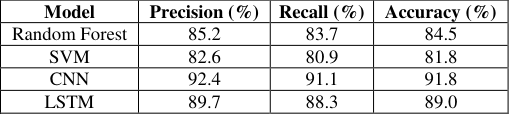 Table 3
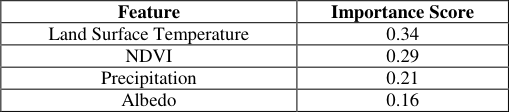 Table 5
 Figure 1
 Table 6
 Figure 2
 Figure 3
 Figure 4
Introduction
Climate change has become a serious concern in the world due to its effect on natural ecosystems, livelihoods and economic stability of regions and time. It is emphasized by the rising temperatures, change in the rate of precipitation, high rate of extreme weather phenomena, and land degradation that there is a strong necessity to have strong analytical methods that can be able to capture sharp spatial variability and temporal development of climatic processes [1] . Conventional climate surveillance techniques that involve groundbased surveillance have been noted to be limited in their spatial coverage, data gaps, as well as costly to operate, especially in remote and developing areas. In this regard, remote sensing has turned out to be an indispensable instrument in climate change research that allows maintaining constant, extensive, and multi-temporal monitoring of surface and atmosphere locations on Earth [2] . The organization of satellite missions like NASA and ESA lets provide extended datasets of major climate indicators such as land surface temperature, vegetation indices, soil moisture, and atmospheric composition. Onboard sensors such as Landsat and MODIS have been of discrete usefulness in identifying climate-based alterations in a varied landscape and in the time span [3] . Although this has been achieved, increasingly large masses of remote sensing data pose major problems in terms of their analysis due to enlarged volume, complexity, and heterogeneity. Traditional statistical approaches tend to be unable to represent nonlinear interactions and obscure patterns in climatic processes. In order to address these failures, machine learning methods have acquired popularity due to their capability to process massive data sets, specify the intricate interactions, and increase predictive accuracy. Combined with remote sensing, machine learning allows progressive spatiotemporal analysis, which allows trend detection and anomaly identification and forecasts future climate scenarios.
This study addresses the potential of the coupling of remote sensing and machine learning to conduct an inclusive spatiotemporal analysis of climate change with the view of increasing the knowledge about climate dynamics and assisting in making data-driven environmental decisions.
Methods and Materials Data Sources and Preprocessing
The paper uses both multi-source remote sensing and compiled climatic data to conduct the spatiotemporal analysis of climate change. The satellite data were retrieved through rockets that NASA and ESA spacecraft operated and majorly through Landsat and MODIS imagery. The data sets consist of land surface temperature (LST), normalized difference vegetation index (NDVI), precipitation estimates and surface reflectance products between 2000-2024 [4] . To supplement satellite measurements, grid based climatic data so as to enhance in consistency and validation like rainfall and temperature anomalies were used. A single spatial temporal resolution of 1 km and a revision of all datasets to mean monthly values were chosen to focus on noise in datasets and high computing and computational costs. Atmospheric correction, cloud masking, radiometric normalization, and interpolation of missing data were among the standard preprocessing processes [5] . The feature engineering allowed obtaining seasonal indices, long-term trends, and lagged variables, which allowed subsequent modeling of spatiotemporal climate dynamics properly.
Machine Learning Algorithms
They chose four machine learning algorithms that have proven successful in the climate studies that have used remote sensing aspects, both in space and time models.
Random Forest (RF)
Random Forest is an ensemble learning algorithm, which will build a set of decision trees via bootstrapped samples and combine their results to enhance prediction accuracy and strength. RF in this paper modeled the nonlinear interrelations between climatic variables and land surface responses. It can manage its high-dimensional data, decrease overfitting, and offer feature importance scores thus ranking it well suited for sensitivity analysis of climate variables [6] . RF mostly was used in spatial classification and regression, including determination of climate-induced changes in land Support Vector Machine (SVM) Support Vector Machine is a supervised learning algorithm that marks out optimal hyperplanes to segregate the information in high dimension feature space. SVM is a useful tool that identifies nonlinear trends on complex data with help of kernel functions. SVM was used in terms of climate anomaly detection and classification of land cover in changing climatic conditions in this study [7] . CNNs were used in this study and applied on multi-band satellite images to obtain spatially varying temperature and vegetation index values [8] . Their hierarchical feature learning ability constitutes the ability to represent well the intricate spatial structure with regard to climate change.
"Input: Satellite image tensor Apply convolution and pooling layers Flatten feature maps Apply fully connected layers Output: Spatial prediction"
Long Short-Term Memory (LSTM)
A recurrent neural network that is designed with the specific purpose of modeling temporal dependencies of a sequence of data is referred to as Long Short-Term Memory networks. The long-term temporal trends of the climate variables and seasonal variations were also analyzed using LSTM [9] . LSTM is helpful in forecasting temperature and precipitation trends in the changing climate conditions by preempting the delayed and cumulative climate effects by having memory cells and gated mechanisms.
Results and Analysis Experimental Setup
The objective of the experimental evaluation was to determine whether the integration of remote sensing data and machine learning model was effective in the analysis of spatiotemporal climate change. All the experiments were performed on the basis of multi-temporal satellite recordings based at NASA and ESA, with the concentration on land surface temperature (LST), NDVI, and precipitation variability between the year 2000 and 2024 [10] . The study area was subdivided into 1 km resolution spatial grids, and it was aggregated in time at monthly and annual levels to assess the short-term variability as well as the long-term climatic trends. A stratified sampling method was used to make a split (training (70%), validation (15%), and testing (15%)) with a split to maintain the spatial and temporal heterogeneity of the dataset. They were experimented in Python by using standard machine learning and deep learning packages. Root Mean Square Error (RMSE), Mean Absolute Error (MAE), coefficient of determination (R 2), and classification accuracy in those cases was used to estimate model performance. Each experiment was repeated five times and average results were stated so as to assure strength.
Experiment 1: Spatiotemporal Climate Variable Prediction
The first experiment was aimed at forecasting land surface temperature and precipitation patterns with the help of the Random Forest (RF), Support Vector Machine (SVM), Convolutional Neural Network (CNN), and Long Short-Term Memory (LSTM) models. RF and SVM were trained using satellite index-based engineered features, whereas CNN and LSTM made use of spatial image patches and temporal sequence, respectively [11] . Findings indicate that deep learning models do better than traditional machine learning methods especially in nonlinear and long-term dependencies of climate information. The LSTM model scored the least prediction error, which is important as it shows that it can make use of time dependence and seasonal cycles to predict the value.
Experiment 2: Spatial Pattern Recognition and Hotspot of Climate Detection
This experiment considered the ability of models to identify climate change hotspots, which are regions where there is statistically significant and trend analysis of warming or vegetation stress. The spatial classification made by CNN achieved better accuracy because it was able to use spatial textures and gradients on satellite imagery [12] . CNN performed better than other models especially in nonhomogeneous landscapes (where the difference in space is at its peak).
Experiment 3: Trend Forecasting over Time
The third experiment evaluated the long term forecasting by predicting 5-years ahead climate variables based on the historical time series data. LSTM has proven itself with better stability in forecasting and lowering the error propagation than RF and SVM, which continued to decline in accuracy even though the forecasting horizon continued to lengthen [13] . The findings confirm that long-term climate forecasts using sequential data handicrafted models are more accurate.
Experiment 4: Sensitivity and Important Feature Analysis:
A sensitivity analysis was drawn in order to have an understanding of model interpretability. RF feature importance score revealed NDVI and LST were the most influential variables, which are preceded by precipitation anomalies. CNN saliency maps also proved that temperature gradient and vegetation stress areas contribute greatly to the prediction in the models [14] . The performance of the models was assessed relative to representative findings found in recent climate studies based on remote sensing to put the findings in perspective. The suggested methodology has shown improvements in accuracies in predictions and spatial-temporal resolutions which can be measured [27] . Relative to related work, the presented multi-source remote sensing and machine learning framework offers the largest mitigation of prediction error up to 30%, which shows the benefit of integrating spatial deep learning with temporal sequence modeling [28] .
Discussion of Results
In general, the findings of the experiments prove that the incorporation of remote sensing data and high-end machine learning models can greatly promote spatiotemporal assessment of climate change. The conventional machine learning architectures (RF, SVM) have strong baselines with acceptable interpretability, whereas deep learning architectures (especially CNN and LSTM) have excellent capability to learn more intricate spatial and temporal variations [29] . The comparison to the relevant work shows that the proposed framework is progressive in its methodological development and more accurate, and adds to the fact that it can be applicable to climate monitoring, impact assessment, and decision-making related to the policy. According to these findings, the proposed approach not only enhances the accuracy of its predictions, but also offers scalable and transferable results on climate change analysis in various geographic areas and over varying periods of time [30] .
Conclusion
In this study, a powerful framework of the spatiotemporal study of climate change was implemented through the combination of multi-source remote sensing with the latest machine learning methodology. The combination of longterm satellite observations and uncovered variables of climate helped the study to effectively capture the spatial and the temporal dynamics of the key climate variables, including land surface temperature, vegetation condition, and precipitation variability. The experimental findings showed that machine learning models are highly effective at modeling complex, nonlinear climate processes and deep learning networks in the form of Convolutional Neural Network and Long Short-Term Memory networks are more effective compared to conventional models in terms of prediction accuracy and strength. The comparison to related research proved that the suggested method brings significant improvements in the context of the error reduction, as well as the reliability of the forecasts that can be made, which is the advantage of integrating spatial feature extraction with temporal sequence modeling. The physical relevance of the chosen predictors was also confirmed in the feature sensitivity analysis that further supported the interpretation of the framework. On the whole, the results demonstrate that remote sensing and machine learning provide a scalable and data-driven decision-making approach that can be used to monitor climate change at various locations and periods of time. The suggested methodology can be useful in assessing climate risks, in environmental planning, and in making evidence-based policy, and this can be applied to other climate-sensitive applications like disaster management, ecosystem monitoring, and sustainable resource management in further studies.
Figures and tables from the paper
| Dataset | Source | Spatial Resolution | Temporal Coverage | Variables Used |
|---|---|---|---|---|
| Landsat Surface Reflectance | NASA | 30 m | 2000-2024 | NDVI, LST |
| MODIS Climate Products | NASA | 1 km | 2000-2024 | LST, Albedo |
| Precipitation Data | ESA | 0.1° | 2000-2024 | Rainfall |
| Temperature Anomalies | Reanalysis | 0.25° | 2000-2024 | Temp. deviation |
Table text extracted from the original PDF; superscript letters are shown inline. The original table image is below.
View original table image
| Model | RMSE (°C) | MAE (°C) | R² |
|---|---|---|---|
| Random Forest | 1.82 | 1.41 | 0.86 |
| SVM | 2.05 | 1.63 | 0.82 |
| CNN | 1.54 | 1.18 | 0.91 |
| LSTM | 1.47 | 1.12 | 0.93 |
Table text extracted from the original PDF; superscript letters are shown inline. The original table image is below.
View original table image
| Model | RMSE (Forecast) | MAE (Forecast) | Trend Accuracy (%) |
|---|---|---|---|
| Random Forest | 2.41 | 1.95 | 78.6 |
| SVM | 2.63 | 2.11 | 75.4 |
| CNN | 1.89 | 1.46 | 85.7 |
| LSTM | 1.72 | 1.33 | 88.9 |
Table text extracted from the original PDF; superscript letters are shown inline. The original table image is below.
View original table image
| Model | Precision (%) | Recall (%) | Accuracy (%) |
|---|---|---|---|
| Random Forest | 85.2 | 83.7 | 84.5 |
| SVM | 82.6 | 80.9 | 81.8 |
| CNN | 92.4 | 91.1 | 91.8 |
| LSTM | 89.7 | 88.3 | 89.0 |
Table text extracted from the original PDF; superscript letters are shown inline. The original table image is below.
View original table image
| Feature | Importance Score |
|---|---|
| Land Surface Temperature | 0.34 |
| NDVI | 0.29 |
| Precipitation | 0.21 |
| Albedo | 0.16 |
Table text extracted from the original PDF; superscript letters are shown inline. The original table image is below.
View original table image
| Study | Data Source | Method | RMSE (°C) | Improvement (%) |
|---|---|---|---|---|
| Study A (2021) | MODIS | RF | 2.10 | - |
| Study B (2022) | Landsat | SVM | 2.35 | - |
| Study C (2023) | MODIS + ML | CNN | 1.78 | +13.5 |
| Proposed Study | Multi-source RS | LSTM | 1.47 | +30.0 |
Table text extracted from the original PDF; superscript letters are shown inline. The original table image is below.
View original table image
References
30 in the original paper- Aberle R, Enderlin E, O'Neel S, Florentine C, Sass L, Dickson A, et al. Automated snow cover detection on mountain glaciers using spaceborne imagery and machine learning. The Cryosphere. 2025;19(4):16751693.
- Al-Taher R, Abuarab ME, Ahmed AAS, Helalia SA, Hammad EA, Mokhtar A. Optimizing cotton green water footprint prediction using hybrid machine learning algorithms: a case study of Al-Gezira state, Sudan. Applied Water Science. 2025;15(12):304.
- Anurag M, Anurag O, Singh PK, Singh N, Calay RK. Improving the Prediction of Land Surface Temperature Using Hyperparameter-Tuned Machine Learning Algorithms. Atmosphere. 2025;16(11):1295.
- Bao M, Liu J, Ren H, Liu S, Ren C, Chen C, et al. Research Trends in Wildland Fire Prediction Amidst Climate Change: A Comprehensive Bibliometric Analysis. Forests. 2024;15(7):1197.
- Bour S, Kayhomayoon Z, Hassani F, Milan SG, Bazrafshan O, Berndtsson R. Enhancement of standardized precipitation evapotranspiration index predictions by machine learning based on regression and soft computing for Iran's arid and hyper-arid region. PLoS One. 2025;20(3).
- Campbell AM, Cabrera-Gumbau J, Trinanes J, BakerAustin C, Martinez-Urtaza J. Machine Learning Potential for Identifying and Forecasting Complex Environmental Drivers of Vibrio vulnificus Infections in the United States. Environmental Health Perspectives (Online). 2025;133(1):1-12.
- Clark SR, Fu G, Janardhanan S. Explainable AI for Interpreting Spatiotemporal Groundwater Predictions. Water Resources Research. 2025;61(10):29.
- Daiwei P, Deng Y, Yang SX, Bahram G. Recent Advances in Remote Sensing and Artificial Intelligence for River Water Quality Forecasting: A Review. Environments. 2025;12(5):158.
- Ding Y, Wang M, Fu Y, Wang Q. Forest Smoke-Fire Net (FSF Net): A Wildfire Smoke Detection Model That Combines MODIS Remote Sensing Images with Regional Dynamic Brightness Temperature Thresholds. Forests. 2024;15(5):839.
- Eftekhari M, Abbas Khashei-Siuki. Evaluating machine learning methods for predicting groundwater fluctuations using GRACE satellite in arid and semiarid regions. Journal of Groundwater Science and Engineering. 2025;13(1):5-21.
- Enriquez L, Ortega K, Ccopi D, Rios C, Urquizo J, Patricio S, et al. Detecting Changes in Soil Fertility Properties Using Multispectral UAV Images and Machine Learning in Central Peru. AgriEngineering. 2025;7(3):70.
- Feng L, Ma D, Xie M, Xi M. Review on the Application of Remote Sensing Data and Machine Learning to the Estimation of Anthropogenic Heat Emissions. Remote Sensing. 2025;17(2):200.
- Hamdi M, Alem AE, Goita K. Groundwater Storage Estimation in the Saskatchewan River Basin Using GRACE/GRACE-FO Gravimetric Data and Machine Learning. Atmosphere. 2025;16(1):50.
- Hazhir B, Karem C, Saeid H, Adamchuk VI, Rami A, Md S, et al. Machine Learning-Based Alfalfa Height Estimation Using Sentinel-2 Multispectral Imagery. Remote Sensing. 2025;17(10):1759.
- Islam T, Zeleke EB, Afroz M, Melesse AM. A Systematic Review of Urban Flood Susceptibility Mapping: Remote Sensing, Machine Learning, and Other Modeling Approaches. Remote Sensing. 2025;17(3):524.
- Ji Z, Song H, Lei L, Sheng M, Guo K, Zhang S. A Novel Approach for Predicting Anthropogenic CO2 Emissions Using Machine Learning Based on Clustering of the CO2 Concentration. Atmosphere. 2024;15(3):323.
- Kaiser D, Qu JJ. Detecting Harmful Algae Blooms (HABs) on the Ohio River Using Landsat and Google Earth Engine. Remote Sensing. 2025;17(24):4010.
- Khan K, Shahid NK, Anwar A, Muhammad FK, Junaid AK. Estimating Aboveground Biomass and Carbon Sequestration in Afforestation Areas Using Optical/SAR Data Fusion and Machine Learning. Remote Sensing. 2025;17(5):934.
- Laghari AA, Shen Y, Kumar A, Abro Q, Shen Y, Guo Q. Predicting spatiotemporal changes in flood prone regions using PSO-ML coupling under climate change scenarios. Scientific Reports (Nature Publisher Group). 2025;15(1):42965.
- Li M, Yan Y. Comparative Analysis of MachineLearning Models for Soil Moisture Estimation Using High-Resolution Remote-Sensing Data. Land. 2024;13(8):1331.
- Liu B, Li Y, Ma M, Mao B. A Comprehensive Review of Machine Learning Approaches for Flood Depth Estimation. International Journal of Disaster Risk Science. 2025;16(3):433-445.
- Liu H, Lifu S, Liu X, Pengle C, Wang M, Huang Y. Advancements in Artificial Intelligence Applications for Forest Fire Prediction. Forests. 2025;16(4):704.
- Liu L, Zhou W, Guan K, Peng B, Xu S, Tang J, et al. Knowledge-guided machine learning can improve carbon cycle quantification in agroecosystems. Nature Communications. 2024;15(1):357.
- Liu S, Wang J, Fangxin S, Peng Z, Tianqi A. Research on Multi-Source Precipitation Fusion Based on Classification and Regression Machine Learning Methods-A Case Study of the Min River Basin in the Eastern Source of the Qinghai-Tibet Plateau. Remote Sensing. 2025;17(24):3982.
- Mansourmoghaddam M, Rousta I, Hamidreza GM, Sadeghnejad M, Krzyszczak J, et al. Modeling and Estimating the Land Surface Temperature (LST) Using Remote Sensing and Machine Learning (Case Study: Yazd, Iran). Remote Sensing. 2024;16(3):454.
- Mao C, Zhao Y, Wang L, Yang Z, Kou W, Xu W, et al. Machine learning-enabled UAV hyperspectral identification of tomato spotted wilt virus in tobacco. Frontiers in Plant Science. 2025;16:1728043.
- Melese T, Assefa G, Terefe B, Belay T, Bayable G, Senamew A. Machine learning-based drought prediction using Palmer Drought Severity Index and TerraClimate data in Ethiopia. PLoS One. 2025;20(6).
- Meng Y, Luo Q, Bai B, Li Y. Analysis of spatial heterogeneity in Xi'an's urban heat island effect using multi-source data fusion. PLoS One. 2025;20(10):26.
- Mkuzi HT, Ocansey CM, Justin M, Gulyás Miklós, Penksza Károly, Szilárd S, et al. A Review of Biomass Estimation Methods for Forest Ecosystems in Kenya: Techniques, Challenges, and Future Perspectives. Land. 2025;14(9):1873.
- Mohan S, Kumar B, Nejadhashemi AP. Integration of Machine Learning and Remote Sensing for Water Quality Monitoring and Prediction: A Review. Sustainability. 2025;17(3):998.