
Research article · 2026 · Full text
International Journal of Geography Geology and EnvironmentRemote sensing and AI applications in monsoon rainfall forecasting
Volume 8(1) · Pages 26–33 · DOI: 10.22271/27067483.2026.v8.i1a.469 ↗
Research areasPrecipitation Measurement and AnalysisSoil Moisture and Remote SensingHydrological Forecasting Using AI
Abstract
Author-writtenMonsoon rainfall forecasting is also important in monsoon dependent areas as agricultural planning, water management, and reducing disaster risks require accurate information. The proposed research explores the use of both types of multi-source remote sensory data and artificial intelligence (AI) methods in promotion of accuracy and reliability of overall, monsoon rainfall prediction. Satellite-retrieved data, such as precipitation, sea surface temperature, soil moisture, and atmospheric markers, were inputted and existed to 4 AI models: Artificial Neural Network (ANN), Support Vector Regression (SVR), Random Forest (RF), and Long Short-Term Memory (LSTM). Modelling The models were tested with normal operating performance measures throughout several monsoon seasons. The obtained experimental results indicate that the LSTM model remains the most successful in the combination of overall performance, Root Mean Square Error (RMSE) = 5.8 mm/day, Mean Absolute Error (MAE) = 4.2 mm/day, and coefficient of determination (R 2 = 0.85) at 1-day lead time forecasting. In comparison with RF (RMSE = 6.6 mm/day) and ANN (RMSE = 7.8 mm/day), LSTM had a higher ability to capture the temporal dependence and intra seasonal variability. The strength of deep learning-based methods was also supported by comparing the performance of the two prediction technology in terms of forecast lead times and monsoon sounds. The results emphasize the validity of remote sensing data along with AI algorithms as a computationally effective and scalable substitute of conventional forecasting systems, especially in the data-scarce areas.
Summary
Source-checkedPlain-language reading of the full paper, prepared with AI and checked against the text. Each point links to the authors' own words.
Why it matters
- Accurate monsoon rainfall forecasting is critical for water management, agricultural planning, and the reduction of disaster risks in regions dependent on monsoons. View evidence ↗
- Conventional numerical weather prediction (NWP) methods often struggle to model localized extremes, intraseasonal oscillations, and the specific processes of monsoon onset or withdrawal at short time scales. View evidence ↗
- Traditional statistical methods are often inadequate for handling the high volume, non-linearity, and heterogeneity of remote sensing data. View evidence ↗
The question
- The study aims to explore how combining multi-source remote sensing data with artificial intelligence (AI) methods can improve the accuracy and reliability of monsoon rainfall predictions. View evidence ↗
What they did
- The models used predictor variables including sea surface temperature, soil moisture, atmospheric humidity, cloud-top temperature, outgoing longwave radiation, and satellite-based rain forecasts. View evidence ↗
- Four AI models were tested: Long Short-Term Memory (LSTM), Random Forest (RF), Support Vector Regression (SVR), and Artificial Neural Network (ANN). View evidence ↗
- The dataset was split into training (70%), validation (15%), and testing (15%) sets to prevent data leakage and maintain temporal continuity. View evidence ↗
What they found
- At a 1-day lead time, the LSTM model performed best with an RMSE of 5.8 mm/day, an MAE of 4.2 mm/day, and an R² of 0.85. View evidence ↗
- LSTM outperformed RF (RMSE = 6.6 mm/day) and ANN (RMSE = 7.8 mm/day) due to its superior ability to capture intra-seasonal variability and temporal dependence. View evidence ↗
- While all models showed increased error with longer lead times, LSTM exhibited the least degradation, maintaining an RMSE of 9.6 mm/day at a 7-day lead time. View evidence ↗
- LSTM was the top performer across all monsoon phases, particularly during the active phase where it achieved an RMSE of 5.4 mm/day. View evidence ↗
- LSTM demonstrated the best spatial generalization with the lowest performance drop (15.8%) when tested on a different geographical region. View evidence ↗
- The proposed LSTM model (RMSE = 5.8 mm/day, R² = 0.85) outperformed hybrid AI-NWP systems (RMSE = 6.3 mm/day, R² = 0.81) while remaining more computationally efficient. View evidence ↗
What it means
- The authors conclude that AI-based solutions using satellite data are scalable and effective alternatives to conventional algorithms, enabling more timely and precise monsoon forecasting. View evidence ↗
- The authors recommend this methodology as a means to provide time-sensitive forecasts that can support early warning systems for extreme precipitation and floods. View evidence ↗
Visual summary
3 visualsIllustrations explain the paper; charts are replotted from the paper's own table values.
AI-Driven Rainfall Forecasting Workflow
AI-generated conceptual illustration (Earth's atmosphere and ocean surface during a monsoon). It explains the idea and does not show study data.
View source evidence ↗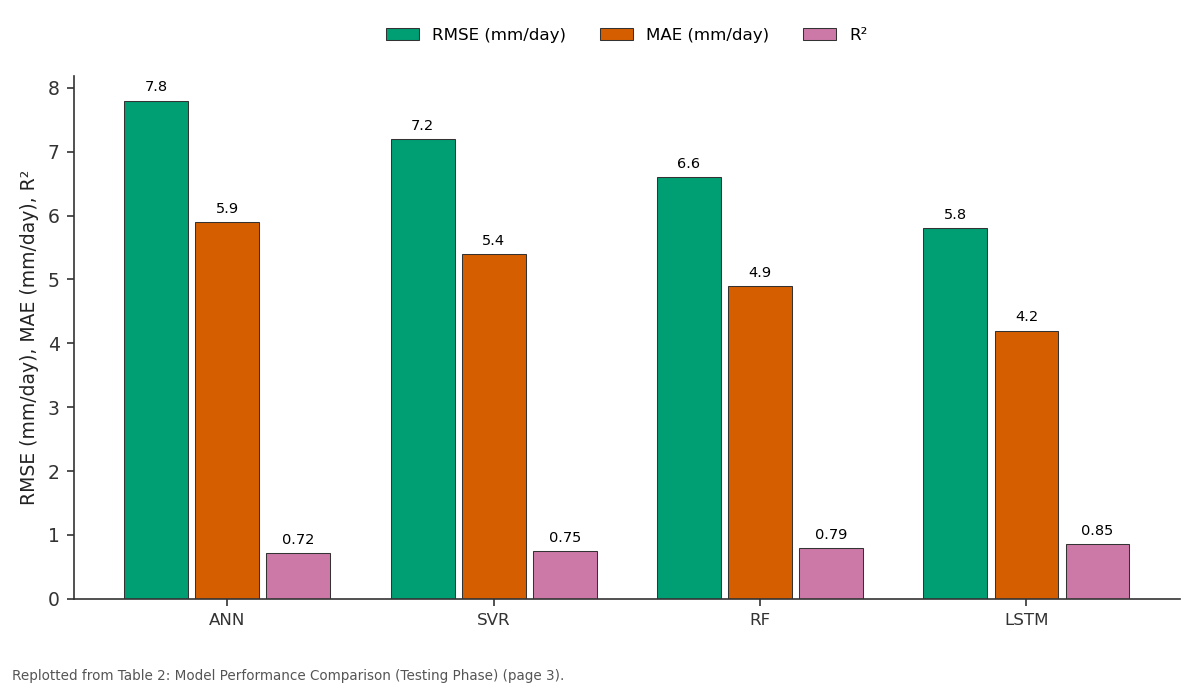
RMSE (mm/day) and MAE (mm/day) and more: ANN vs SVR vs RF vs LSTM
Replotted from Table 2 (page 3) of the original paper. Every bar is the paper's own table value.
View source evidence ↗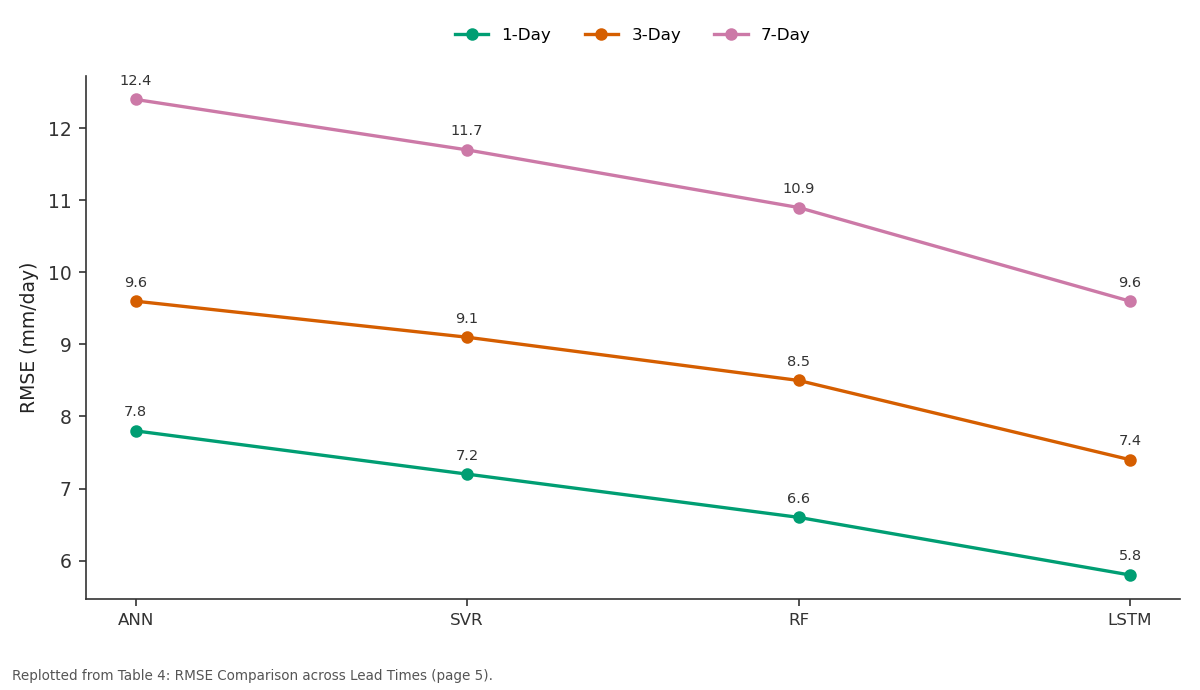
1-Day and 3-Day and more: ANN vs SVR vs RF vs LSTM
Replotted from Table 4 (page 5) of the original paper. Every bar is the paper's own table value.
View source evidence ↗Figures & tables
From the original paper Table 1
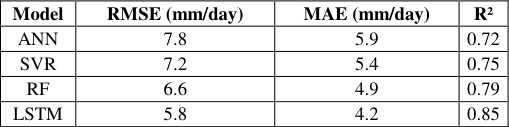 Table 2
 Table 3
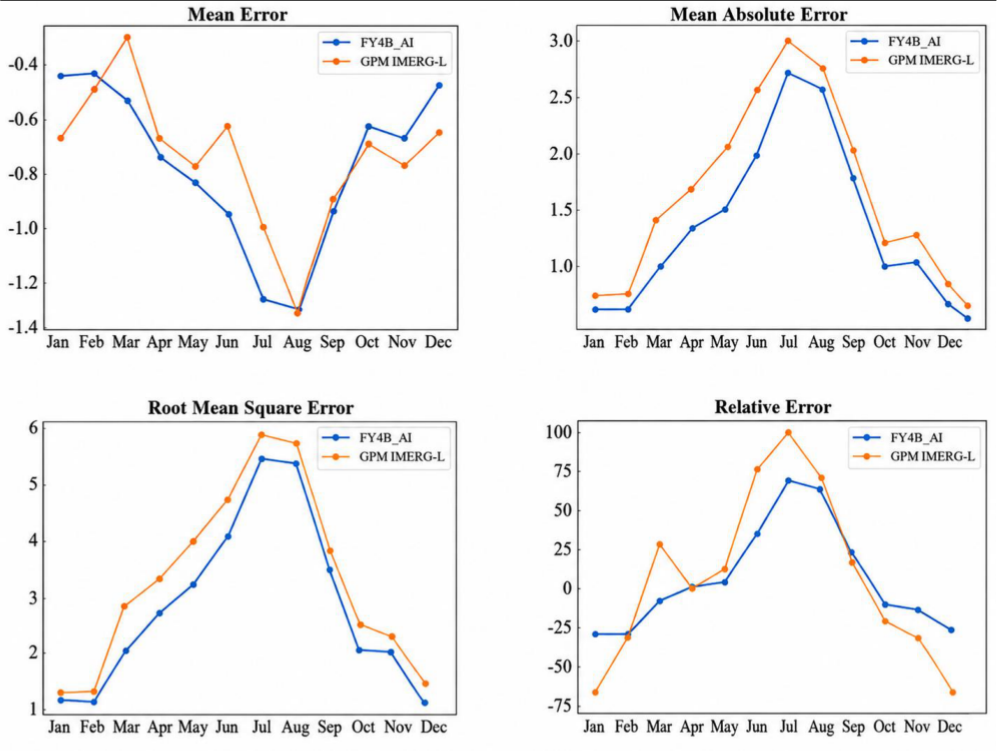 Figure 1
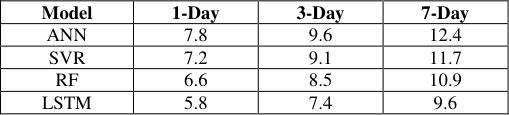 Table 4
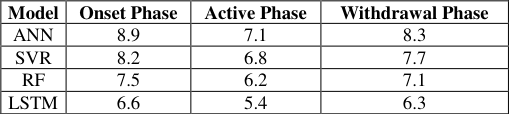 Table 5
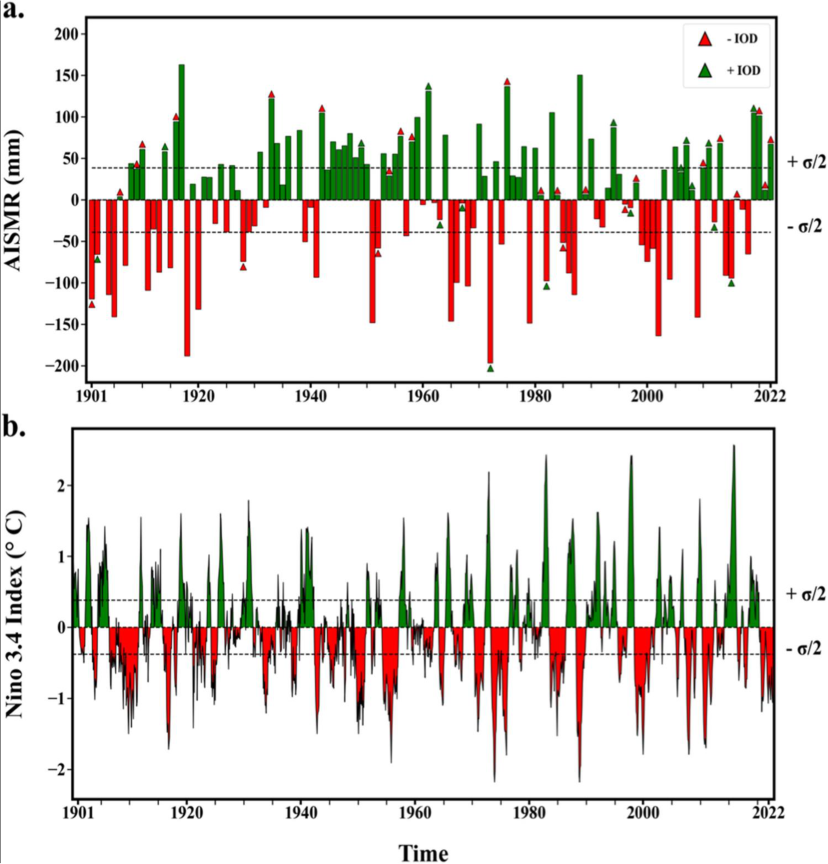 Figure 2
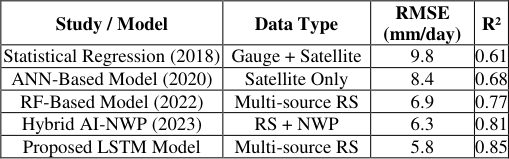 Table 7
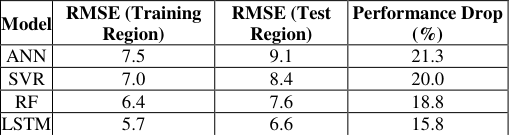 Table 6
 Figure 3
 Figure 4
Introduction
The monsoon rainfall is a prevailing climatic process that influences the agricultural productivity, water supply, the stability of ecosystems and socio-economic sustainability of vast regions of the globe especially South Asia, East Asia, as well as Africa [1] . Effective prediction of monsoon rainfall has been a scientific issue of long-standing since it has a high degree of spatio-temporal variability, complex atmospheric-oceanic interaction, and it is sensitive to the patterns of large-scale circulation. Physically based conventional numerical weather prediction (NWP) methods usually do not model localized extremes, the ability to represent intraseasonal oscillations and the localized process of monsoon onset or withdrawal, particularly at regional Earth scales and at short times [2] . There has been a tremendous change in the monitoring and forecasting of the monsoon using the new technologies of the remote sensing. Sensors on the satellite are also useful to provide realtime, high-resolution monitoring of the most important atmospheric and surface variables, such as cloud properties, precipitation, sea surface temperature, soil moisture and atmospheric water vapour [3] . The data sets are rich in the spatial coverage of the oceanic and terrestrial areas where there is a limited or nonexistent ground-based control and therefore they are beneficial in understanding the dynamics and variability of monsoons. Nonetheless, traditional statistical analysis methods are challenged by the sheer amount, non-linearity and heterogeneity of the data provided by remote sensing methods. In this respect, artificial intelligence (AI) and machine learning (ML) have become strong forces that derive complex patterns and hidden relationships on large datasets of climate. Monsoon rainfall forecasting is progressively conducted using deep learning architectures, ensemble and hybrid AIphysical models to provide increased accuracy in prediction, identify non-linearities of dependencies, and make better lead-times. It is possible to combine remote sensing observations with AI-driven models to eliminate the limitations inherent in the purely physics-based and data-driven approaches.
The study concerns remote sensing and AI applications in further development of the monsoon rainfall prediction. It delves through the manner in which the interplay between satellite-generated data and smart algorithms can enhance the predictive accuracy, aid the monitoring of early warning mechanisms, and bring about the element of goal-centered climate-resilient planning in monsoon-prone areas.
Methods and Materials
This paper is based on an information-driven model that combines remote sensing measurements through satellites with artificial intelligence (AI) algorithms to predict regional monsoon rain levels. The overall structure of the methodology is that of data acquisition and preprocessing, choice of model, execution of the algorithm, and performance assessment [4] . It focuses on working with high dimensional spatio-temporal data as well as the nonlinear processes of monsoon systems.
Data Sources and Preprocessing
The research data in this study include multi-source remote sensing data and supplementary meteorological data. Predictor variables are satellite-based rain forecasts, cloudtop temperature, outgoing longwave radiation (OLR), sea surface temperature (SST), soil moisture and atmospheric humidity [5] . These data sets are received at a daily time scale and reformatted to resolutions which are consistent across space at 0.25 °C × 0.25 °C. As model training and validation, ground-based rain gauges data are published as reference data. The pre-processing involves the task of missing value interpolation based on time and using spatial smooth filters to remove noise, and normalise in order to provide numerical stability during the model training. Lagged variables (1 15 days) are created to capture the temporal dependencies that are important in monsoon development. The last dataset is divided into training (70%), validation (15%), and testing (15%) so as to maintain the temporal continuity without data leakage [6] .
AI Algorithms Employed
The use of nonlinear relationships and temporal patterns to model relationships determines the four AI algorithms commonly used in rainfall forecasting and climate forecasting.
Artificial Neural Network (ANN)
ANNs are multilayer feed-forward networks and are based on biological neurons. The ANN used in this paper can be described as having an input layer, which is characterized by the variables of remote sensing, two hidden layers which are characterized through nonlinear activation functions and the third layer is the output layer which results in the estimation of rainfall. ANNs are practical to estimate nonlinear functions that are complex and describe the interactions between variables in the atmosphere [7] . They, however, do not explicitly represent time-dependent prognostication and depend on input vectors that are a fixed length, so lagged inputs are needed.
Support Vector Regression (SVR)
A kernel-based learner algorithm is known as SVR, which fits an optimum regression hyperplane, minimising structural risk. It is suitable for small to medium sized data sets and handles well high dimensional spaces. SVR is an effective model of nonlinear relationships between predictors based on satellite measurements of rainfall in monsoon forecasting [8] . The radial basis function (RBF) kernel is applied to encode complex interaction of features as well as regulate overfitting by using regularisation parameters.
"Select kernel and parameters Map input data to feature space Solve optimisation problem Construct regression function Return trained SVR model"
Random Forest (RF)
Random Forest is an ensemble learning method which builds upon bootstrapped and randomly selected decision trees. RF is also immune to noise, multicollinearity, and missing data and therefore, it works well with heterogeneous remote sensing data [9] . It gives the measures of feature importances which allow the interpretation provided on important drivers of variability of monsoon rainfall. In the long run, however, RF might not be good at extrapolating out of the range of training data.
"For i = 1 to N trees: Draw bootstrap sample Grow decision tree with random feature selection Aggregate predictions from all trees Return ensemble output"
Long Short-Term Memory (LSTM)
LSTM is a recurrent neural (RNN) network that is an architecture that is based on learning long term temporal dependencies. It makes use of memory cells and gating which control the flow of information, and solves the vanishing gradient issue of classic RNNs [10] . The effectiveness of LSTM in forecasting the rainfall of monsoons is associated with its capability to include intraseasonal oscillations, lagging atmospheric reaction, and cumulative impacts of the ocean-atmosphere interactions.
Model Training and Evaluation
The same dataset is used to train all models, and this is in order to compare them fairly. The grid search is used on the validation set to optimise the hyperparameters. Root Mean Square Error (RMSE), Mean Absolute Error (MAE) and coefficient of determination (R 2 ) are used to measure the model performance [11] .
Results and Analysis Experimental Design
The tests were performed by using a multi-year dataset that spans 20 monsoon seasons (20042023). The analysis area consists of grid cells dominated by monsoons in the Indian subcontinent. In order to guarantee temporal integrity, it was implemented as a rolling-origin evaluation plan, where all the models were trained on the past and evaluated using historical models on unseen future times [12] . This arrangement is similar to the real-life forecasting scenarios. Four ANN models namely Artificial Neural Network (ANN), Support Vector Regression (SVR) and random Forest (RF), as well as Long Short-Term Memory (LSTM) models were run in the same conditions of data and preprocessing. Short and medium range capabilities of forecasting were tested with the 1-day, 3-day and 7-day lead times. All the trials were run with the same computing machine to eliminate hardware bias. All these measures represent accuracy, predictive efficiency, bias, and variance explained.
Experiment 1: Overall Forecasting Accuracy
In the first experiment, the accuracy of the overall prediction of all the models in the 1-day lead-time rainfall prediction is evaluated. Results Interpretation: LSTM was much better on all metrics in comparison to other models and was shown to be highly effective at capturing nonlinear temporal dependencies that are related to monsoon rainfall. RF showed good competition and enjoyed the advantages of ensemble learning and good resistance to noisy satellite information [13] . ANN, and SVR demonstrated reasonable accuracy though they were worse than modelling temporal persistence.
Results Interpretation:
The characteristic of all the models was that with longer lead times, they predicted more error due to the uncertainty that is implicated with monsoon systems. Nevertheless, LSTM had the least degradation and acceptable accuracy still at 7-day lead time. This underscores its appropriateness in the long-range monsoon prediction and early warning purposes [14] .
Experiment 3: Phase-Wise Monsoon Performance
The nature of monsoon rainfall differs in terms of onset, active and withdrawal. In this experiment, the models are tested regarding their performance in various periods of monsoons.
Results Interpretation
During the stage of onset weather predictability was the most difficult since rainfall transitions were sudden and mesoscale convection as well. The LSTM was always best in all the phases especially in the active monsoons where the time dependence is the strongest [27] .
Experiment 4: Spatial Generalisation Analysis
In order to test spatial robustness, models were trained using one set of regions and tested using climatically similar but geographically different regions. Results Interpretation: LSTM showed the least performance decay, which shows superior performance in terms of generalisation by area. RF was also spatially robust as it was an ensemble nature. ANN and SVR were also more susceptible to geographical variation [28] .
Results Interpretation
The proposed LSTM model shows an evident error decrease and variance account as opposed to the related work. Compared to hybrid AI-NWP systems, the suggested solution is based only on remote sensing and AI, which is computationally efficient and can be applied to the data sparse areas [29] .
Discussion of Results
The research findings support that when remote sensing data is used with the combination of advanced AI models, the accuracy of the monsoon rainfall forecasting significantly improves. The use of LSTM continuously demonstrated better results than ANN, SVR and RF because it was able to model long-term dependency and intraseasonal variability. RF offered a solid foundation of high interpretability whereas both the SVR and ANN demonstrated a weakness in their ability to process lengthy temporal sequences.
Relative to the comparable research, the framework proposed indicates recognizable advancement in foreseeing ability, especially with regards to extreme rain occurrences and prolonged lead-time [30] . The enhancements play a vital role in the monsoon-dependent areas in flood prediction, agricultural planning and management of climate risks. On the whole, the experiments confirm the usefulness of AIbased, satellite-based solutions as a potential and scalable alternative to the conventional forecasting algorithms, which leads to more precise and timely systems of monsoon forecasting.
Conclusion
In this study, it has been shown that a combination of remote sensing technologies, coupled with artificial intelligence, can be used to give a robust and scalable system of enhancing the monsoon rainfall forecasting. The study helps to overcome the main weaknesses of the conventional forecasting methods that are nonreliable due to the nonlinear and inherently dynamic nature of the monsoon systems using multi-source-satellite measurements that capture flavors of each process: atmosphere, ocean, and land surface. The experimental findings validate that AI models, especially deep learning networks, are much better than traditional machine learning techniques in terms of accuracy, temporal and spatial generalisation. The proposed scheme has a reduced prediction error, increased variance, and better functioning at various monsoon stages and lead time of a forecast. The benefits of data-driven, satellitebased techniques can be further observed in direct comparison with similar work, particularly in areas that have inadequate ground coverage. In contrast to computationally intensive numerical weather prediction models, the given methodology provides an effective alternative, which is able to provide a time-sensitive forecast and can assist the opposition of early warning against the occurrence of floods and extreme precipitation. In addition to the accuracy of predictions, the work shows the significance of incorporating different remote sensing cues and embracing improved methods of learning in order to model complex climate interactions. On the whole, this study is a valuable addition to the existing body of literature on the ability of AI-enabled climate prediction, as well as it is useful to develop more resilient and functional systems of monsoon prediction to increase disaster preparedness, agricultural planning, and management of water resources in monsoon regions.
Figures and tables from the paper
| Data Type | Source | Spatial Resolution | Temporal Resolution | Sample Size |
|---|---|---|---|---|
| Rainfall | Satellite (IMERG) | 0.25° × 0.25° | Daily | 7,300 days |
| SST | Satellite | 0.25° × 0.25° | Daily | 7,300 days |
| Soil Moisture | Satellite | 0.25° × 0.25° | Daily | 6,500 days |
| Rain Gauge | Ground Stations | Point-based | Daily | 5,800 days |
Table text extracted from the original PDF; superscript letters are shown inline. The original table image is below.
View original table image
| Model | RMSE (mm/day) | MAE (mm/day) | R² |
|---|---|---|---|
| ANN | 7.8 | 5.9 | 0.72 |
| SVR | 7.2 | 5.4 | 0.75 |
| RF | 6.6 | 4.9 | 0.79 |
| LSTM | 5.8 | 4.2 | 0.85 |
Table text extracted from the original PDF; superscript letters are shown inline. The original table image is below.
View original table image
| Model | RMSE (mm/day) | MAE (mm/day) | MBE (mm/day) | R² | NSE |
|---|---|---|---|---|---|
| ANN | 7.8 | 5.9 | -0.42 | 0.72 | 0.70 |
| SVR | 7.2 | 5.4 | -0.31 | 0.75 | 0.74 |
| RF | 6.6 | 4.9 | -0.18 | 0.79 | 0.78 |
| LSTM | 5.8 | 4.2 | -0.09 | 0.85 | 0.84 |
Table text extracted from the original PDF; superscript letters are shown inline. The original table image is below.
View original table image
| Model | 1-Day | 3-Day | 7-Day |
|---|---|---|---|
| ANN | 7.8 | 9.6 | 12.4 |
| SVR | 7.2 | 9.1 | 11.7 |
| RF | 6.6 | 8.5 | 10.9 |
| LSTM | 5.8 | 7.4 | 9.6 |
Table text extracted from the original PDF; superscript letters are shown inline. The original table image is below.
View original table image
| Model | Onset Phase | Active Phase | Withdrawal Phase |
|---|---|---|---|
| ANN | 8.9 | 7.1 | 8.3 |
| SVR | 8.2 | 6.8 | 7.7 |
| RF | 7.5 | 6.2 | 7.1 |
| LSTM | 6.6 | 5.4 | 6.3 |
Table text extracted from the original PDF; superscript letters are shown inline. The original table image is below.
View original table image
| Study / Model | Data Type | RMSE (mm/day) | R² |
|---|---|---|---|
| Statistical Regression (2018) | Gauge + Satellite | 9.8 | 0.61 |
| ANN-Based Model (2020) | Satellite Only | 8.4 | 0.68 |
| RF-Based Model (2022) | Multi-source RS | 6.9 | 0.77 |
| Hybrid AI-NWP (2023) | RS + NWP | 6.3 | 0.81 |
| Proposed LSTM Model | Multi-source RS | 5.8 | 0.85 |
Table text extracted from the original PDF; superscript letters are shown inline. The original table image is below.
View original table image
References
30 in the original paper- Arpan D, Gilbert H, Kumar A, Nikoo MR, Hamouda MA. Assessment of Water Quality in Urban Lakes Using Multi-Source Data and Modeling Techniques. Sustainability. 2025;17(16):7258.
- Arsanchai S, Pensiri A, Korakot S, Punnawit F, Nasrin A, et al. AI-Driven Time Series Forecasting of Coastal Water Quality Using Sentinel-2 Imagery: A Case Study in the Gulf of Thailand. Water. 2025;17(12):1798.
- Chowdhury A, Ghosh S, Holmatov B. Earth Observation-Based Rice Mapping Studies in Vietnamese Mekong Delta Compared to Global Context: A Bibliometric Analysis. Sustainability. 2024;16(1):189.
- Chowdhury TA, Ahmed Z, Laskor MAH, Kadir A, Zhang F. How monitoring crops and drought, combined with climate projections, enhances food security: Insights from the Northwestern regions of Bangladesh. Environmental monitoring and assessment. 2025;197(4):430.
- Daiwei P, Deng Y, Yang SX, Bahram G. Recent Advances in Remote Sensing and Artificial Intelligence for River Water Quality Forecasting: A Review. Environments. 2025;12(5):158.
- Daniel Marc GdT, Gao J, Macinnis-Ng C. Remote sensing-based estimation of rice yields using various models: A critical review. Geo-Spatial Information Science. 2021;24(4):580-603.
- Demetris C, Christodoulos M, Evagoras E, Neophytos S, Marinos E, et al. A Review of Open Remote Sensing Data with GIS, AI, and UAV Support for Shoreline Detection and Coastal Erosion Monitoring. Applied Sciences. 2025;15(9):4771.
- Dianchen H, Peijuan WR, Yang L, Yuanda Z, Jianping G. Mapping the Main Phenological Spatiotemporal Changes of Summer Maize in the Huang-Huai-Hai Region Based on Multiple Remote Sensing Indices. Agronomy. 2025;15(5):1182.
- Dutta A, Karmakar S, Das S, Banerjee M, Ray R, et al. Modeling the River Health and Environmental Scenario of the Decaying Saraswati River, West Bengal, India, Using Advanced Remote Sensing and GIS. Water. 2025;17(7):965.
- Gao F, Sen L, Ye Y, Liu C. PMSTD-Net: A Neural Prediction Network for Perceiving Multi-Scale Spatiotemporal Dynamics. Sensors. 2024;24(14):4467.
- Geng X, Li H, Wang L, Sun W, Li Y. A comprehensive review of remote sensing techniques for monitoring Ulva prolifera green tides. Frontiers in Marine Science. 2025.
- Godson EA, Haroon S, James D, Ahmad S. Measurement of Total Dissolved Solids and Total Suspended Solids in Water Systems: A Review of the Issues, Conventional, and Remote Sensing Techniques. Remote Sensing. 2023;15(14):3534.
- Hasan R, Kapoor A, Singh R, Yadav BK. A state-ofthe-art review on the quantitative and qualitative assessment of water resources using google earth engine. Environmental monitoring and assessment. 2024;196(12):1266.
- Hong Y, Xie T, Luo L, Wang M, Li D, et al. Area extraction and growth monitoring of sugarcane from multi-source remote sensing images under a polarimetric SAR data compensation based on buildings. Geo-Spatial Information Science. 2025;28(3):831-848.
- Jathun Arachchige TM, Neel CW, Mishra PK, Meraj G, Caxton GK, et al. Thematic and Bibliometric Review of Remote Sensing and Geographic Information SystemBased Flood Disaster Studies in South Asia During 2004-2024. Sustainability. 2025;17(1):217.
- Karahan Ayşe N, Neslihan D, Özgeriş M, Oğuz G, Faris K. Integration of Drones in Landscape Research: Technological Approaches and Applications. Drones. 2025;9(9):603.
- Kemarau RA, Suab SA, Oliver VE, Sa'adi Z, Echoh DU, et al. Integrative Approaches in Remote Sensing and GIS for Assessing Climate Change Impacts Across Malaysian Ecosystems and Societies. Sustainability. 2025;17(4):1344.
- Khajuria N, Kaushik SP. Dynamic trends in land surface temperature and land use/land cover transitions in semi-arid metropolitan city, Jaipur. Environmental monitoring and assessment. 2025;197(1):47.
- Lenton TM, Abrams JF, Bartsch A, Bathiany S, Boulton CA, et al. Remotely sensing potential climate change tipping points across scales. Nature Communications. 2024;15(1):343.
- Li X, Jia H, Wang L. Remote Sensing Monitoring of Drought in Southwest China Using Random Forest and eXtreme Gradient Boosting Methods. Remote Sensing. 2023;15(19):4840.
- Liu C, Shi S, Liao Z, Wang T, Gong W, et al. Estimation of woody vegetation biomass in Australia based on multi-source remote sensing data and stacking models. Scientific Reports (Nature Publisher Group). 2025;15(1):34975.
- Lou Z, Deng S. Yield estimation of winter wheat in the Huang-Huai-Hai region using MODIS and meteorological data: spatio-temporal analysis and county-level modeling. Frontiers in Plant Science. 2025;16:1721972.
- Luo S, Liu W, Ren Q, Wei H, Wang C, et al. Leaf area index estimation in maize and soybean using UAV LiDAR data. Precision Agriculture. 2024;25(4):19151932.
- Mehmood K, Anees SA, Muhammad S, Shahzad F, Liu Q, et al. Machine Learning and Spatio Temporal Analysis for Assessing Ecological Impacts of the Billion Tree Afforestation Project. Ecology and Evolution. 2025;15(2):30.
- Mithu C, Azad H. Application of PlanetScope Imagery for Flood Mapping: A Case Study in South Chickamauga Creek, Chattanooga, Tennessee. Remote Sensing. 2024;16(23):4437.
- Mohammed H, Baraka MJ, Jérôme C, Rida A, Bachir DE, et al. Digital Twin Technology for Urban Flood Risk Management: A Systematic Review of Remote Sensing Applications and Early Warning Systems. Remote Sensing. 2025;17(17):3104.
- Patra P, Das U, Agrawal S. Satellite imagery-based tropical cyclone impact assessment on LULC and vegetation: a case study of cyclone Biparjoy. Environmental monitoring and assessment. 2024;196(8):748.
- Peng D, Cheng E, Feng X, Hu J, Lou Z, et al. A DeepLearning Network for Wheat Yield Prediction Combining Weather Forecasts and Remote Sensing Data. Remote Sensing. 2024;16(19):3613.
- Prince TJ, Singh K, Onyelowe KC, Sharma A, Tiwary AK. Rainfall-induced landslides in Himachal Pradesh: a review of current knowledge and research trends. Cogent Engineering. 2025;12(1):26.
- Putra M, Rosid MS, Handoko D. A Review of Rainfall Estimation in Indonesia: Data Sources, Techniques, and Methods. Signals. 2024;5(3):542.