
Research article · 2026 · Full text
International Journal of Biology SciencesSerum ferritin and glycemic control (HbA1c) in type 2 diabetes mellitus: A cross-sectional study
Volume 8(1) · Pages 01–04 · DOI: 10.33545/26649926.2026.v8.i1a.534 ↗
Research areasIron Metabolism and DisordersErythropoietin and Anemia TreatmentAdipokines, Inflammation, and Metabolic Diseases
Abstract
Author-writtenBackground: Insulin resistance and increasing β-cell dysfunction are hallmarks of type 2 diabetes mellitus, a chronic metabolic disease. There is growing evidence that the onset and course of type 2 diabetes may be influenced by iron metabolism, specifically serum ferritin levels. Measuring serum ferritin and iron levels in T2DM patients compared to non-diabetic controls and examining the relationship between these levels and glycemic control (HbA1c) were the goals of this study. Methods: At Al-Sader City Hospital in Iraq, 100 participants 50 T2DM patients and 50 controls took part in a cross-sectional study from March to July 2025. Samples of venous blood were drawn during a fast. Serum ferritin and iron levels were assessed using standard laboratory methods, and HbA1c was determined using EDTA samples. The data was examined using Pearson's correlation and Student's t-test; p
Summary
Source-checkedPlain-language reading of the full paper, prepared with AI and checked against the text. Each point links to the authors' own words.
Why it matters
- Diabetes mellitus is a chronic metabolic disorder defined by persistent high blood sugar levels caused by issues with insulin secretion or action. View evidence ↗
- Ferritin is a protein that manages iron balance in the body by controlling how iron is stored and released. View evidence ↗
- Imbalances in iron metabolism and ferritin levels are associated with inflammation and oxidative stress, which can aggravate insulin resistance and pancreatic cell dysfunction. View evidence ↗
What they did
- The cross-sectional study took place at Al-Sader City Hospital in Iraq from March to July 2025, involving 100 participants split equally between T2DM patients and non-diabetic controls. View evidence ↗
- Blood samples were collected from participants during a fast between 8:00 and 10:00 a.m. View evidence ↗
- Serum ferritin levels were determined using ELISA kits. View evidence ↗
- The researchers used Student's t-tests for group comparisons and Pearson's correlation coefficient to analyze the relationship between ferritin and HbA1c. View evidence ↗
What they found
- Diabetic patients had significantly higher serum ferritin levels (65.67 ± 10.40 ng/mL) compared to the control group (34.11 ± 6.31 ng/mL). View evidence ↗
- HbA1c levels were significantly higher in the diabetes group (7.87 ± 1.74%) than in the control group (4.56 ± 1.49%). View evidence ↗
- There was no statistically significant correlation between serum ferritin and HbA1c in either the control group (r = 0.22) or the diabetic group (r = -0.17). View evidence ↗
What it means
- The authors conclude that higher ferritin levels in diabetic patients likely reflect metabolic stress or inflammation rather than direct glycemic management. View evidence ↗
- The authors state that serum ferritin is not a reliable measure for monitoring glycemic management. View evidence ↗
- The authors recommend future research with larger sample sizes and the inclusion of inflammatory markers to better understand the link between iron metabolism and diabetes. View evidence ↗
Visual summary
1 visualsIllustrations explain the paper; they do not show study data.
Relationship between Ferritin and HbA1c
AI-generated conceptual illustration (human blood serum and red blood cells). It explains the idea and does not show study data.
View source evidence ↗Figures & tables
From the original paper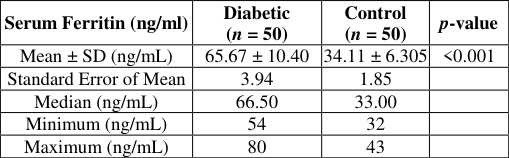 Table 1
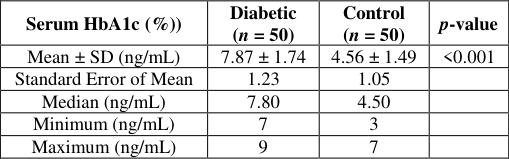 Table 2
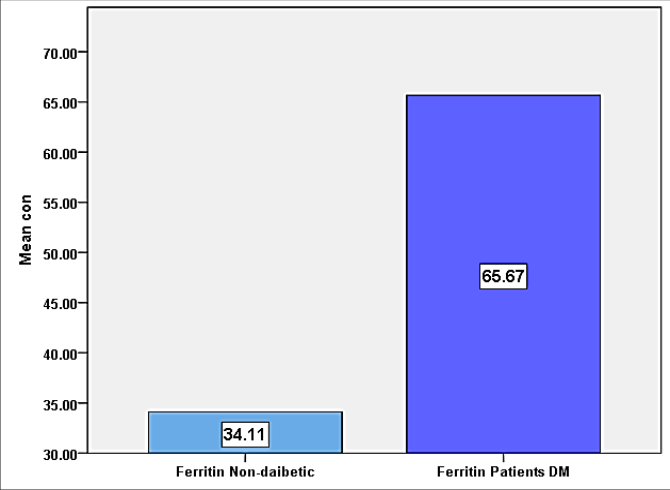 Figure 1
 Table 3
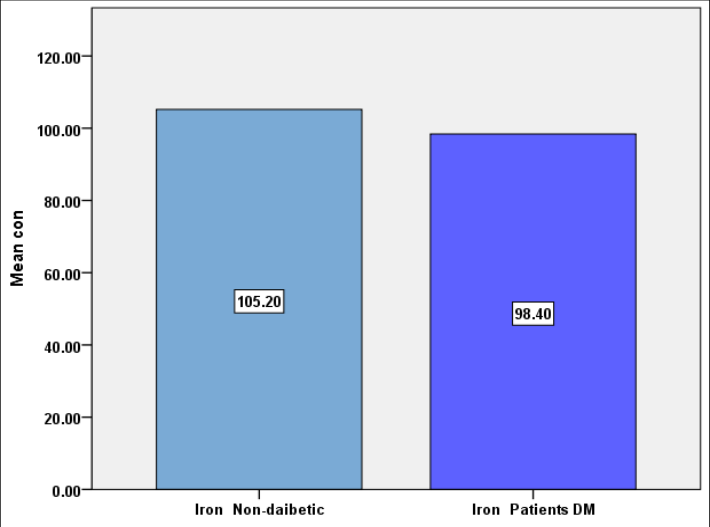 Figure 2
Introduction
Diabetes mellitus (DM) represents a persistent metabolic disorder characterized by chronic hyperglycemia arising from impairments in insulin secretion, insulin action, or both [1] . Among its various types, type 2 diabetes mellitus (T2DM) is the most prevalent form, primarily resulting from insulin resistance coupled with progressive pancreatic β-cell dysfunction [2] Unlike type 1 diabetes, which is largely autoimmune in nature, T2DM arises from a complex interplay between genetic predisposition and environmental factors, including obesity, sedentary lifestyle, and dietary habits [3] . This combination causes persistent hyperglycemia and a slow deterioration in β-cell function, which can lead to longterm issues with the neurological, renal, and cardiovascular systems [4] . T2DM development is influenced by multiple genetic loci, including TCF7L2 and KCNJ11, which modulate glucose metabolism and insulin secretion [5] . However, lifestyle-related risk factors such as excessive caloric intake and physical inactivity play a central role in its increasing prevalence worldwide [6] . Compensatory hyperinsulinemia is first brought on by insulin resistance, especially in skeletal muscle, adipose tissue, and the liver. Persistent metabolic stress eventually damages β-cell function, resulting in chronic hyperglycemia and inadequate insulin production [7] . Ferritin, an iron-binding protein, plays a crucial role in maintaining systemic iron homeostasis by storing and releasing iron in a controlled manner [8,9] . Ferritin and iron metabolism dysregulation has been linked to oxidative stress and inflammation, which are known to worsen insulin resistance and β-cell dysfunction.
People who are more likely to acquire type 2 diabetes have higher blood ferritin levels, which may indicate that iron excess plays a part in the pathogenesis of the disease [10] . Given the increasing prevalence of type 2 diabetes and its aftereffects worldwide, it is nevertheless essential to comprehend both modifiable and non-modifiable risk factors. Analyzing the relationship between ferritin levels and type 2 diabetes may reveal information on early diagnosis methods and preventative strategies. Clarifying the link between iron metabolism, insulin resistance, and pancreatic β-cell activity may produce a helpful biomarker for identifying high-risk individuals and devising specific treatments to slow the course and effects of the disease [3,7] . In conclusion, type 2 diabetes is a complicated illness that is impacted by genetic, environmental, and metabolic factors. The pathophysiology of type 2 diabetes may involve ferritin and iron homeostasis, which highlights the need for comprehensive study to clarify their molecular relationships, improve risk assessment, and direct preventive and therapeutic approaches for this increasingly prevalent metabolic disease [11,9] .
Methods
Methods
Study Design and Subjects
This study was conducted at Al-Sader City Hospital in Iraq between March and July of 2025. The 100 participants were divided into 50 patients with type 2 diabetes mellitus (T2DM) and 50 non-diabetic controls. All subjects were matched for age and gender and had HbA1c values more than 6.2% in order to reduce confounding variables. Each participant provided informed consent prior to sample collection.
Blood Sample Collection
Venous blood samples (5 mL) were drawn from each participant between 8:00 and 10:00 a.m. after an overnight fast. The blood was divided as follows: Use 2 mL in EDTA tubes to estimate HbA1c. After serum separation, 3 mL are placed in gel tubes for ferritin testing. Gel tubes were allowed to coagulate for half an hour at room temperature before being centrifuged for five minutes at 3000 rpm. The separated serum was placed in 1.5 mL Eppendorf tubes and stored at -20 °C before analysis. EDTA tubes were processed immediately for HbA1c testing.
Serum Ferritin Measurement
Ferritin levels were measured using enzyme-linked immunosorbent assay (ELISA) kits according to the manufacturer's protocol. All samples were analyzed in duplicate to ensure accuracy.
Statistical Analysis
Data were expressed as mean ± standard deviation (SD). Comparisons between diabetic and control groups were performed using Student's t-test. Correlations between ferritin levels and HbA1c were assessed using Pearson's correlation coefficient. A p-value ≤ 0.05 was considered statistically significant. Statistical analyses were performed using SPSS version 21.0 [12] .
Results
Results
Discussion
This study examined serum ferritin and HbA1c levels in diabetic patients in comparison with non-diabetic individuals, with particular attention to the possible relationship between iron status and glycemic control. The results demonstrated clear differences between the two groups, whereas no statistically significant association was observed between ferritin and HbA1c within each group. Serum ferritin concentrations were significantly higher in diabetic patients than in the control group. In addition to serving as an acute-phase reactant that rises in response to inflammatory circumstances, ferritin is commonly considered an indication of body iron reserves [13] Diabetes mellitus frequently causes chronic low-grade inflammation and metabolic stress, which may raise ferritin levels in those who have the condition [14] . Furthermore, excess iron has been reported to promote insulin resistance through oxidative stress and impaired insulin signaling pathways [15] . Concurrently, the HbA1c values of the diabetic group were significantly higher, suggesting that these patients had inadequate long-term glycemic management. HbA1c is still crucial for identifying and monitoring diabetes mellitus because it is a trustworthy measure of average blood glucose levels during the preceding two to three months [16] . both values were significantly higher in diabetic patients, correlation analysis did not reveal a meaningful relationship between ferritin and HbA1c. The diabetic group displayed a weak negative correlation, whereas the control group displayed a faint positive correlation. Similar findings from earlier studies indicate that ferritin rise in diabetes does not necessarily correlate with glycemic control as determined by HbA1c [17,18] . The lack of a significant correlation may be explained by the multifactorial regulation of ferritin levels. Factors such as inflammatory status, liver function, obesity, and subclinical infections may influence ferritin concentrations independently of glucose metabolism [19] . Therefore, ferritin may be more suggestive of inflammatory or metabolic stress than it is of long-term glycaemic control. Overall, the findings demonstrate that diabetic individuals have significantly higher serum ferritin and HbA1c levels than non-diabetic controls. However, the lack of a significant correlation between these two markers suggests that iron metabolism alterations in diabetes may occur independently of glycaemic control. Further studies utilizing inflammatory markers and larger sample sizes are required to fully comprehend this connection.
Conclusion
The current investigation revealed significantly higher serum ferritin and HbA1c levels in diabetic patients compared to non-diabetic controls, indicating altered iron metabolism and poor glycaemic control in individuals with diabetes mellitus. Despite these considerable differences between the two groups, there was no statistically significant correlation between serum ferritin and HbA1c in either the diabetes or non-diabetic patients. These findings suggest that elevated ferritin levels in diabetics may be a sign of underlying inflammatory or metabolic conditions rather of being directly related to long-term glycaemic control. Consequently, serum ferritin cannot be regarded as a trustworthy measure for glycaemic management as determined by HbA1c, but it may be a sign of metabolic stress or inflammation in diabetes mellitus. Further studies with larger sample sizes and inclusion of inflammatory markers are recommended to better clarify the complex relationship between iron metabolism and diabetes mellitus.
Figures and tables from the paper
| Serum Ferritin (ng/ml) | Diabetic (n = 50) | Control (n = 50) | p-value |
|---|---|---|---|
| Mean ± SD (ng/mL) | 65.67 ± 10.40 | 34.11 ± 6.305 | <0.001 |
| Standard Error of Mean | 3.94 | 1.85 | |
| Median (ng/mL) | 66.50 | 33.00 | |
| Minimum (ng/mL) | 54 | 32 | |
| Maximum (ng/mL) | 80 | 43 |
Table text extracted from the original PDF; superscript letters are shown inline. The original table image is below.
View original table image
| Serum HbA1c (%)) | Diabetic (n = 50) | Control (n = 50) | p-value |
|---|---|---|---|
| Mean ± SD (ng/mL) | 7.87 ± 1.74 | 4.56 ± 1.49 | <0.001 |
| Standard Error of Mean | 1.23 | 1.05 | |
| Median (ng/mL) | 7.80 | 4.50 | |
| Minimum (ng/mL) | 7 | 3 | |
| Maximum (ng/mL) | 9 | 7 |
Table text extracted from the original PDF; superscript letters are shown inline. The original table image is below.
View original table image
| Group | r (Pearson) | p-value | Interpretation |
|---|---|---|---|
| Diabetic | −0.17 | 0.49 | Weak, not significant |
| Control | +0.22 | 0.38 | Weak, not significant |
Table text extracted from the original PDF; superscript letters are shown inline. The original table image is below.
View original table image
References
19 in the original paper- Sarkar BK, et al. Diabetes mellitus: a comprehensive review. J Pharmacogn Phytochem. 2019;8(6):23622371.
- Eizirik DL, Pasquali L, Cnop M. Pancreatic β-cells in type 1 and type 2 diabetes mellitus: different pathways to failure. Nat Rev Endocrinol. 2020;16(7):349-362. International Journal of Biology Sciences https://www.biologyjournal.net
- Ogrotis I, Koufakis T, Kotsa K. Changes in the global epidemiology of type 1 diabetes in an evolving landscape of environmental factors: causes, challenges, and opportunities. Medicina (B Aires). 2023;59(4):668.
- Babel RA, Dandekar MP. A review on cellular and molecular mechanisms linked to the development of diabetes complications. Curr Diabetes Rev. 2021;17(4):457-473.
- Blanken CPS, Bayer S, Buchner Carro S, Hauner H, Holzapfel C. Associations between TCF7L2, PPARγ, and KCNJ11 genotypes and insulin response to an oral glucose tolerance test: a systematic review. Mol Nutr Food Res. 2025;69(3):e202400561.
- Bankura B, Pattanayak AK, Ghosh S, Guria S, Sinha A, Das M. Implication of KCNJ11 and TCF7L2 gene variants for the predisposition of type 2 diabetes mellitus in West Bengal, India. Diabetes Epidemiol Manag. 2022;6:100066.
- Zhao X, An X, Yang C, Sun W, Ji H, Lian F. The crucial role and mechanism of insulin resistance in metabolic disease. Front Endocrinol (Lausanne). 2023;14:1149239.
- Zhang N, Yu X, Xie J, Xu H. New insights into the role of ferritin in iron homeostasis and neurodegenerative diseases. Mol Neurobiol. 2021;58(6):2812-2823.
- Miao R, Fang X, Zhang Y, Wei J, Zhang Y, Tian J. Iron metabolism and ferroptosis in type 2 diabetes mellitus and complications: mechanisms and therapeutic opportunities. Cell Death Dis. 2023;14(3):186.
- Sobieska K, Buczyńska A, Krętowski AJ, PopławskaKita A. Iron homeostasis and insulin sensitivity: unraveling the complex interactions. Rev Endocr Metab Disord. 2024;25(5):925-939.
- Marku A, Galli A, Marciani P, Dule N, Perego C, Castagna M. Iron metabolism in pancreatic beta-cell function and dysfunction. Cells. 2021;10(11):2841.
- Al-Janabi DRA, Shallani YA, Albakaa LAD, Aljanaby AAJ. Prevalence of types of cancer in Najaf Governorate and comparison of leukemia with other types. J Biomed Biosens. 2024;4(2):1-10.
- Wang W, Knovich MA, Coffman LG, Torti FM, Torti SV. Serum ferritin: past, present and future. Biochim Biophys Acta Gen Subj. 2010;1800(8):760-769.
- Fernández-Real JM, López-Bermejo A, Ricart W. Cross-talk between iron metabolism and diabetes. Diabetes. 2002;51(8):2348-2354.
- Simcox JA, McClain DA. Iron and diabetes risk. Cell Metab. 2013;17(3):329-341.
- Zhang Y, et al. Irisin stimulates browning of white adipocytes through mitogen-activated protein kinase p38 MAP kinase and ERK MAP kinase signaling. Diabetes. 2014;63(2):514-525.
- Sharifi FAS, Sazandeh SH. Serum ferritin in type 2 diabetes mellitus and its relationship with HbA1c. 2004.
- Jehn M, Clark JM, Guallar E. Serum ferritin and risk of the metabolic syndrome in US adults. Diabetes Care. 2004;27(10):2422-2428.
- Dignass A, Farrag K, Stein J. Limitations of serum ferritin in diagnosing iron deficiency in inflammatory conditions. Int J Chronic Dis. 2018;2018:9394060.