
Research article · 2025 · Full text
International Journal of Geography Geology and EnvironmentDelineation of groundwater potential zones in Vadipatti Taluk, Madurai district, Tamil Nadu using geospatial technology and analytical hierarchy process
Volume 7(12) · Pages 64–74 · DOI: 10.22271/27067483.2025.v7.i12a.462 ↗
Research areasGroundwater and Watershed AnalysisGeophysical and Geoelectrical MethodsGeochemistry and Geologic Mapping
Abstract
Author-writtenGroundwater resource management in hard rock terrains presents significant challenges due to complex hydrogeological conditions and water scarcity. This study presents an integrated geospatial approach to delineate groundwater potential zones (GWPZs) in Vadipatti Taluk, Madurai District, Tamil Nadu, India. Seven thematic layers Geology, Geomorphology, Slope, Soil texture, Lineament density, Land use/Land cover (LULC) and Tank buffer, were derived from remote sensing data, topographic maps and secondary sources. The analytical hierarchy process (AHP) was employed to assign weights to each parameter based on hydrogeological significance. Weighted overlay analysis in ArcGIS 10 produced a groundwater potential map classified into five categories: Very High (42 km²), High (153 km²), Moderate (169 km²), Low (80 km²) and Very Low (17 km²). Results indicate that fluvial geomorphic units and areas proximal to water bodies exhibit the highest groundwater potential, while structural hills and elevated terrain show limited potential due to high surface runoff. These findings provide critical information for optimizing groundwater exploration, developing water harvesting structures, and planning sustainable water resource management in the region.
Summary
Source-checkedPlain-language reading of the full paper, prepared with AI and checked against the text. Each point links to the authors' own words.
Why it matters
- Managing groundwater in hard rock terrains is difficult because of water scarcity and complex hydrogeological conditions. View evidence ↗
- The varied nature of hard rock aquifers makes exploration difficult, and high drilling costs create a need for cost-effective, scientific methods to find potential water zones. View evidence ↗
- In India, water scarcity is worsening due to increased demand from population growth, industry, tourism, and agricultural irrigation. View evidence ↗
The question
- The study aims to map groundwater potential zones (GWPZs) in Vadipatti Taluk, Madurai District, Tamil Nadu, using an integrated geospatial approach. View evidence ↗
What they did
- The researchers used seven thematic layers: geology, geomorphology, slope, soil texture, lineament density, land use/land cover (LULC), and tank buffer. View evidence ↗
- The analytical hierarchy process (AHP) was used to assign weights to the parameters based on their hydrogeological importance. View evidence ↗
- A groundwater potential map was created using weighted overlay analysis in ArcGIS 10, dividing the area into five potential categories. View evidence ↗
What they found
- Very High Potential Zones cover 42 km² and are concentrated along the Vaigai River valley in the Sholavandan region. View evidence ↗
- High Potential Zones cover 153 km² and are found in northeastern regions near Alanganallur, characterized by ponds, surface tanks, and irrigation canals. View evidence ↗
- Moderate Potential Zones cover 169 km² and are spread across the southern and central regions. View evidence ↗
- Low Potential Zones cover 80 km² and are primarily located in the eastern part of Vadipatti taluk. View evidence ↗
- Very Low Potential Zones cover 17 km² and are found in elevated, mountainous areas with steep slopes and high surface runoff. View evidence ↗
What it means
- The authors recommend prioritizing the High and Very High potential zones (195 km², or 42.1% of the area) for systematic well drilling. View evidence ↗
- Moderate potential zones (169 km²) are recommended for the installation of artificial recharge structures like check dams and percolation tanks to improve monsoon infiltration. View evidence ↗
- A limitation of the study is that the potential map was not validated with water table measurements or bore well yield data because field data was limited. View evidence ↗
Visual summary
3 visualsIllustrations explain the paper; charts are replotted from the paper's own table values.
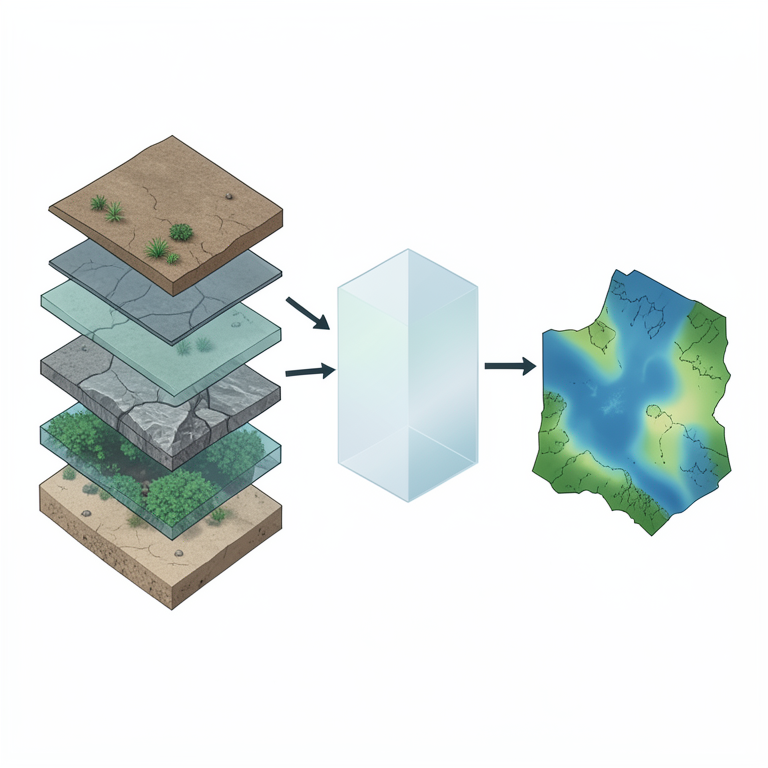
AHP Mapping Workflow
AI-generated conceptual illustration (A geographical landscape of Vadipatti Taluk, Madurai district, Tamil Nadu). It explains the idea and does not show study data.
View source evidence ↗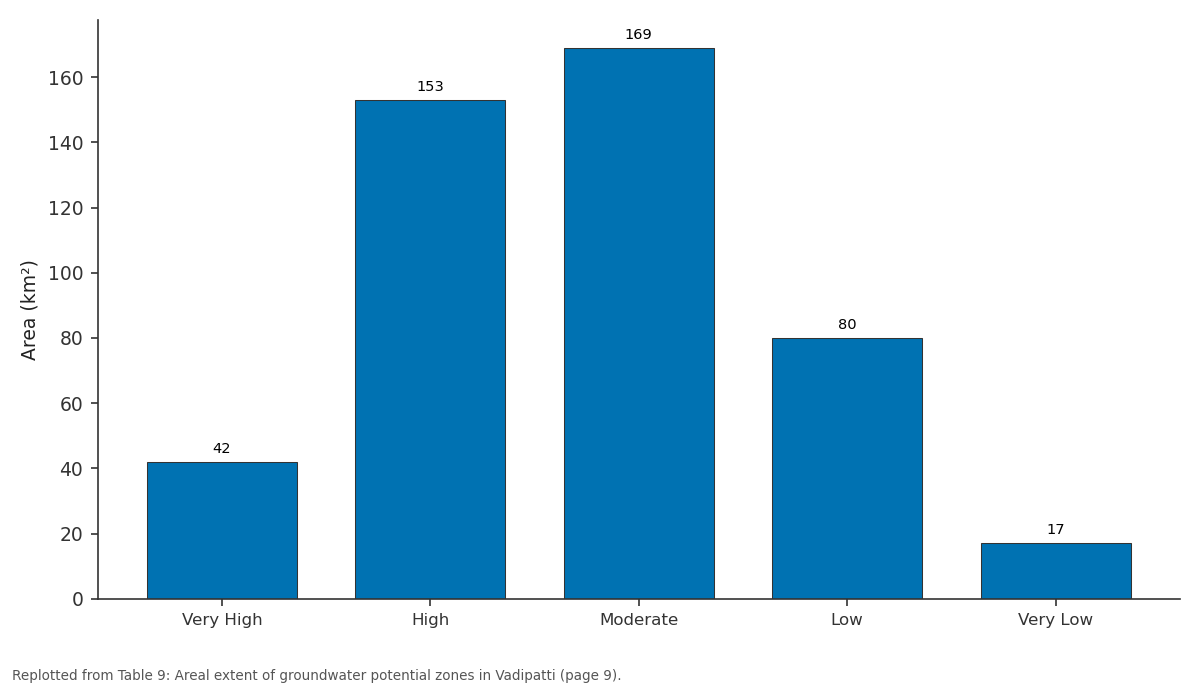
Area (km²): Very High vs High vs Moderate vs Low vs Very Low
Replotted from Table 9 (page 9) of the original paper. Every bar is the paper's own table value.
View source evidence ↗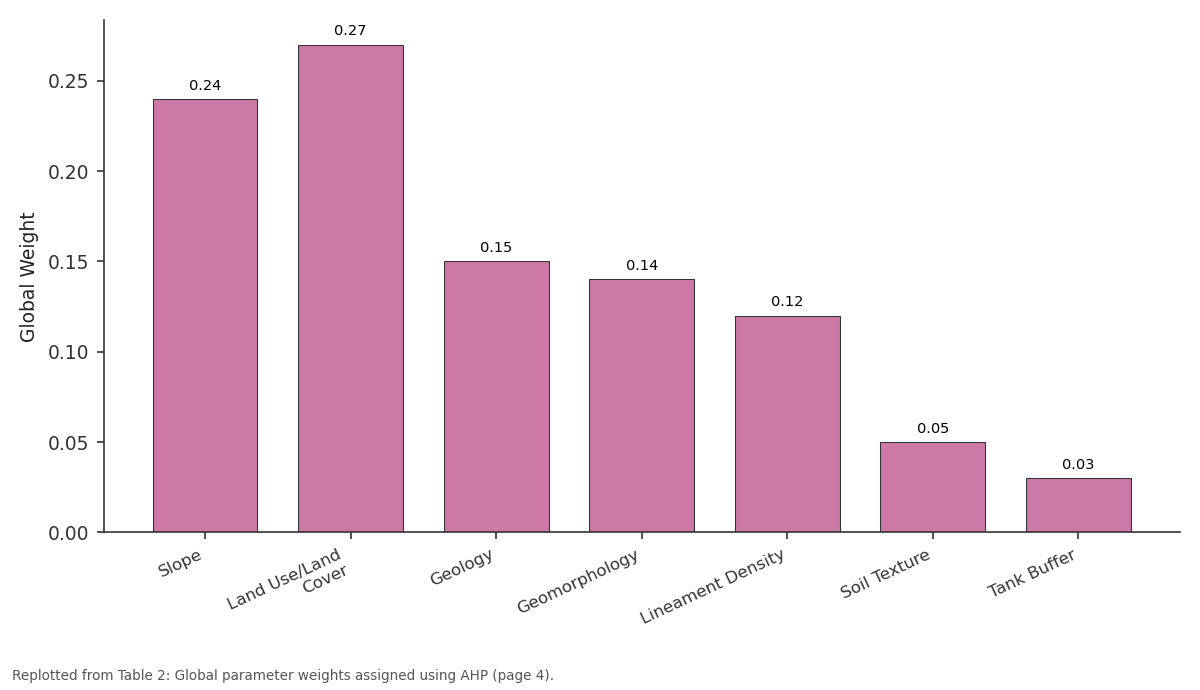
Global Weight: Slope vs Land Use/Land Cover vs Geology vs Geomorphology vs Lineament Density
Replotted from Table 2 (page 4) of the original paper. Every bar is the paper's own table value.
View source evidence ↗Figures & tables
From the original paper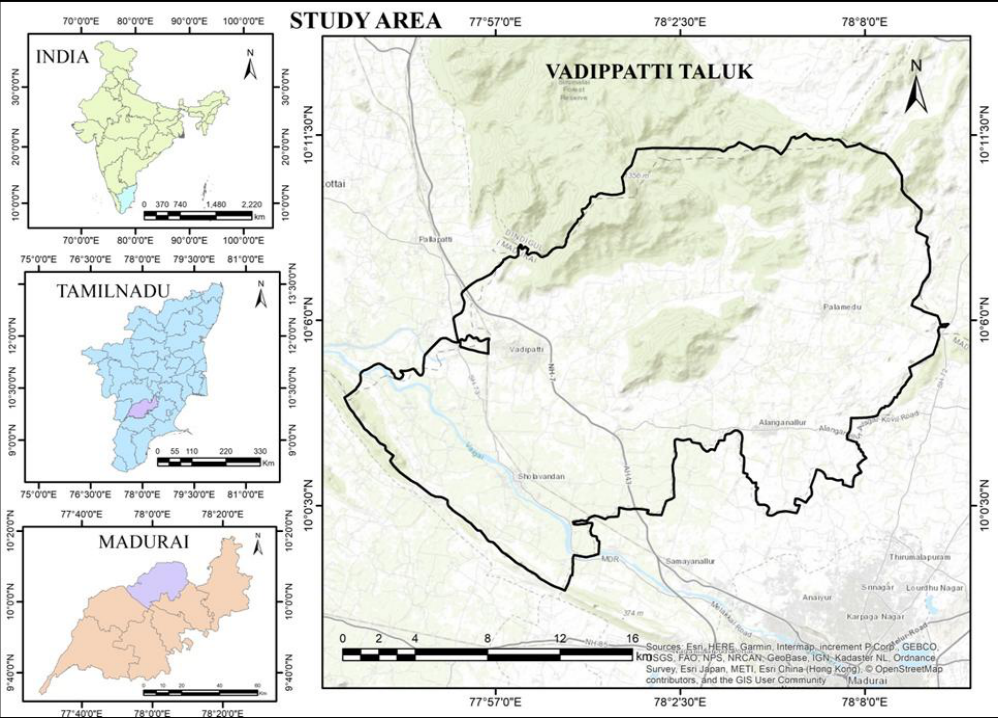 Figure 1
 Table 1
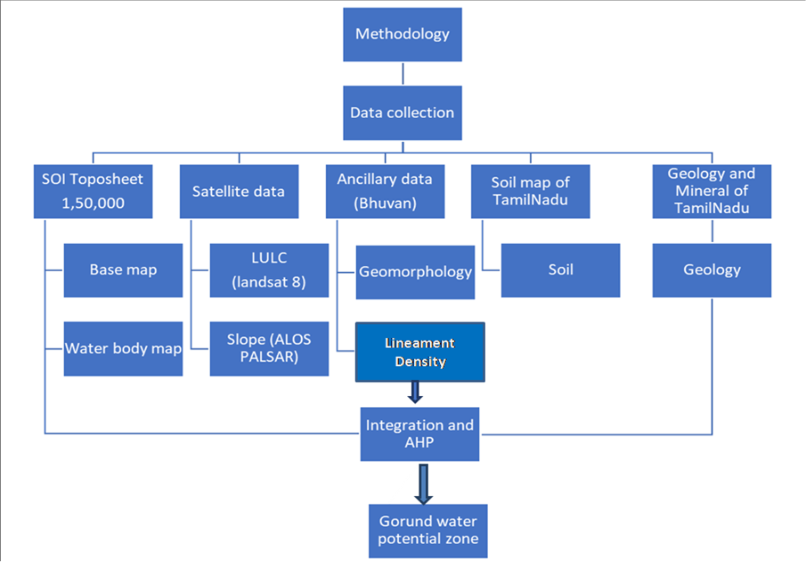 Figure 2
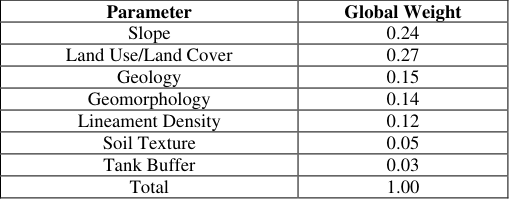 Table 2
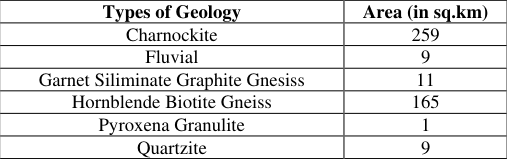 Table 3
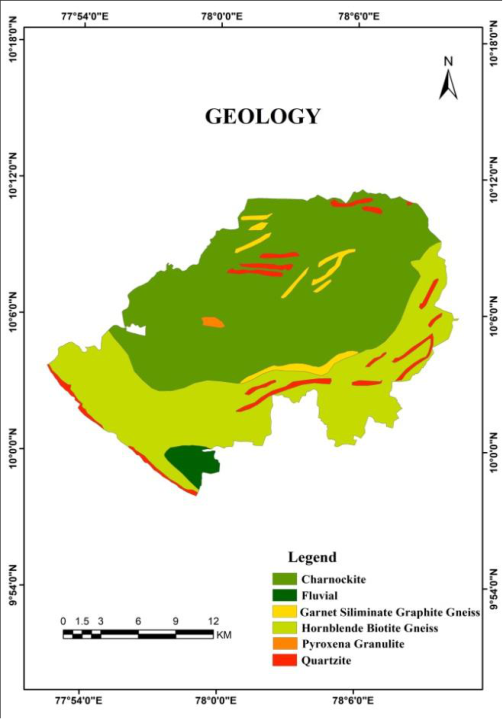 Figure 3
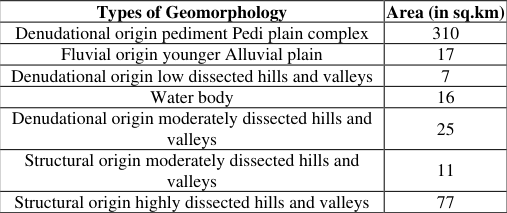 Table 4
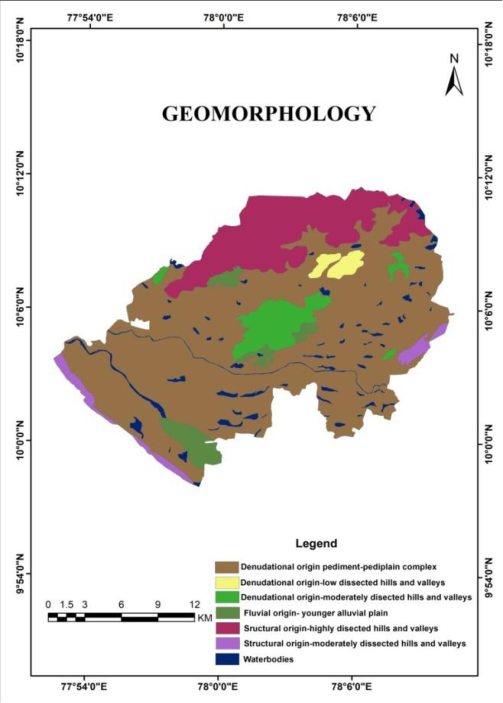 Figure 4
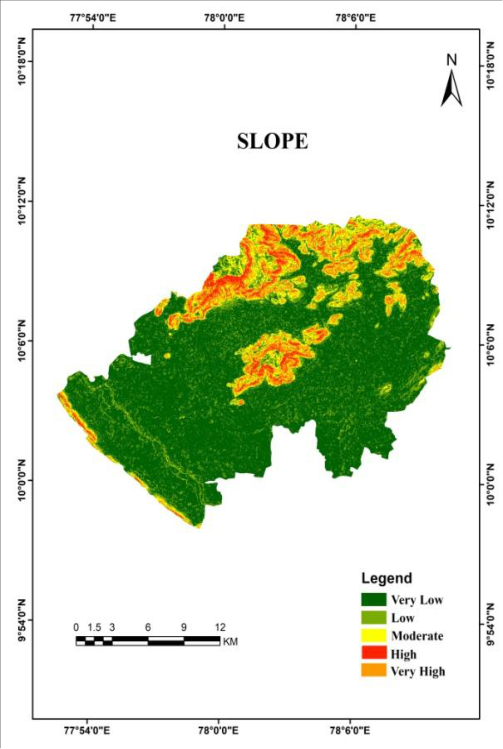 Figure 5
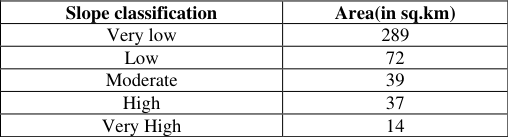 Table 5
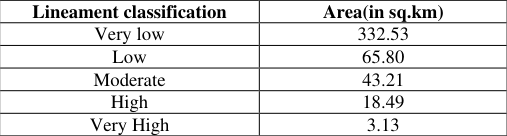 Table 6
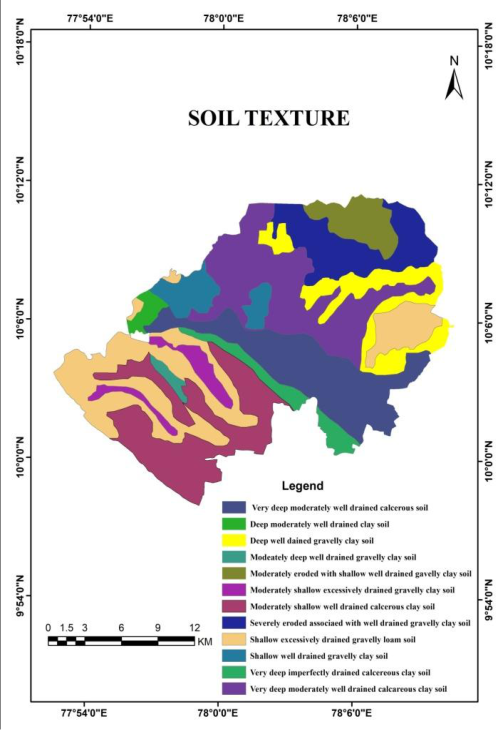 Figure 6
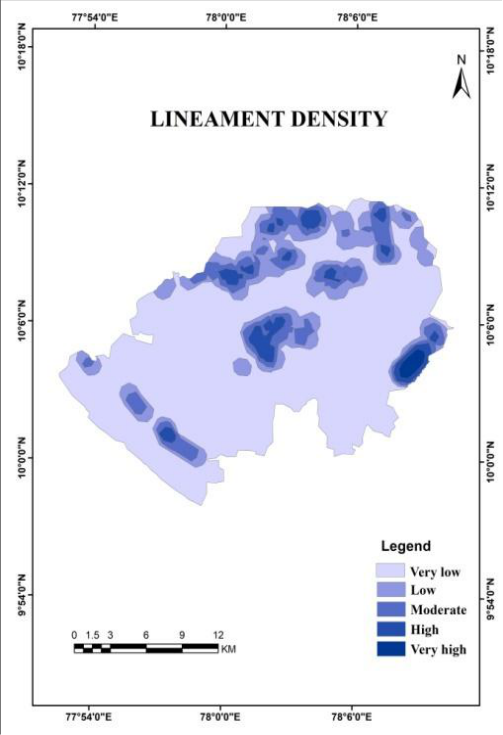 Figure 7
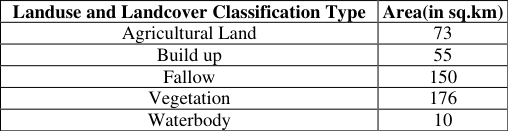 Table 7
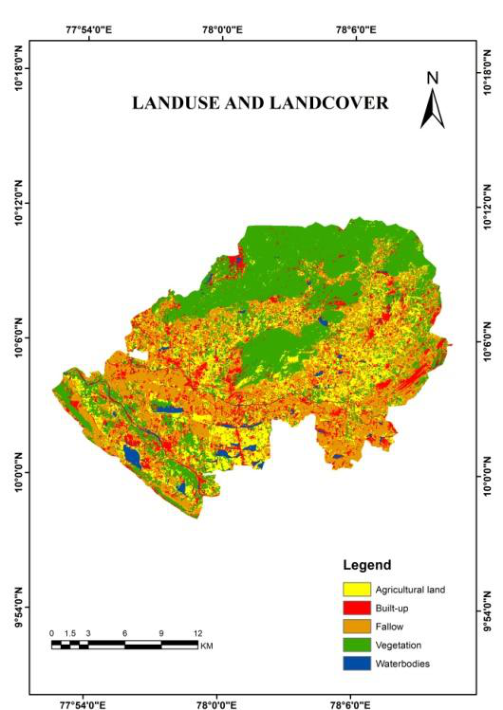 Figure 8
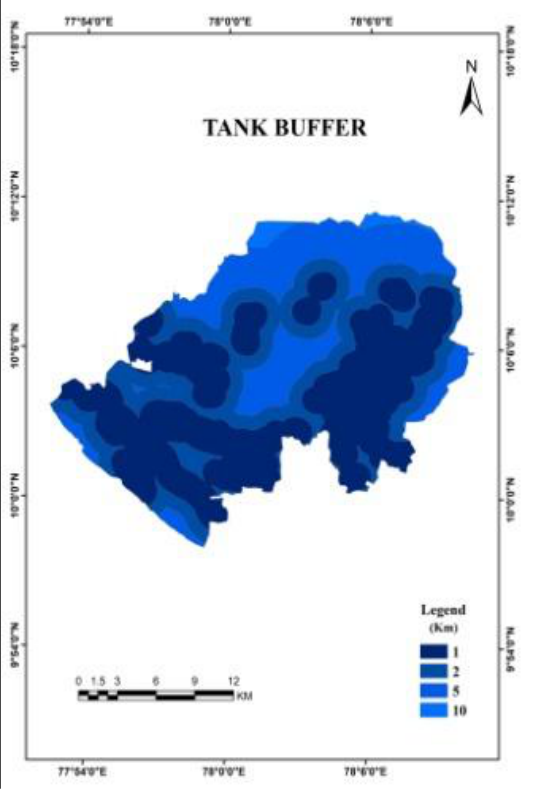 Figure 9
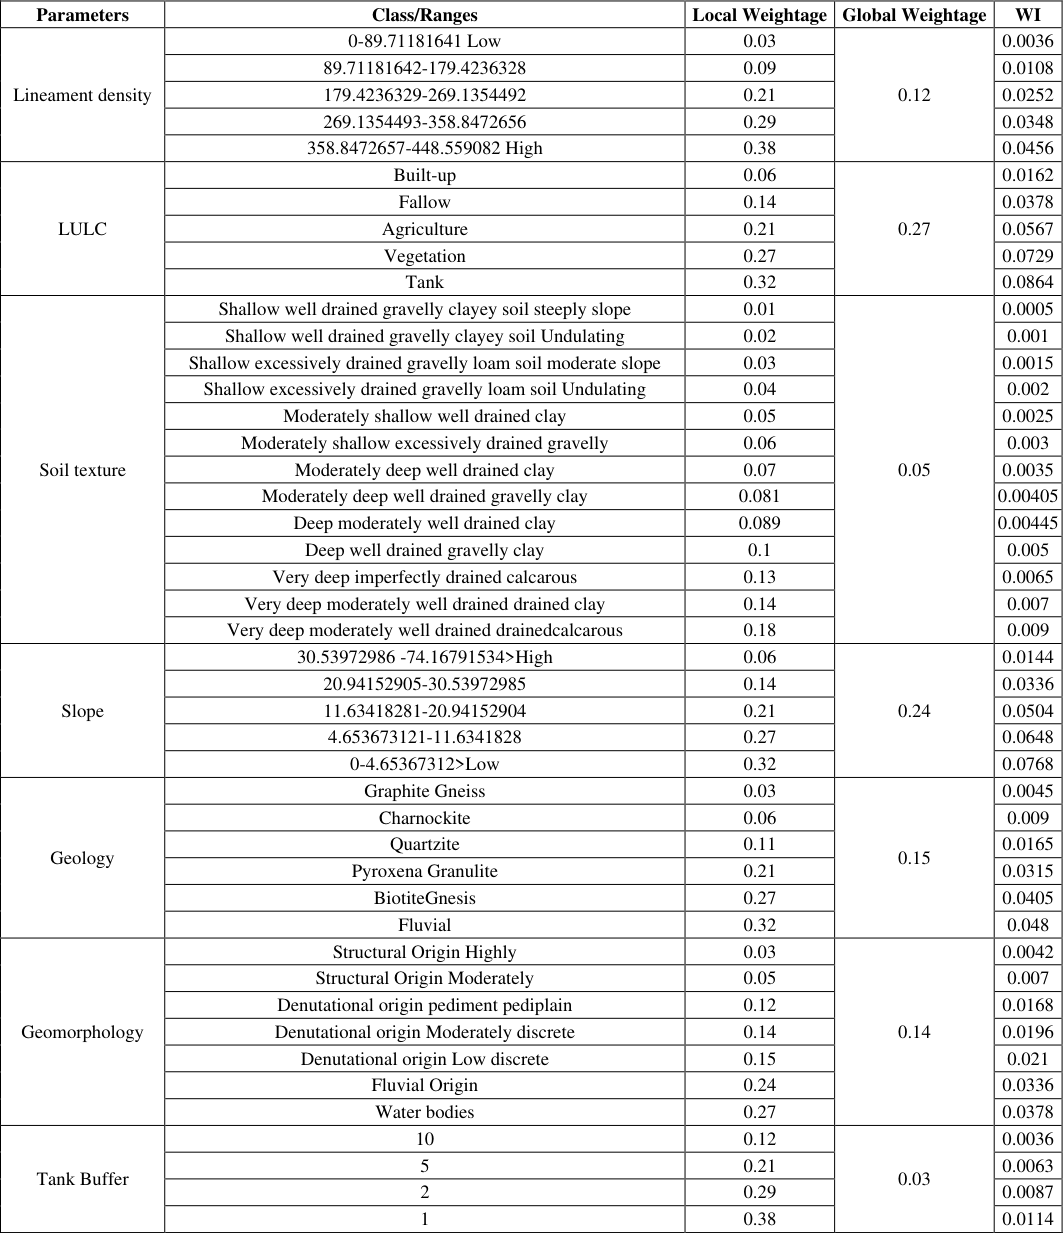 Table 8
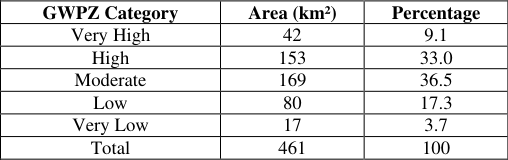 Table 9
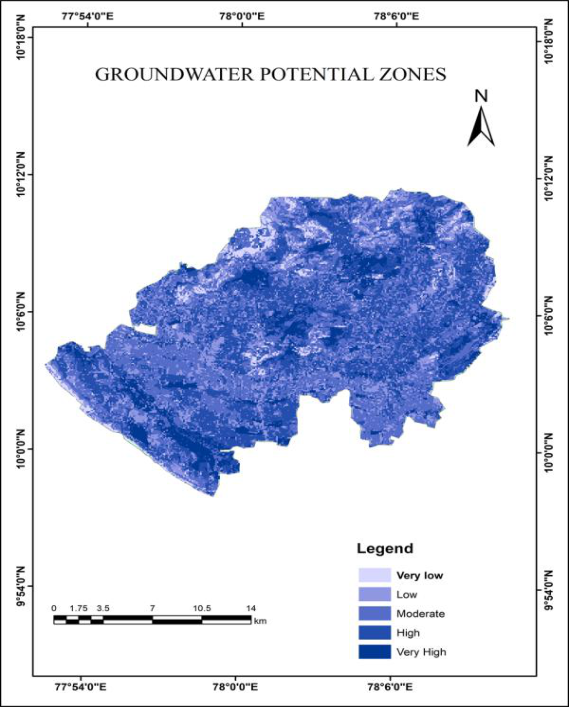 Figure 10
Introduction
Groundwater is a crucial natural resource that supports public health, economic development, and ecological sustainability, particularly in arid and semi-arid regions (Foster & Chilton, 2003). Hard rock terrains in these climatic zones often face severe water scarcity due to diverse physiographic conditions and limited groundwater occurrence (CGWB, 2019; Todd & Mays, 2005). The pronounced heterogeneity of hard rock aquifers complicates groundwater exploration, and the high costs associated with drilling necessitate the application of scientific and cost-effective methods for identifying groundwater potential zones (Singh & Prakash, 2002; Jha et al., 2007). The convenient availability of groundwater at or near the point of consumption, along with its minimal requirement for treatment, makes it one of the most important sources of water supply, particularly in arid and semi-arid regions (Todd & Mays, 2005). In a tropical country such as India, water scarcity has become increasingly critical due to rising demands driven by population growth, agricultural irrigation, industrial expansion, and tourism activities (Sishodia et al., 2016; Etikala et al., 2019; Kumar et al., 2021; Mahanuradha & Pragatheeswaran, 2023; Libina et al., 2023). In addition, anthropogenic factors such as changes in land-use patterns and excessive groundwater extraction for domestic, agricultural, and industrial purposes have significantly influenced subsurface water levels (Nayak et al., 2015; Kumari et al., 2022). Groundwater systems are inherently dynamic, continuously responding to variations in climatic conditions, extraction pressures, and land-use changes over both short-and long-term time scales. Conventional groundwater exploration methods are labor-intensive and expensive. Modern geospatial technologiesremote sensing and Geographic Information System (GIS)provide efficient, accurate alternatives for demarcating groundwater potential zones in both accessible and inaccessible areas [4] . These techniques enable integration of multiple hydrogeological parameters to generate spatially distributed groundwater potential assessments. The analytical hierarchy process (AHP), a multi-criteria decision-making technique, facilitates systematic weightage assignment to hydrogeological parameters based on their relative importance [5] . Vadipatti Taluk in Madurai District exemplifies hard rock terrain facing severe groundwater depletion and recurring water scarcity during dry seasons. This study was motivated by the critical need to identify suitable zones for groundwater extraction, recharge structure placement, and sustainable water resource management. The integration of remote sensing, GIS and AHP methodologies provides a systematic framework for groundwater potential zone delineation.
Study Area 2.1 Geographic representation
Vadipatti Taluk (Longitude: 77 0 57 ′ 39.6576 E Latitude: 10 0 5′3.5448 N) is located in Madurai District, Tamil Nadu, South India, approximately 29 km north of the district headquarters. The taluk covers an area of 463 km² and comprises a population of approximately 21,833 inhabitants. It is bounded by Nilakottai Block to the west, Alanganallur Block to the east, Chellampatti Block to the south, and Vattalkundu Block to the northwest, lying at the border between Madurai and Dindigul districts.
Hydro-geomorphologic Characteristics
Vadipatti is traversed by the Vaigai River (also known as the MullaiPeriyar Irrigation Channel), which originates in the Varushanadu Hills of Theni District at an elevation of 1,524 m and flows in a northwest-southeast direction. The region features diverse landforms including structural and denudational hills, residual wells, linear ridges, pediplains, and younger alluvial plains along the Vaigai River valley.
Climate and Hydrology
The region experiences a tropical monsoon climate with precipitation distributed across all seasons. The northeast monsoon contributes the maximum annual rainfall (665.5 mm), with average annual precipitation of 247.8 mm. Mean maximum and minimum temperatures during 2017-2018 were 39.6°C and 22.9°C, respectively. Peak temperatures occur during April-May, with significant evaporation losses. The region is heavily dependent on monsoon precipitation for groundwater recharge through infiltration processes.
Geological Framework
Vadipatti is underlain by Archean crystalline basement rocks comprising hornblende-biotite gneisses, charnockites, granites, and anorthosites. Charnockites dominate the northern portions (259 km²), while hornblende-biotite gneiss covers the southern regions (165 km²). A thin veneer of fluvial deposits (alluvium) occurs along the Vaigai River valley. Weathered zones (20-25 m depth below ground level) and interconnected fractures serve as the primary groundwater reservoirs. Groundwater occurs under phreatic conditions in weathered residuum and fracture zones, transitioning to semi-confined conditions in deeper fractures. Four LULC classes were identified: Built-up (55 km²), Agricultural land (73 km²), Fallow land (150 km²), Vegetation (176 km²), and Water bodies (10 km²). Tank Buffer Analysis: Multi-ring buffer zones (1, 2, 5, and 10 km) were generated around mapped water bodies (tanks, ponds, reservoirs) to quantify proximity influence on groundwater recharge potential.
Methodology Work Flow Chart
Methodology Work Flow Chart
Analytical Hierarchy Process (AHP)
The Analytical Hierarchy Process, developed by Saaty [6] , is a multi-criteria decision-making technique that structures complex problems hierarchically and assigns weights based on pairwise comparisons. This methodology was selected because it accommodates both quantitative data and expert judgments regarding hydrogeological importance of groundwater-controlling parameters.
In this study, AHP involved the following steps:
1. Hierarchy development: Seven thematic parameters and their constituent classes were organized in a decision hierarchy with groundwater potential as the ultimate goal. 2. Pairwise comparison: Parameters were compared systematically using a 1-9 intensity scale reflecting relative hydrogeological importance (e.g., geology vs. slope in controlling groundwater occurrence).
Weight calculation:
Normalized weights were derived from the pairwise comparison matrix using the eigenvector method. Consistency ratios were calculated to verify judgment reliability.
Local and global weights:
Local weights were assigned to individual classes within each parameter, then multiplied by global parameter weights to obtain final combined weights. 5. Weighted integration: Raster layers were multiplied by their respective weights and summed in raster calculator to produce the groundwater potential index.
Weight Assignment and Normalization
Global parameter weights (Table 1) were established through expert elicitation and literature review of groundwater occurrence factors in similar hard rock settings: Local weights for individual classes within each parameter reflected their hydrogeological significance. For example, within LULC, water bodies (weight: 0.32) received the highest weight due to direct recharge potential, followed by vegetation (0.27) and agricultural land (0.21). Similarly, within slope categories, very low slopes (<4.65°) received maximum weight (0.32) due to optimal infiltration conditions, while steep slopes (>30.54°) received minimum weight (0.06) due to high runoff losses. Weighted index values for each pixel were calculated as:
| Data Layer | Source |
|---|---|
| Topographic basemap (1:50,000 scale) | Survey of India, Dehradun |
| Slope | ALOS PALSAR DEM |
| Geology and geomorphology | Bhuvan Thematic Services; Geological Survey of India |
| Lineament delineation | Bhuvan portal analysis |
| Land use/land cover | Landsat 8 multispectral imagery (2021) |
| Soil texture classification | Tamil Nadu Agricultural University, Coimbatore |
| Water bodies | Survey of India topographic sheets |
| Software: ArcGIS 10, ENVI | ESRI, Exelis Visual Analytics |
Table text extracted from the original PDF; superscript letters are shown inline. The original table image is below.
View original table image
where WI is the weighted index, is the global weight of parameter , and is the local weight of the corresponding class.
Overlay Analysis and GWPZ Classification
All weighted thematic raster layers were integrated using raster overlay analysis (weighted sum method) in ArcGIS Spatial Analyst. The resulting groundwater potential index raster was reclassified into five qualitative categories representing groundwater potential zones: Very High, High, Moderate, Low, and Very Low.
Results
Results
Thematic Parameter Analysis
Geology: Six lithological units were identified. Charnockite (259 km²) and hornblende-biotite gneiss (165 km²) dominate, comprising 91.6% of the taluk. Fluvial alluvium (9 km²) occurs along the Vaigai River. Quartzite, garnetsillimanite graphite gneiss, and pyroxene granulite comprise <2.6% of the area. Hard rock lithologies with limited weathering (charnockite, quartzite) received lower local weights (0.06-0.11) compared to weathered gneisses (0.27) and alluvium (0.32), which provide favorable pore space for groundwater storage.
Groundwater Potential Zone Map
The resultant map produced by Overlay Analysis shows that Groundwater potential of the Vadipatti Taluk in Madurai District which is related to Geology, Geomorphology, and Lineament, Soil texture, Water body and Slope. By using various parameters the Groundwater potential zones were identified in the areas of Vadipatti Taluk. Integration of all weighted thematic layers produced the groundwater potential zone map. Five qualitative categories were delineated: Vaigai River floodplain and alluvial deposits, reflecting both direct infiltration from the river and higher water table levels. Distance from major water bodies progressively reduces groundwater potential, consistent with theoretical expectations regarding recharge distance-decay relationships [8] . Geological lithology exerts secondary control, with alluvium-dominated areas showing superior potential compared to hard rock zones. However, within hard rocks, zones of high lineament density and deep weathering demonstrate significantly enhanced potential compared to massive unweathered rocks. This observation highlights the importance of structural fracturing in hard rock hydrogeology. LULC patterns reflect land use-related recharge variations. Vegetated areas exhibit higher potential than built-up zones, likely due to reduced surface sealing and enhanced infiltration. Agricultural areas show intermediate potential, reflecting irrigation-induced recharge processes.
Discussion
Discussion
Methodological Considerations
The integrated geospatial approach using AHP provides a systematic, reproducible framework for groundwater potential assessment. The methodology accommodates multi-parameter complexity inherent in hard rock hydrogeology while incorporating expert hydrogeological knowledge through the pairwise comparison process. This approach is superior to simple overlay methods because it explicitly weights parameters based on their relative hydrogeological significance [5] . The weighting scheme employed (Table 1) reflects current understanding of groundwater controls in hard rock settings, emphasizing terrain morphology (slope: 0.24, geomorphology: 0.14) and land surface conditions (LULC: 0.27) as primary controls. Lithological variation (geology: 0.15) and structural fracturing (lineament density: 0.12) exert secondary controls in this study area, consistent with observations in similar granitic and gneissic terrains [9] .
Comparison with Previous Studies
The spatial distribution of groundwater potential zones in Vadipatti Taluk is consistent with findings from comparable hard rock studies in South India. Ramalingam and Shantha Kumar [10] delineated groundwater recharge zones in Tamil Nadu, identifying pediplains and alluvial plains as highpotential areas, consistent with this study. Magesh et al. [11] similarly demonstrated that gentle slopes and fluvial geomorphic units are critical indicators of groundwater potential in hard rock regions. The proportion of high-to-very-high potential zones (42.1% of the taluk) is comparable to published studies of similar geological settings [12] . The concentration of very high potential zones along river valleys reflects recognized principles of fluvial aquifer development [13] .
Hydrogeological Implications
The groundwater potential zones delineated in this study have significant implications for water resource management:
Figures and tables from the paper
| Parameter | Global Weight |
|---|---|
| Slope | 0.24 |
| Land Use/Land Cover | 0.27 |
| Geology | 0.15 |
| Geomorphology | 0.14 |
| Lineament Density | 0.12 |
| Soil Texture | 0.05 |
| Tank Buffer | 0.03 |
| Total | 1.00 |
Table text extracted from the original PDF; superscript letters are shown inline. The original table image is below.
View original table image
| Types of Geology | Area (in sq.km) |
|---|---|
| Charnockite | 259 |
| Fluvial | 9 |
| Garnet Siliminate Graphite Gnesiss | 11 |
| Hornblende Biotite Gneiss | 165 |
| Pyroxena Granulite | 1 |
| Quartzite | 9 |
Table text extracted from the original PDF; superscript letters are shown inline. The original table image is below.
View original table image
| Types of Geomorphology | Area (in sq.km) |
|---|---|
| Denudational origin pediment Pedi plain complex | 310 |
| Fluvial origin younger Alluvial plain | 17 |
| Denudational origin low dissected hills and valleys | 7 |
| Water body | 16 |
| Denudational origin moderately dissected hills and valleys | 25 |
| Structural origin moderately dissected hills and valleys | 11 |
| Structural origin highly dissected hills and valleys | 77 |
Table text extracted from the original PDF; superscript letters are shown inline. The original table image is below.
View original table image
| Slope classification | Area(in sq.km) |
|---|---|
| Very low | 289 |
| Low | 72 |
| Moderate | 39 |
| High | 37 |
| Very High | 14 |
Table text extracted from the original PDF; superscript letters are shown inline. The original table image is below.
View original table image
| Lineament classification | Area(in sq.km) |
|---|---|
| Very low | 332.53 |
| Low | 65.80 |
| Moderate | 43.21 |
| High | 18.49 |
| Very High | 3.13 |
Table text extracted from the original PDF; superscript letters are shown inline. The original table image is below.
View original table image
| Landuse and Landcover Classification Type | Area(in sq.km) |
|---|---|
| Agricultural Land | 73 |
| Build up | 55 |
| Fallow | 150 |
| Vegetation | 176 |
| Waterbody | 10 |
Table text extracted from the original PDF; superscript letters are shown inline. The original table image is below.
View original table image
| Parameters | Class/Ranges | Local Weightage | Global Weightage | WI |
|---|---|---|---|---|
| Lineament density | 0-89.71181641 Low | 0.03 | 0.12 | 0.0036 |
| 89.71181642-179.4236328 | 0.09 | 0.0108 | ||
| 179.4236329-269.1354492 | 0.21 | 0.0252 | ||
| 269.1354493-358.8472656 | 0.29 | 0.0348 | ||
| 358.8472657-448.559082 High | 0.38 | 0.0456 | ||
| LULC | Built-up | 0.06 | 0.27 | 0.0162 |
| Fallow | 0.14 | 0.0378 | ||
| Agriculture | 0.21 | 0.0567 | ||
| Vegetation | 0.27 | 0.0729 | ||
| Tank | 0.32 | 0.0864 | ||
| Soil texture | Shallow well drained gravelly clayey soil steeply slope | 0.01 | 0.05 | 0.0005 |
| Shallow well drained gravelly clayey soil Undulating | 0.02 | 0.001 | ||
| Shallow excessively drained gravelly loam soil moderate slope | 0.03 | 0.0015 | ||
| Shallow excessively drained gravelly loam soil Undulating | 0.04 | 0.002 | ||
| Moderately shallow well drained clay | 0.05 | 0.0025 | ||
| Moderately shallow excessively drained gravelly | 0.06 | 0.003 | ||
| Moderately deep well drained clay | 0.07 | 0.0035 | ||
| Moderately deep well drained gravelly clay | 0.081 | 0.00405 | ||
| Deep moderately well drained clay | 0.089 | 0.00445 | ||
| Deep well drained gravelly clay | 0.1 | 0.005 | ||
| Very deep imperfectly drained calcarous | 0.13 | 0.0065 | ||
| Very deep moderately well drained drained clay | 0.14 | 0.007 | ||
| Very deep moderately well drained drainedcalcarous | 0.18 | 0.009 | ||
| Slope | 30.53972986 -74.16791534>High | 0.06 | 0.24 | 0.0144 |
| 20.94152905-30.53972985 | 0.14 | 0.0336 | ||
| 11.63418281-20.94152904 | 0.21 | 0.0504 | ||
| 4.653673121-11.6341828 | 0.27 | 0.0648 | ||
| 0-4.65367312>Low | 0.32 | 0.0768 | ||
| Geology | Graphite Gneiss | 0.03 | 0.15 | 0.0045 |
| Charnockite | 0.06 | 0.009 | ||
| Quartzite | 0.11 | 0.0165 | ||
| Pyroxena Granulite | 0.21 | 0.0315 | ||
| BiotiteGnesis | 0.27 | 0.0405 | ||
| Fluvial | 0.32 | 0.048 | ||
| Geomorphology | Structural Origin Highly | 0.03 | 0.14 | 0.0042 |
| Structural Origin Moderately | 0.05 | 0.007 | ||
| Denutational origin pediment pediplain | 0.12 | 0.0168 | ||
| Denutational origin Moderately discrete | 0.14 | 0.0196 | ||
| Denutational origin Low discrete | 0.15 | 0.021 | ||
| Fluvial Origin | 0.24 | 0.0336 | ||
| Water bodies | 0.27 | 0.0378 | ||
| Tank Buffer | 10 | 0.12 | 0.03 | 0.0036 |
| 5 | 0.21 | 0.0063 | ||
| 2 | 0.29 | 0.0087 | ||
| 1 | 0.38 | 0.0114 |
Table text extracted from the original PDF; superscript letters are shown inline. The original table image is below.
View original table image
| GWPZ Category | Area (km²) | Percentage |
|---|---|---|
| Very High | 42 | 9.1 |
| High | 153 | 33.0 |
| Moderate | 169 | 36.5 |
| Low | 80 | 17.3 |
| Very Low | 17 | 3.7 |
| Total | 461 | 100 |
Table text extracted from the original PDF; superscript letters are shown inline. The original table image is below.
View original table image
References
16 in the original paper- HadiAllafta A, Mohammed A, Al-Ansari N. Groundwater potential zones mapping using analytical hierarchy process and GIS. Arabian Journal of Geosciences. 2020;13:649.
- Ahmed S, Jayakumar R, Salih A, editors. Groundwater dynamics in hard rock aquifers: Sustainable management and optimal monitoring network design. Berlin: Springer; 2007.
- Singh AK, Prakash R, Singh PK. Groundwater potential assessment in hard rock terrain using RS and GIS technique. Journal of the Indian Society of Remote Sensing. 2012;40(1):39-53.
- Chowdhury A, Roy U, Chowdhury R, Pal S. Delineation of groundwater potential zones in the coastal plains of Odisha, India: an AHP and GIS based approach. Environmental Earth Sciences. 2010;64(1):47-56.
- Saaty TL. The analytic hierarchy process: planning, priority setting, resource allocation. New York: McGraw-Hill; 1980.
- Saaty TL. Decision making with the analytic hierarchy process. International Journal of Services Sciences. 2008;1(1):83-98.
- Brady NC, Weil RR. The nature and properties of soils. 14th ed. Upper Saddle River (NJ): Pearson Education; 2008.
- Todd DK, Mays LW. Groundwater hydrology. 3rd ed. New York: John Wiley & Sons; 2005.
- Balasubramani K, Nedunchezhiyan M, Kumaraswamy K. Groundwater potential mapping using remote sensing and GIS techniques in Vaigai basin, Tamil Nadu, India. Hydrological Sciences Journal. 2011;56(8):1379-1392.
- Ramalingam K, Shantha Kumar N. Delineation of areas favourable for groundwater recharge in Tamil Nadu, India using remote sensing and GIS. Journal of the Indian Society of Remote Sensing. 2000;28(1):13-27.
- Magesh NS, Chandrasekar N, Soundranayagam JP. Delineation of groundwater potential zones in Theni district, Tamil Nadu using remote sensing, GIS and MIF techniques. Geoscience Frontiers. 2012;3(2):189196.
- Vasanthavigar M, Srinivasamoorthy K, Vijayaraghavan K, et al. Application of water quality index for groundwater quality assessment: Thirumanimuttar subbasin, Tamilnadu, India. Environmental Monitoring and Assessment. 2011;171:595-609.
- Suganthi M, Elango L. Groundwater potential zones and its relation to ground water level in Arani and Koratalai river basins, Southern India. Journal of the Geological Society of India. 2013;81(3):385-396.
- Sishodia RP, Shukla SP, Wani SP, Graham WD. Bidecadal groundwater level trends in a semi-arid south Indian region: declines, causes and management. Journal of Hydrology: Regional Studies. 2016;8.
- Kumar M, Singh P, Singh P. Fuzzy AHP based GIS and remote sensing techniques for the groundwater potential zonation for Bundelkhand Craton Region, India. Geocarto International. 2022;37(22):6671-6694.
- Libina RS, Jegankumar R, Prakash K, Dhanabalan SP, Arya MA. Exploration of potential groundwater zones in Nambiyar Watershed, South India using frequency ratio and multi-influencing models. Journal of Water Management Modeling. 2025.