
Research article · 2025 · Full text
International Journal of Geography Geology and EnvironmentDemographic profile after independence: A comparative study of Chandernagore Municipal Corporation and Hooghly-Chinsurah Municipality, West Bengal
Volume 7(12) · Pages 75–82 · DOI: 10.22271/27067483.2025.v7.i12a.463 ↗
Research areasDiverse scientific research topicsSocial and Economic Development in IndiaGlobal Health and Epidemiology
Abstract
Author-writtenDemographic profile refers to the statistical analysis of population data of an administrative unit. It talks about spatio-temporal change of population data. The present research work is an attempt to study comparatively about demographic profile of Chandernagore Municipal Corporation and Hooghly-Chinsurah Municipality, two class-I cities of West Bengal. The whole analysis has been done based on census data of 50 years. The demographic profile has been represented using census data of 5 decades, from 1961 to 2011. Geographically both the cities are situated on the same environment but they have different colonial background. Since independence both the cities have gone through massive change in their demographic profile differently. Irregularities in population parameters are higher in Chandernagore Municipal Corporation than Hooghly-Chinsurah Municipality mainly because of drastic change of geographical area.
Summary
Source-checkedPlain-language reading of the full paper, prepared with AI and checked against the text. Each point links to the authors' own words.
Why it matters
- A demographic profile is a statistical analysis used to track how population data changes across both space and time within an administrative unit. View evidence ↗
- Chandernagore and Hooghly-Chinsurah are adjacent cities in West Bengal with distinct colonial histories involving the French, Portuguese, and Dutch. View evidence ↗
- Since Indian independence, these two cities have experienced significant and differing changes in their demographic profiles. View evidence ↗
The question
- The study aims to identify how population size, density, growth rate, and household size index have changed over time and space in Chandernagore Municipal Corporation (CMC) and Hooghly-Chinsurah Municipality (HCM). View evidence ↗
What they did
- The research primarily used secondary data from the Primary Census Abstract (PCA) covering a 50-year period from 1961 to 2011. View evidence ↗
- Quantitative analysis was performed using manual statistical methods and MS-Excel, supplemented by field work to analyze the census data in detail. View evidence ↗
What they found
- CMC's population density peaked at 12,462 in 1991 but dropped to 7,361 in 2001 due to an expansion of the city's geographical area. View evidence ↗
- HCM's decadal population growth rate showed a steady decline from 26.64% (1961-1971) to 4.11% (2001-2011). View evidence ↗
- The average household size decreased in both cities from 2001 to 2011, falling from 4.55 to 4.03 in CMC and from 4.49 to 3.99 in HCM. View evidence ↗
What it means
- The authors conclude that while HCM has seen a consistent increase in population density, CMC's density fluctuated due to the expansion of its geographical area. View evidence ↗
- The authors state that both cities are experiencing a reduction in household size, indicating a trend toward smaller family units. View evidence ↗
Visual summary
3 visualsIllustrations explain the paper; charts are replotted from the paper's own table values.
Population Growth Comparison
AI-generated conceptual illustration (Urban landscapes of Chandernagore and Hooghly-Chinsurah cities in West Bengal). It explains the idea and does not show study data.
View source evidence ↗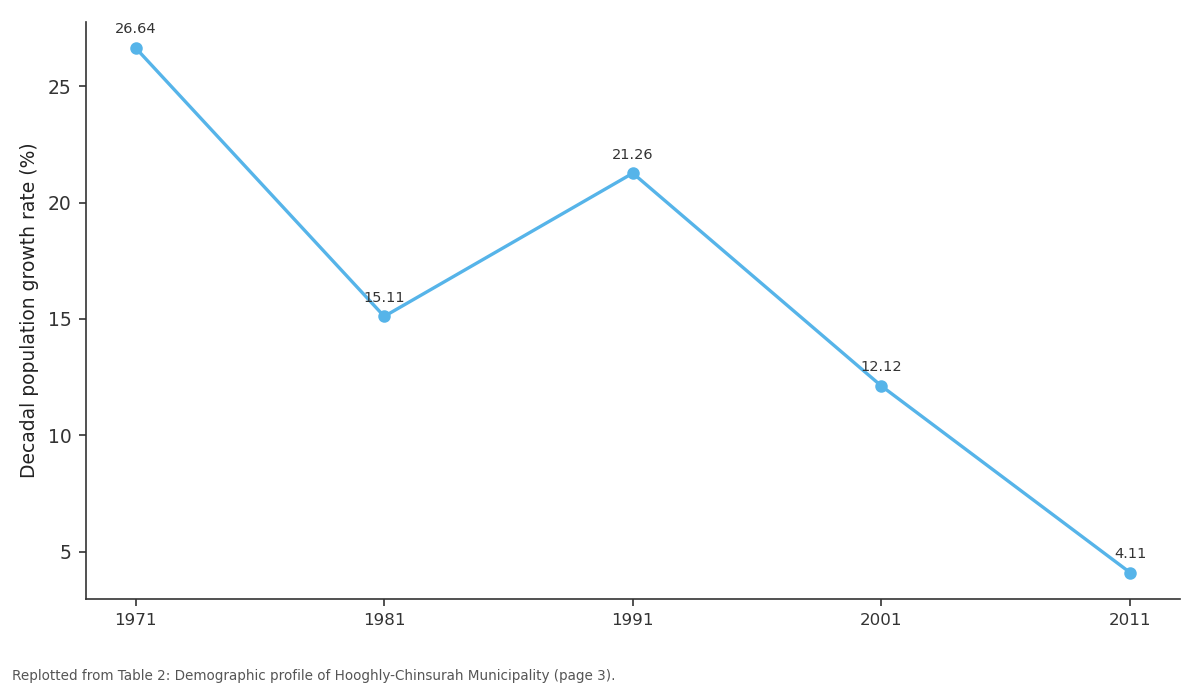
Decadal population growth rate (%): 1971 vs 1981 vs 1991 vs 2001 vs 2011
Replotted from Table 2 (page 3) of the original paper. Every bar is the paper's own table value.
View source evidence ↗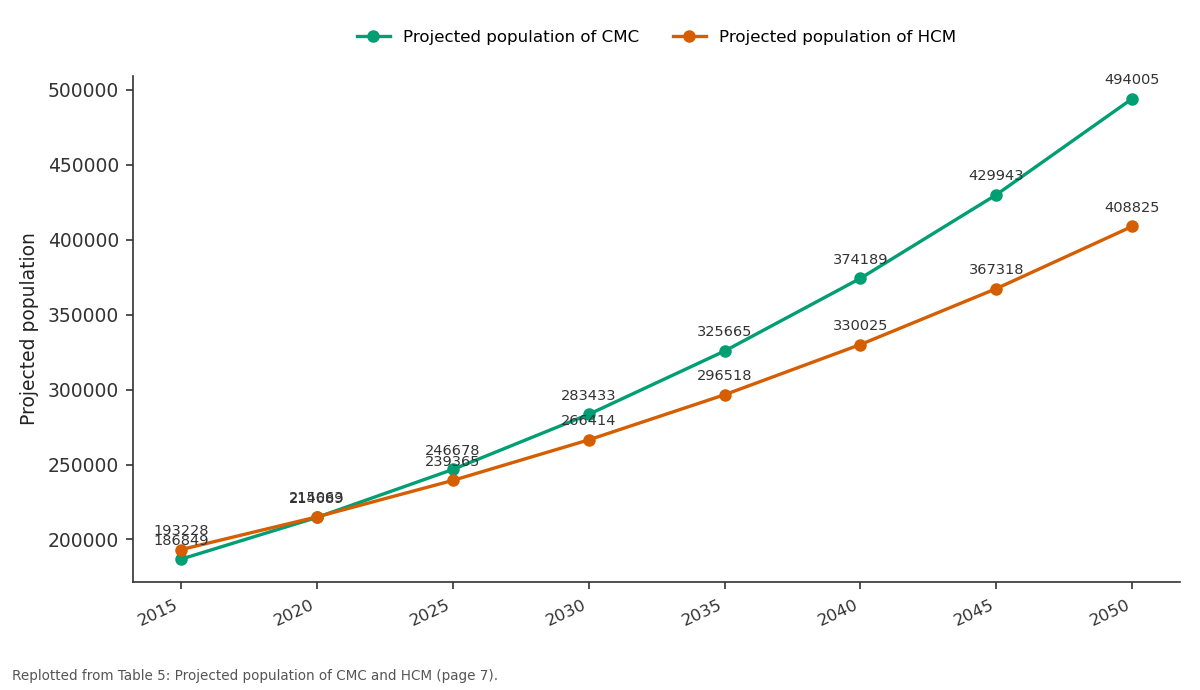
Projected population of CMC and Projected population of HCM: 2015 vs 2020 vs 2025 vs 2030 vs 2035
Replotted from Table 5 (page 7) of the original paper. Every bar is the paper's own table value.
View source evidence ↗Figures & tables
From the original paper Table 1
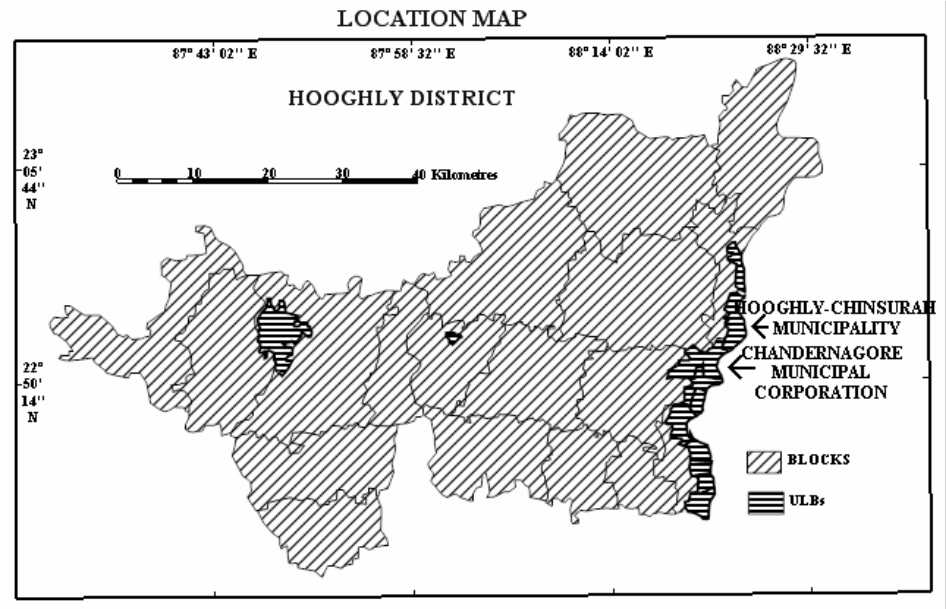 Figure 1
 Table 2
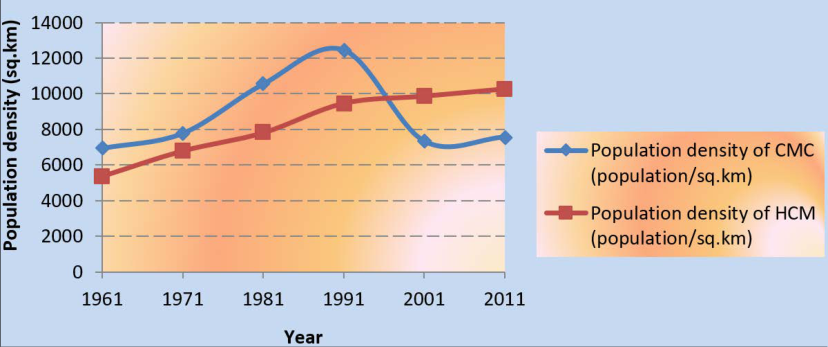 Figure 2
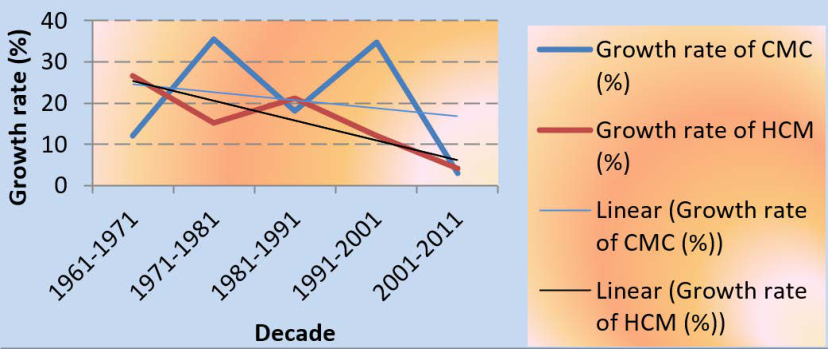 Figure 3
 Table 3
 Figure 4
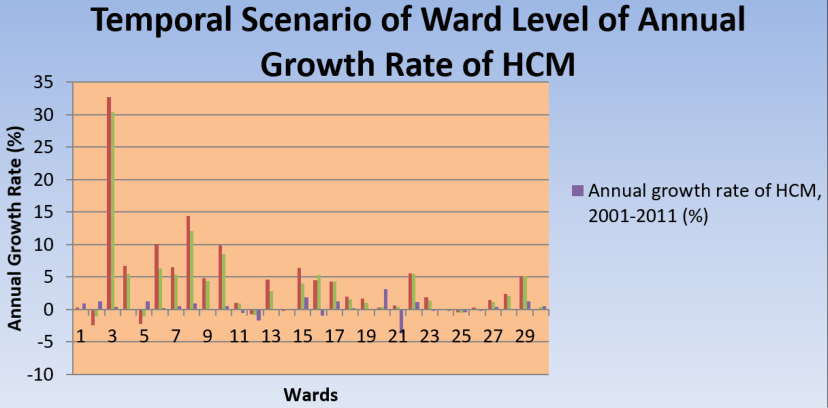 Figure 5
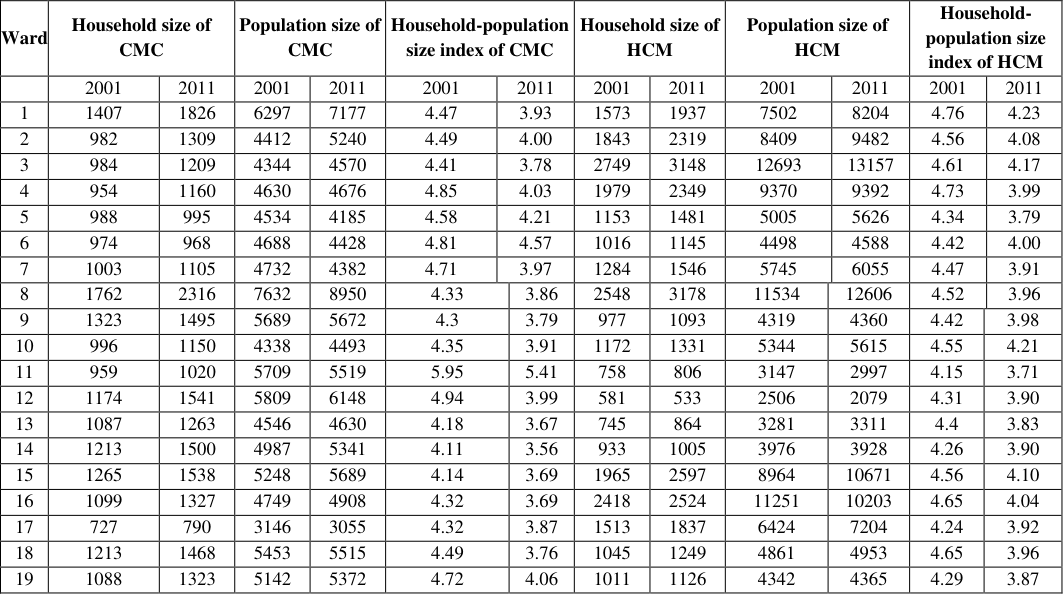 Table 4
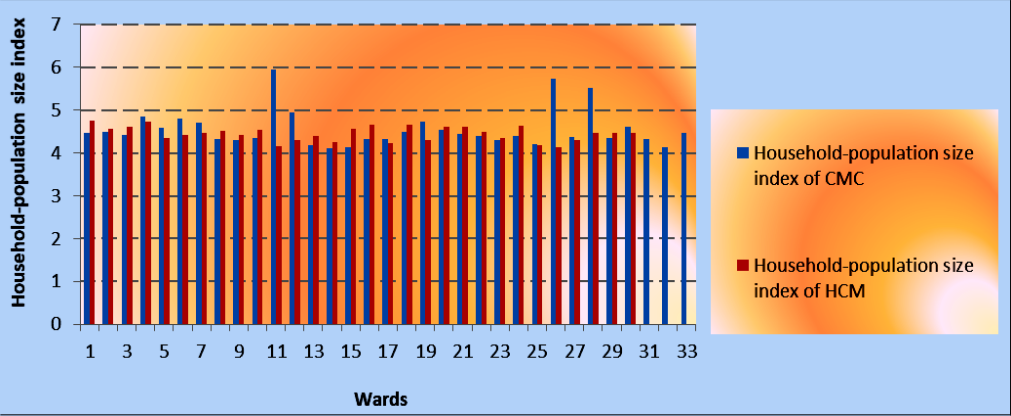 Figure 6
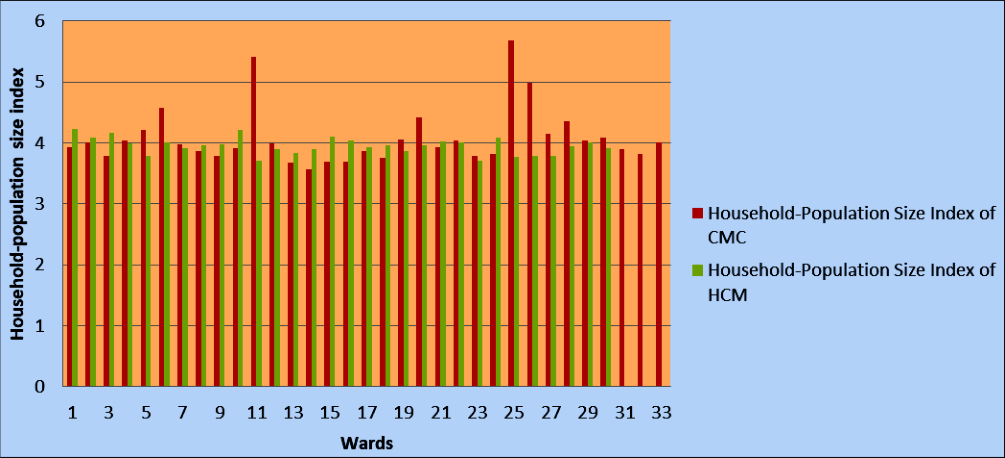 Figure 7
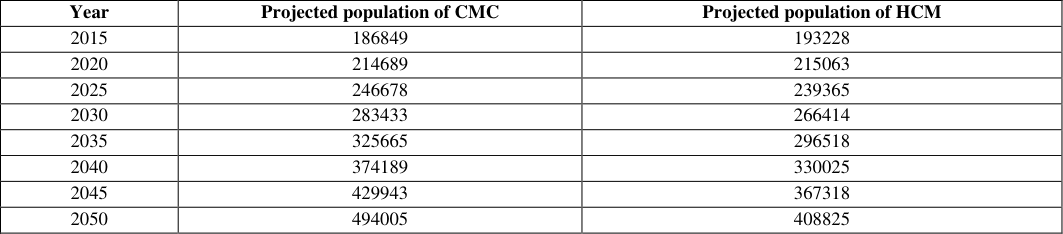 Table 5
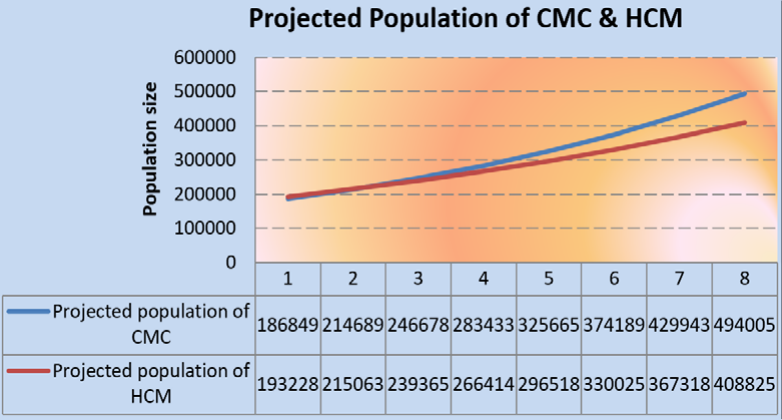 Figure 8
Introduction
Chandernagore Municipal Corporation (CMC) and Hooghly-Chinsurah Municipality (HCM) are two adjacent class-I cities of West Bengal. They are situated on the Eastern most part of Hooghly district. CMC and HCM are surrounded by Bansberia Municipality in the North, Bhadreshwar Municipality in the South, river Ganga to the East and different rural mouzas in the West. The area is located between two rivers, the Ganga to the Eastern part and the Saraswati to the Western part. The geographical location of the study area is 22°50′08″ N to 22°56′42″ N and 88°18′16″ E to 88°24′ 40″ E (Figure -1). There are 33 wards in CMC and 30 wards in HCM. The geographical area occupied by CMC and HCM is 22.03 sq. km and 17.27 sq. km respectively. The year of establishment of CMC is 1955 and of HCM is 1865 [1] . The population size of CMC and of HCM is 1, 66,949 and 1, 77,209 as per the Census of India, 2011. There are 152 slums in CMC with a population of 27 per cent of the total [2] . There are 140 slums in HCM with a population of 32 per cent of the total population [3] . Since independence there is a drastic change found in these two cities in terms of ward number, geographical area and population dynamicity. Both the cities have colonial background of different culture. Establishment of Hooghly was made in 1537 by Portuguese and establishment of Chinsurah was made in 1635 by Dutch. Chandernagore was founded in 1673 by French. Within this small piece of land, three European countries established their colonisation differently. After independence both the cities were grown uniquely with keeping imprints of their different colonial background. Demographic profile represents statistical analysis of population data. It talks about the dynamicity of population of an area. Exclusively, demographic profile demonstrates the spatio-temporal changing scenario of population data. The present work is an attempt to identify how the demographic characteristics such as, population size, population density, population growth rate, household-population size index etc are getting changed over space and time of Chandernagore Municipal Corporation and Hooghly-Chinsurah Municipality after independence.
Materials and Methods
The present research work is on demographic profile of two adjacent cities of Hooghly district, West Bengal. The work has been done mainly based on secondary data as it is a part of Population Geography and main and major source of population related data in India is Primary Census Abstract (PCA), published by Govt. of India. Here PCA data of 50 years has been used to complete the whole work. These are: PCA 1961 [4] , PCA 1971 [5] , PCA 1981 [6] , PCA 1991 [7] , PCA 2001 [8] and PCA 2011 [9] . In addition, Draft Development Plan (DDP) of Chandernagore Municipal Corporation and Hooghly-Chinsurah Municipality has been used. The quantitative analysis has been done using statistical methods manually and sometimes in MS-Excel. The diagrams have also been prepared in MS-Excel for better representation of demographic data. Field work has been also conducted for getting into detail analysis of census data. The population size of HCM was 83, 104 in 1961 which increased to 1, 77,209 in 2011. The population density has also increased from 5, 348 in 1961 to 10, 261 in 2011. The changing scenario of population density is very much consistent with the time (Linear trend line, R 2 = 95.2 %) (Figure -2). The latest census of 2011 has shown that the country has a population density of 382 persons/sq. km [10] . Decadal population growth of the city decreased from 26.64 % (1961-1971)
Results and
Results and
Household-population size index
Household-population size index is a measure which has been used to identify population size per household. Here it has been calculated at ward level for both the cities of CMC and HCM. The average value of household-population size index of CMC and HCM were 4.55 and 4.49 in 2001 which decreased to 4.03 and 3.99 respectively in 2011 (Table -4). These values show the average household size of the cities. The maximum and minimum household size index have been observed in ward number 11 (5.95) and 14 (4.11) of CMC and in ward number 1 (4.76) and 26 (4.14) of HCM in 2001. However, the scenario is changed little bit in the year 2011. In 2011, the maximum and minimum household size index have been reported in ward number 25 (5.68) and 14 (3.56) of CMC and in ward number 1 (4.23) and 11 and 23 (3.71) of HCM. Both the cities show a decline trend of household size index from 2001 to 2011 in their maximum and minimum values. This is an important point to note that the household size is getting smaller and nucleated in the cities. There is not much variation in the household size among the wards of both the cities. CMC shows 9.53% and 11.52% of co-efficient of variation in 2001 and 2011, whereas, HCM shows 3.82% and 3.43% in 2001 and 2011. The distribution pattern of household size of different wards show slight skewed with a value of 2.02 in 2001 and 2.17 in 2011 for CMC and -0.18 in 2001 and 0.13 in 2011 for HCM. Moreover, CMC shows leptokurtic distribution and HCM shows platykurtic distribution (Figure -6 & 7). From the above observation it is clear that household-population size index is almost consistent over the wards in both the cities.
Population projection
Population projection is the estimation of future population size of a place keeping with some inferences. Population projections are estimates of the total size or composition of the population at future dates [11] . Future population size is projected based on the population growth rate. Population projections appear to be mathematically complicated; we should remember that the validity of mathematics depends on the validity of the basic assumptions [12] . Population projection helps to get an idea about the future population
Figures and tables from the paper
| Year | No. of wards | Area (sq.km) | Population size | Population density (population/sq.km) | Decadal population growth rate (%) |
|---|---|---|---|---|---|
| 1961 | 5 | 9.66 | 67, 105 | 6, 947 | |
| 1971 | 22 | 9.66 | 75, 238 | 7, 789 | 12.12 |
| 1981 | 22 | 9.66 | 1, 01, 925 | 10, 551 | 35.47 |
| 1991 | 22 | 9.66 | 1, 20, 378 | 12, 462 | 18.1 |
| 2001 | 33 | 22.03 | 1, 62, 166 | 7, 361 | 34.71 |
| 2011 | 33 | 22.03 | 1, 66, 949 | 7, 578 | 2.94 |
Table text extracted from the original PDF; superscript letters are shown inline. The original table image is below.
View original table image
| Year | No. of wards | Area | Population size | Population density (population/sq.km) | Decadal population growth rate (%) |
|---|---|---|---|---|---|
| 1961 | 6 | 15.54 | 83, 104 | 5, 348 | |
| 1971 | 30 | 15.54 | 1, 05, 241 | 6, 772 | 26.64 |
| 1981 | 30 | 16.06 | 1, 25, 193 | 7, 795 | 15.11 |
| 1991 | 30 | 16.06 | 1, 51, 806 | 9, 452 | 21.26 |
| 2001 | 30 | 17.27 | 1, 70, 206 | 9, 856 | 12.12 |
| 2011 | 30 | 17.27 | 1, 77, 209 | 10, 261 | 4.11 |
Table text extracted from the original PDF; superscript letters are shown inline. The original table image is below.
View original table image
| Ward | Household size of CMC | — | Population size of CMC | — | Household-population size index of CMC | — | — | Household size of HCM | — | Population size of HCM | — | Household- population size index of HCM | — |
|---|---|---|---|---|---|---|---|---|---|---|---|---|---|
| 2001 | 2011 | 2001 | 2011 | 2001 | 2011 | 2001 | 2011 | 2001 | 2011 | 2001 | 2011 | ||
| 1 | 1407 | 1826 | 6297 | 7177 | 4.47 | 3.93 | 1573 | 1937 | 7502 | 8204 | 4.76 | 4.23 | |
| 2 | 982 | 1309 | 4412 | 5240 | 4.49 | 4.00 | 1843 | 2319 | 8409 | 9482 | 4.56 | 4.08 | |
| 3 | 984 | 1209 | 4344 | 4570 | 4.41 | 3.78 | 2749 | 3148 | 12693 | 13157 | 4.61 | 4.17 | |
| 4 | 954 | 1160 | 4630 | 4676 | 4.85 | 4.03 | 1979 | 2349 | 9370 | 9392 | 4.73 | 3.99 | |
| 5 | 988 | 995 | 4534 | 4185 | 4.58 | 4.21 | 1153 | 1481 | 5005 | 5626 | 4.34 | 3.79 | |
| 6 | 974 | 968 | 4688 | 4428 | 4.81 | 4.57 | 1016 | 1145 | 4498 | 4588 | 4.42 | 4.00 | |
| 7 | 1003 | 1105 | 4732 | 4382 | 4.71 | 3.97 | 1284 | 1546 | 5745 | 6055 | 4.47 | 3.91 | |
| 8 | 1762 | 2316 | 7632 | 8950 | 4.33 | 3.86 | 2548 | 3178 | 11534 | 12606 | 4.52 | 3.96 | |
| 9 | 1323 | 1495 | 5689 | 5672 | 4.3 | 3.79 | 977 | 1093 | 4319 | 4360 | 4.42 | 3.98 | |
| 10 | 996 | 1150 | 4338 | 4493 | 4.35 | 3.91 | 1172 | 1331 | 5344 | 5615 | 4.55 | 4.21 | |
| 11 | 959 | 1020 | 5709 | 5519 | 5.95 | 5.41 | 758 | 806 | 3147 | 2997 | 4.15 | 3.71 | |
| 12 | 1174 | 1541 | 5809 | 6148 | 4.94 | 3.99 | 581 | 533 | 2506 | 2079 | 4.31 | 3.90 | |
| 13 | 1087 | 1263 | 4546 | 4630 | 4.18 | 3.67 | 745 | 864 | 3281 | 3311 | 4.4 | 3.83 | |
| 14 | 1213 | 1500 | 4987 | 5341 | 4.11 | 3.56 | 933 | 1005 | 3976 | 3928 | 4.26 | 3.90 | |
| 15 | 1265 | 1538 | 5248 | 5689 | 4.14 | 3.69 | 1965 | 2597 | 8964 | 10671 | 4.56 | 4.10 | |
| 16 | 1099 | 1327 | 4749 | 4908 | 4.32 | 3.69 | 2418 | 2524 | 11251 | 10203 | 4.65 | 4.04 | |
| 17 | 727 | 790 | 3146 | 3055 | 4.32 | 3.87 | 1513 | 1837 | 6424 | 7204 | 4.24 | 3.92 | |
| 18 | 1213 | 1468 | 5453 | 5515 | 4.49 | 3.76 | 1045 | 1249 | 4861 | 4953 | 4.65 | 3.96 | |
| 19 | 1088 | 1323 | 5142 | 5372 | 4.72 | 4.06 | 1011 | 1126 | 4342 | 4365 | 4.29 | 3.87 |
Table text extracted from the original PDF; superscript letters are shown inline. The original table image is below.
View original table image
| Year | Projected population of CMC | Projected population of HCM |
|---|---|---|
| 2015 | 186849 | 193228 |
| 2020 | 214689 | 215063 |
| 2025 | 246678 | 239365 |
| 2030 | 283433 | 266414 |
| 2035 | 325665 | 296518 |
| 2040 | 374189 | 330025 |
| 2045 | 429943 | 367318 |
| 2050 | 494005 | 408825 |
Table text extracted from the original PDF; superscript letters are shown inline. The original table image is below.
View original table image
References
12 in the original paper- Bhattacharya A. Urban West Bengal. Calcutta: Institute of Local Government and Urban Studies; 2000-2002.
- Chandernagore Municipal Corporation. Draft development plan (2007-2012). Chandernagore: Chandernagore Municipal Corporation; 2007. Unpublished document.
- Hooghly-Chinsurah Municipality. Draft development plan (2007/08-2011/12). Hooghly: Hooghly-Chinsurah Municipality; 2007. Unpublished document.
- Census of India. District census handbook: Hugli, West Bengal. New Delhi: Government of India; 1961.
- Census of India. District census handbook: Hugli, West Bengal. New Delhi: Government of India; 1971.
- Census of India. District census handbook: Hugli, West Bengal. New Delhi: Government of India; 1981.
- Census of India. District census handbook: Hugli, West Bengal. New Delhi: Government of India; 1991.
- Census of India. District census handbook: Hugli, West Bengal. New Delhi: Government of India; 2001.
- Census of India. District census handbook: Hugli, West Bengal. New Delhi: Government of India; 2011.
- Chandna RC. Geography of population. Noida: Kalyani Publishers; 2016.
- Mandal RB, Uyanga J, Prasad H. Introductory methods in population analysis. New Delhi: Concept Publishing Company; 2007.
- Clarke JI. Population geography. Oxford (UK): Pergamon Press Ltd; 1976.