
Research article · 2025 · Full text
International Journal of Geography Geology and EnvironmentGeospatial analysis of shoreline dynamics on Nijhum Dwip Island, Meghna estuary, Bangladesh
Volume 7(12) · Pages 53–59 · DOI: 10.22271/27067483.2025.v7.i12a.460 ↗
Research areasCoastal and Marine DynamicsCoastal wetland ecosystem dynamicsCoastal and Marine Management
Abstract
Author-writtenThis study aimed to examine the shoreline dynamics and erosion-accretion of an active estuarine island over a 45-year period utilizing GIS approaches. To extract the shoreline both automated band ratio and manual digitizing methods have been employed. The Digital coastal Analysis System, an extension of ArcGIS, has been utilized for the analysis of coastal displacement. The results show that Between 1972 and 2017, the island gained 35 square kilometers of land at a rate of 0.77 square kilometers (77 hectares) annually. Net Shoreline Movement shows that highest seaward movement is about 5,549 meters found in northern part of the island whereas highest landward movement is about 1,093 meters found in the southern part of the island. Highest End Point Rate towards the sea is about 125 meters per year and landward is about 24 meters per year. The overall result indicates that the island is moving towards the sea of about 34 meters per year.
Summary
Source-checkedPlain-language reading of the full paper, prepared with AI and checked against the text. Each point links to the authors' own words.
Why it matters
- The coastal geology of Bangladesh is characterized as highly unstable, experiencing constant deposition and erosion due to its nature as a lowland delta country. View evidence ↗
- Estuarine islands in the Meghna River estuary are active environments formed by upstream sediment deposits but are simultaneously eroded by wave action and river flow. View evidence ↗
- Conducting comprehensive shoreline assessments is essential for helping local communities reduce risks from coastal hazards. View evidence ↗
The question
- The study aimed to identify areas vulnerable to shoreline change and analyze the temporal and spatial shifts of Nijhum Dwip Island's shoreline between 1972 and 2017. View evidence ↗
What they did
- The researchers used Landsat satellite imagery from 1972, 1989, 1991, 1999, 2010, and 2017 to track coastal changes. View evidence ↗
- Coastal boundaries were delineated using NDWI and MNDWI water indices, with manual digitization at a 1:1000 scale used to correct automated errors. View evidence ↗
- The Digital Shoreline Analysis System (DSAS) 4.3 was used to calculate coastal change by generating transects at 150-meter intervals. View evidence ↗
- Coastal migration was quantified using Net Shoreline Movement (NSM) for distance and Endpoint Rate (EPR) for the rate of movement over time. View evidence ↗
What they found
- From 1972 to 2017, Nijhum Dwip Island experienced a net land gain of 35 square kilometers, averaging 0.77 square kilometers per year. View evidence ↗
- The period of highest land growth occurred between 1972 and 1989, during which approximately 22 square kilometers were added. View evidence ↗
- The maximum seaward movement was 5,549 meters in the north, while the maximum landward movement was 1,093 meters in the south. View evidence ↗
- The highest recorded rate of shoreline movement was 125 meters per year seaward and 24 meters per year landward. View evidence ↗
- On average, the island is shifting towards the sea at a rate of approximately 34 meters per year. View evidence ↗
What it means
- The authors conclude that the island is overall growing because the annual accretion rate exceeds the erosion rate, leading to a gain of about 0.78 square kilometers per year. View evidence ↗
- The authors recommend systematic monitoring of coastal morphology to support long-term development strategies such as the Bangladesh Delta Plan 2100. View evidence ↗
Visual summary
2 visualsIllustrations explain the paper; charts are replotted from the paper's own table values.
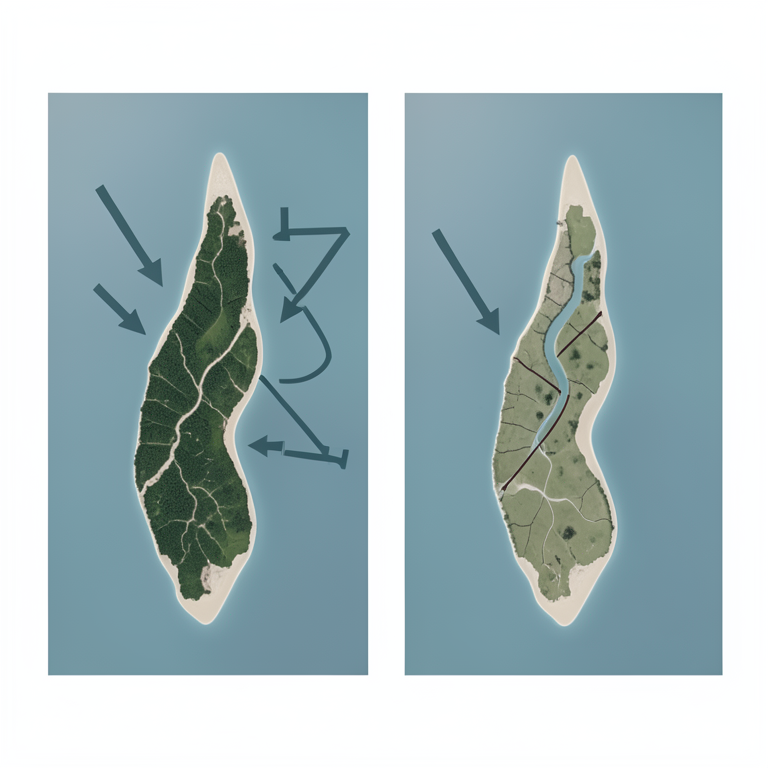
Shoreline Shift Concept
AI-generated conceptual illustration (Nijhum Dwip Island in the Meghna estuary). It explains the idea and does not show study data.
View source evidence ↗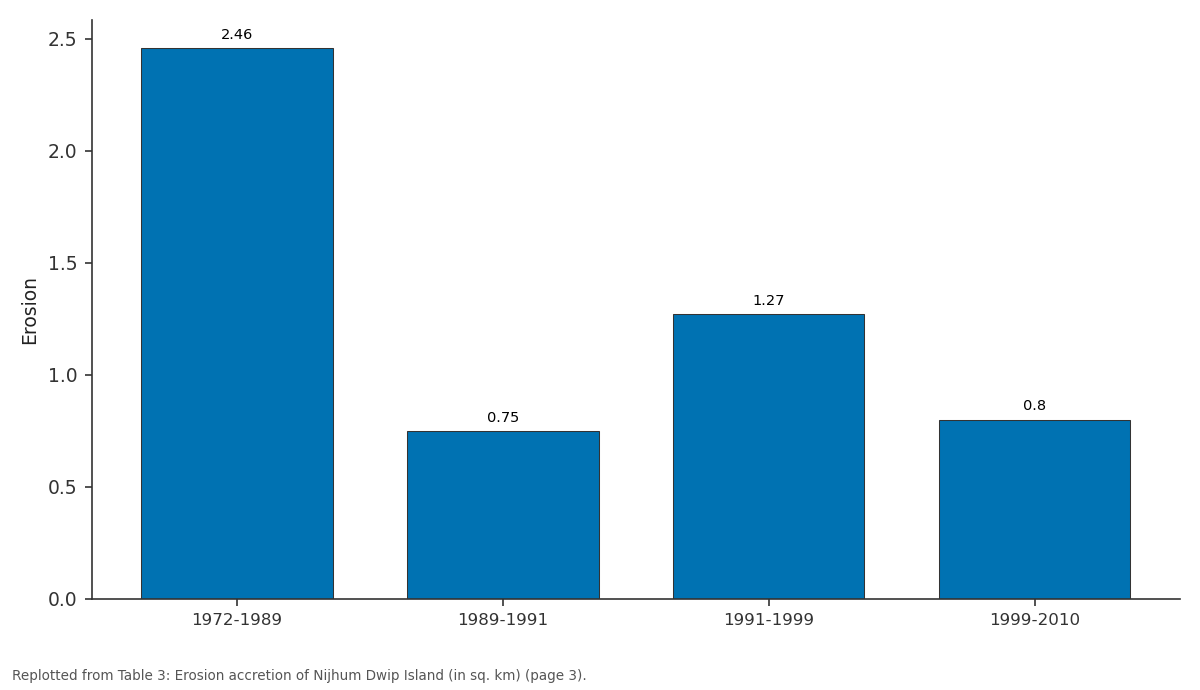
Erosion: 1972-1989 vs 1989-1991 vs 1991-1999 vs 1999-2010
Replotted from Table 3 (page 3) of the original paper. Every bar is the paper's own table value.
View source evidence ↗Figures & tables
From the original paper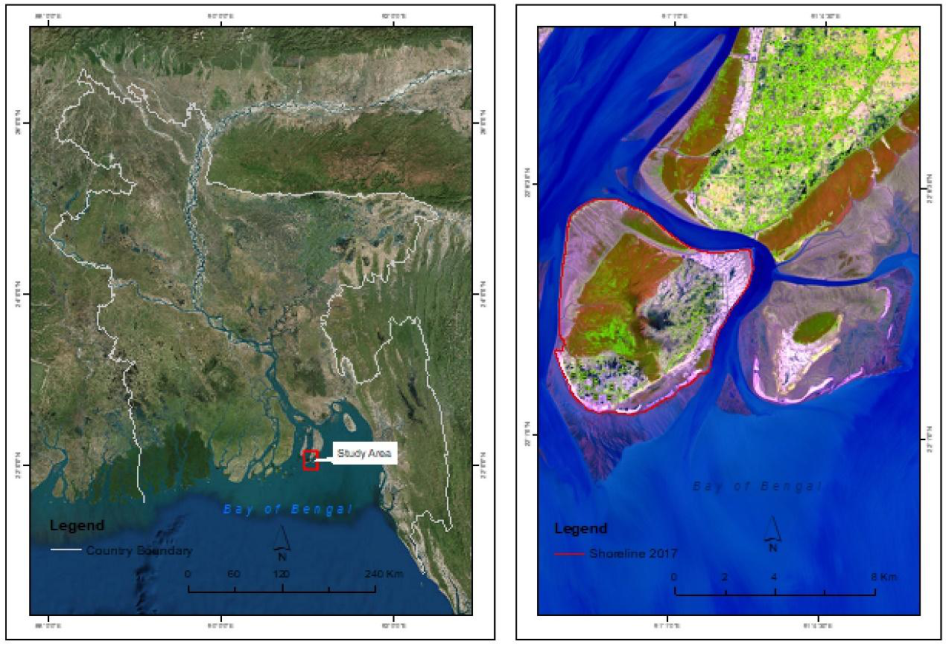 Figure 1
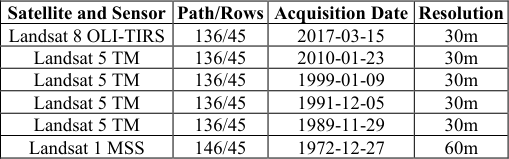 Table 1
 Table 2
 Table 3
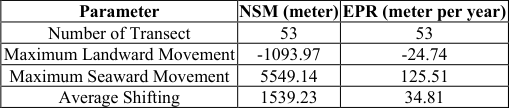 Table 4
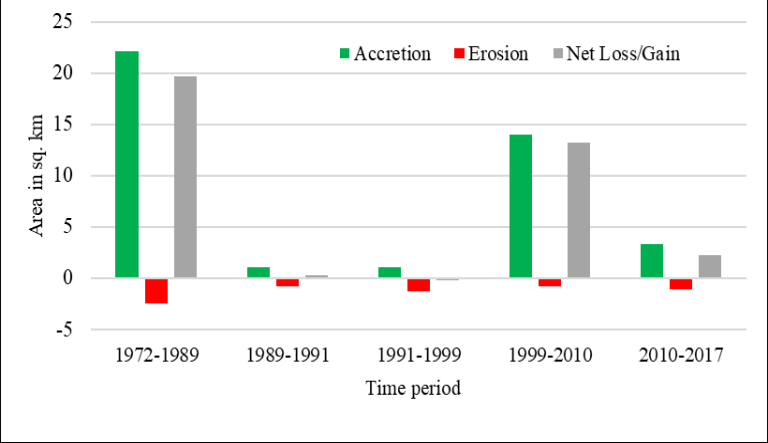 Figure 2
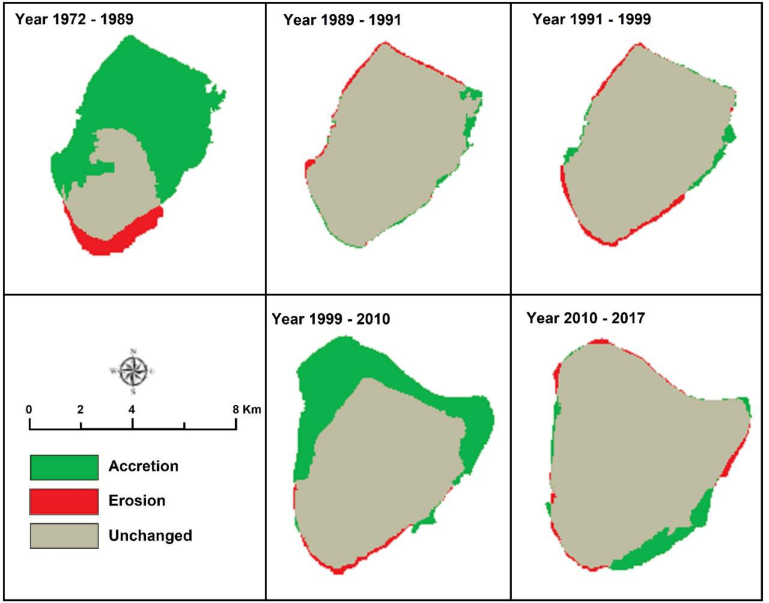 Figure 3
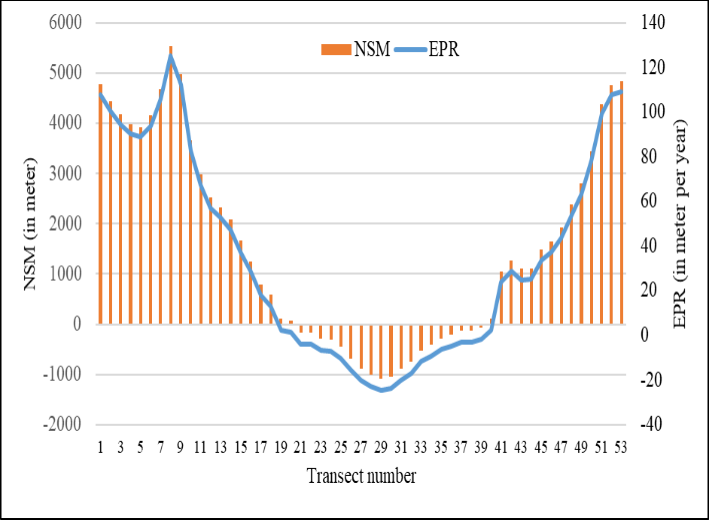 Figure 4
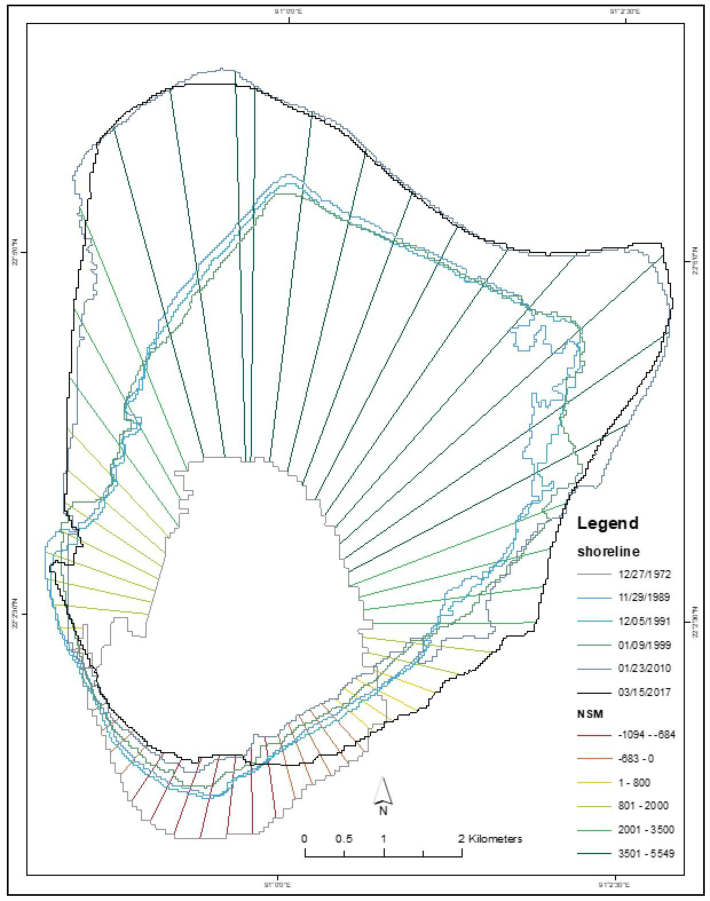 Figure 5
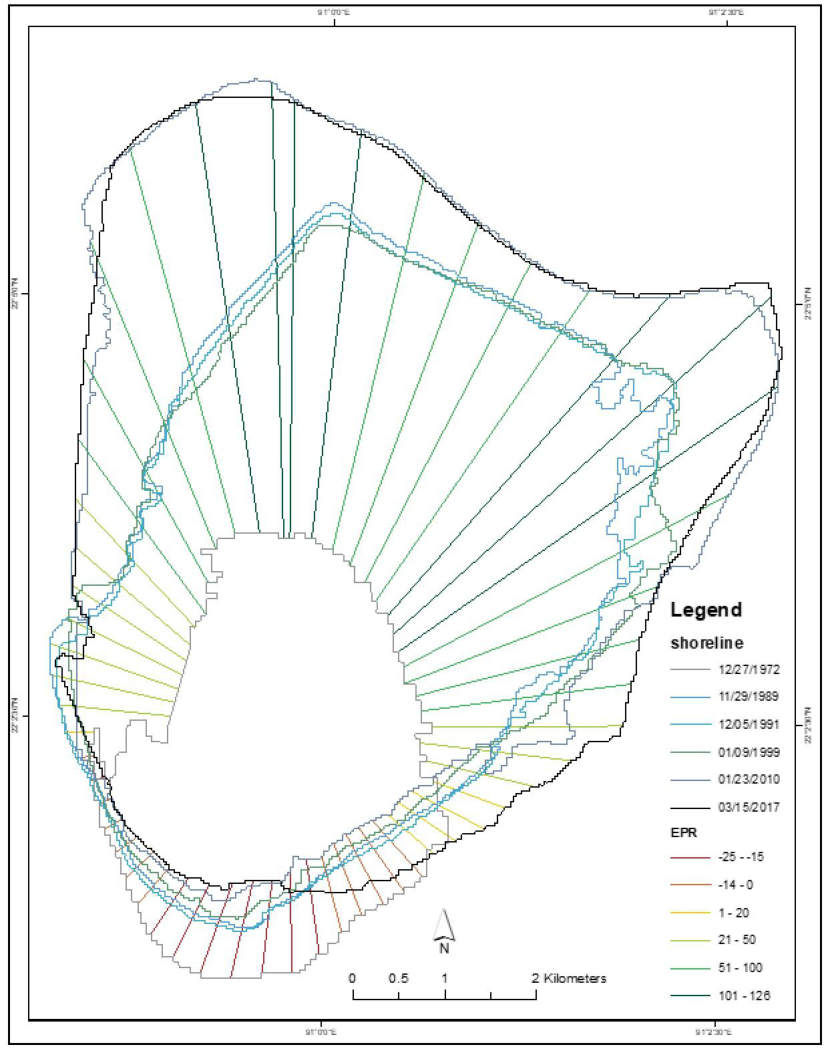 Figure 6
Introduction
The seashore is a distinctive and highly dynamic habitat globally. The coastline is a strip of land with varying width. It extends inland from an aquatic area to a point where the terrain changes (Bouchahma & Yan, 2012) [4] . Shorelines are the transition zone between land and water, constantly changing with the shifting of the tides. This change creates different boundaries at low tide, mid tide, and high tide that delineate the transition zone from land to water. In addition, these changes are controlled by short-term and gradual processes. The morpho-dynamics of shoreline, which refers to the alterations in the coastal shape resulting from variations in sand volume and this plays a key role in the development of the shoreline (Harley et al., 2014) [10] . As a lowland delta country, the coastal geology of Bangladesh is highly unstable and is subject to continuous erosion and deposition (Sarwar & Woodroffe, 2013) [16] . The coastline of Bangladesh is segmented into four regions from the western to the eastern end: the Sundarbans, the Clear Sundarbans, the Meghna, and Chattogram. Except for Chattogram, most of the coastline is low and swampy in nature, changing rapidly and formed by Quaternary sediments deposited in extensive river basins. The main sources of this sediment are the Ganges and Brahmaputra river systems (Schwartz, 2006) [17] . Most of the estuarine islands of Bangladesh are in are in the Meghna River estuary, a active area formed by sediment deposited over time from upstream flood waters and subject to ongoing erosion by river flow and wave action (Ghosh et al., 2015; Sarwar & Woodroffe, 2013) [9,16] . Understanding the dynamic nature of coastal environments, especially in the Meghna Mangrove region, and the complex relationship between human influence on coastal change requires extensive research (Chowdhury and Sikder, 2023) [6] . Natural and anthropogenic activities make significant changes in the shoreline and identify those changes that are crucial for coastal management and policy development. The coastline of Bangladesh is about 710 km long and extends over 1,320 km when including estuaries, islands, and tidal channels. Moreover, approximately 19 coastal districts in Bangladesh are situated in lowlying topography with the elevations ranging from 0.5 to 11.8 meters above sea level and this topographic setting makes the coastal area vulnerable to climate change and natural disasters (Ashrafuzzaman et al., 2022) [1] . Complete shoreline assessment of coastal areas is critical for the local community to mitigate the risk associated with coastal hazards (Beverage et al., 2020; Chowdhury and Sikder, 2023) [3,6] . GIS and remote sensing have become essential tools which offer accurate and effective monitoring of shoreline (Islam et al., 2023) [11] .
The Digital Shoreline Analysis System (DSAS) extension of ArcGIS helps accurately assess the place of shoreline changes over several years and it provides powerful statistical information for shoreline change dynamics. The DSAS based shoreline analysis can be competent at Nijhum Dwip Island in the Meghna estuary where continuous geological evolution occurs due to river and tidal processes, along with large amounts of discharge (Shahid et al., 2024) [18] . Therefore, the main objectives of the study are to analyze spatial and temporal changes of the shoreline of Nijhum Dwip Island and identify areas vulnerable to shoreline change from year 1972 to 2017. In this study the DSAS extension of ArcGIS was used to analyze the changes in different year intervals. The analysis will use Landsat satellite images, acquired from 1972 to 2017. This data selection ensures a broad and detailed understanding of long-term shoreline change which will provide valuable perceptions into the evolution of this dynamic island environment.
Material and Methods
Material and Methods
Study Area:
Nijhum Dwip Island is a significant offshore island of Bangladesh, near the estuary of the Meghna River. The island extends from 22°02' N to 22°06' N latitude and from 90°58' E to 91°02' E longitude (Fig. 1). It is bounded by Hatiya Island to the north, Domar Char to the east, the Bay of Bengal to the south, and both the Bay of Bengal and Manpura Island to the west. The area of the island is about 81 square kilometers with its water body. It is an administrative unit of Hatiya Upazila. Nijhum Dwip Island is an offshore island under Hatiya upazila which is developed with planted mangroves. This island is almost flat with a round rectangular shape. The region experiences an average annual temperature of approximately 25.6°C, while the mean annual rainfall is about 3,302 mm. It is observed that May records the highest temperatures, averaging 40.6°C, while January is the coldest month, with an average temperature of 19.5°C. Precipitation is at its lowest in January, with only 8 mm, while July marks the peak of the rainy season, receiving an average of 671 mm of rainfall (Rahman, 2012) [15] . According to Bangladesh Bureau of Statistics population of the island has increased from 7835 in 2001 to 12796 in 2011 (BBS, 2015). [12,20,21,22] . This study used satellite imagery from multiple sensors to track coastal changes, such as erosion and deposition rates. We selected Landsat 1 MSS (1972), Landsat 5 TM (1989, 1991, 1999, and 2010), and Landsat 8 OLI-TIRS (2017) images. All images were downloaded from the USGS website (www.earthexplorer.usgs.gov and www.glovis.usgs.gov). All the images have a resolution of 30 meters despite the 1972 image having a resolution of 60 meters. These images were selected because of their quality, sensor type, visibility, low cloud cover (less than 5%), low tide level (less than 1 meter), and being taken during the dry season.
The table below (Table 1) shows an overview of the data used in this study. [13] .
| Satellite and Sensor | Path/Rows | Acquisition Date | Resolution |
|---|---|---|---|
| Landsat 8 OLI-TIRS | 136/45 | 2017-03-15 | 30m |
| Landsat 5 TM | 136/45 | 2010-01-23 | 30m |
| Landsat 5 TM | 136/45 | 1999-01-09 | 30m |
| Landsat 5 TM | 136/45 | 1991-12-05 | 30m |
| Landsat 5 TM | 136/45 | 1989-11-29 | 30m |
| Landsat 1 MSS | 146/45 | 1972-12-27 | 60m |
Table text extracted from the original PDF; superscript letters are shown inline. The original table image is below.
View original table image
The second step was geometric correction, where the 2017 image was selected as the base map for alignment. The Autosync tool in Erdas Imagine was used to apply a thirdorder polynomial transformation, maintaining a Root Mean Square (RMS) error below 0.5, which is considered acceptable. Ground truth points collected via GPS were overlaid on the images to ensure spatial accuracy. This verification process confirmed that the images were suitable for further analysis and change detection (Emran et al., 2016) [8] . [13] . For subsequent images, MNDWI was used due to its effectiveness in distinguishing water from built-up land, utilizing the fact that water absorbs more mid-infrared light compared to near-infrared light. This index allowed for a clearer separation of water and land, which was essential for accurate boundary delineation. Once the coastal boundaries were defined, the classified images were then converted to vector format using ArcGIS 10.0. Manual digitization was performed at a scale of 1:1000 to address any discrepancies from the automated land-water index method, ensuring the accuracy of the coastal boundary. For coastal change detection, the Digital Shoreline Analysis System (DSAS) 4.3 was employed to assess the changes in the shoreline over time. DSAS generates reference points and transects at 150-meter intervals along the coastline, calculating the location and rate of coastal change. Additional calculations were performed in MATLAB to analyze the historical coastal data (Emran et al., 2016; Thiller et al., 2008) [8,19] . Finally, two key metrics were used to quantify coastal migration: Net Shoreline Movement (NSM), which quantifies the distance between the most landward and most seaward shoreline positions per transect, and Endpoint Rate (EPR) that measures the rate at which the shoreline moves over time (Dolan et al., 1980) [7] . Statistical analyses also examined the relationship between shoreline shifts and environmental factors such as rainfall and water levels, with all analyses conducted using Microsoft Excel.
Results and Discussion
Results and Discussion
Erosion and Accretion
Erosion and accretion are frequent in coastal areas because coastal environments are highly dynamic. The Nijhum Dwip Island is in Meghna estuary which is constantly changing due to the heavy sediment load carried by the Ganges-Brahmaputra-Meghna (GBM) river system. The island first appeared in around 1940. After that human intervention started around 1950. The island is morphologically very dynamic as it is located at the mouth of an active delta, and it is also at the southernmost island of Bangladesh. It is dominated by the deposition process. Sediments carried by the Meghna River deposited here with the confluence of the Bay of Bengal. The most accretion took place between the year 1972 and 1989. About 22 square kilometers added in this period (in 17 years) (Table 3, Fig. 2 and Fig. 3). Second highest accretion occurred between the year of 1999 and 2010 (about 14 square kilometers in 11 years) (Table 3, Figure 2 and 3). The island lost highest 2.46 square kilometers in first time span and a total of 6.33 square kilometers in last 45 years and deposited about 41 square kilometers (Table 3).
| Parameter | 1972-1989 | 1989-1991 | 1991-1999 | 1999-2010 | 2010-2017 | 1972-2017 |
|---|---|---|---|---|---|---|
| Accretion | 22.19 | 1.10 | 1.07 | 14.04 | 3.33 | 41.74 |
| Erosion | 2.46 | 0.75 | 1.27 | 0.80 | 1.03 | 6.33 |
| Net Loss/Gain | 19.72 | 0.35 | -0.20 | 13.24 | 2.30 | 35.41 |
| Unchanged | 9.60 | 31.04 | 30.87 | 31.14 | 44.15 | - |
Table text extracted from the original PDF; superscript letters are shown inline. The original table image is below.
View original table image
The island gained about 35 square kilometers in last 45 years. It gained landmass in every interval period except 1991-1999 (Table 3). In this period erosion process is dominated and net loss was 0.20 square kilometers which is very insignificant. The rate of accretion is about 0.93 square kilometers per year; erosion is about 0.14 square kilometers and net loss or gain rate 0.79 square kilometers per year (Table 3). From the figure below, it is found that most of the erosion took part in the southernmost of the island which side is open ocean. And it is also seen clearly that most erosion took place in the north, northeast and northwest parts of the island due to the cumulative effect of Hatiya and Domar Char islands. Both islands helped Nijhum Dwip Island in accretion process. Fig. 3 shows the erosion and accretion process of the island in different time periods.
Shoreline Shifting Rate and Pattern
To enhance understanding of the island's dynamic nature, the DSAS extension was utilized in conjunction with erosion and accretion measurements. A total of 53 transects were automatically generated using the DSAS extension within the ArcGIS environment. Both Net Shoreline Movement (NSM) and End Point Rate (EPR) were calculated. NSM quantifies how far the shoreline has shifted between its oldest and most recent positions in meters, while EPR represents the rate of change, calculated by calculating the distance change over the period in meters per year. The shoreline is not uniform every year. It was found that highest seaward movement was more than 5 km. Which is found in northeast and northwest part of the island. The northern part of the island experiencing movement of more than 3.5 km (Table 4, Fig. 4 and Fig. 5). Maximum landward movement was found about 1 km. Which is found in the southern part of the island. Highest seaward shifting rate was found to be about 125 meters per year and highest landward movement rate at about 24 meters per year (Table 4, Fig. 4 and Fig. 6). The island shows a positive shifting as it is found the average NSM of more than 1.5 km and average EPR of about 34 meters per year. Which indicates the island is shifting towards the sea by one pixel every year (Table 4).
| Parameter | NSM (meter) | EPR (meter per year) |
|---|---|---|
| Number of Transect | 53 | 53 |
| Maximum Landward Movement | -1093.97 | -24.74 |
| Maximum Seaward Movement | 5549.14 | 125.51 |
| Average Shifting | 1539.23 | 34.81 |
Table text extracted from the original PDF; superscript letters are shown inline. The original table image is below.
View original table image
Conclusion
Both erosion and accretion have taken part in every year, and the consistently unchanged land suggests that the island has experienced overall land growth. The seaward movement and rate of the shifting of shoreline shows stronger movement in the northeastern, northern, and northwestern regions. On the other hand, landward movement and rate of the shifting of shoreline is higher in the south and southeastern part of the island. This dynamic nature is largely due to its position at the mouth of the Meghna River estuary. From the analysis of the last 45 years, it is found that the accretion rate is 0.93 square kilometers (93 hectares) every year. Whereas erosion rate is found to be 0.14 square kilometers (14 hectares each year. As accretion rate is higher than erosion the island is gaining land area of about 0.78 square kilometers (78 hectares) every year. Most accretion was taken in places between 1972 and 1989. The Meghna River delivers vast amounts of sediment from the Ganges-Brahmaputra-Meghna (GBM) river system, which are deposited in this region. The erosion process is more active at the open sea. This was because of the tidal water pressure, loose bank materials and shoreline configuration. The accretion is more active in the estuarine area where slope is gentle due to deposition of the sediment carried by the Meghna River. Systematic monitoring is mandatory for change detection investigation in coastal morphology for implementing a long-term development plan like Bangladesh Delta Plan 2100.
Figures and tables from the paper
References
22 in the original paper- Ashrafuzzaman M, Gomes C, Guerra J. Climate justice for the southwestern coastal region of Bangladesh. Front Clim. 2022;4:1-15.
- Bangladesh Bureau of Statistics (BBS). Population and housing census 2011 community report Noakhali. Dhaka: Bangladesh Bureau of Statistics, Government of Bangladesh; 2015.
- Beveridge C, Hossain F, Biswas RK, Haque AA, Ahmad S, Biswas NK, et al. Stakeholder-driven development of a cloud-based satellite remote sensing tool to monitor suspended sediment concentrations in major Bangladesh rivers. Environ Model Softw. 2020;133:104843.
- Bouchahma M, Yan W. Automatic measurement of shoreline change on Djerba Island of Tunisia. Comput Inf Sci. 2012;5(5):17-26.
- Chowdhury MZR, Nayon MH. Temporal trends in shoreline dynamics with forecasting and coastal vulnerability assessment of Kuakata area, Bangladesh. Bangladesh J Sci Ind Res. 2025;60(3):169-182.
- Chowdhury P, Sikder MdB. Shoreline dynamics in the reserved region of Meghna estuary and its impact on LULC and socio-economic conditions: a case study from Nijhum Dwip, Bangladesh. J Coast Conserv. 2023;28(1):1-14.
- Dolan R, Hayden BP, May P, May S. The reliability of shoreline change measurements from aerial photographs. Shore Beach. 1980;48(4):22-29.
- Emran A, Rob MA, Kabir MH, Islam MN. Modeling spatio-temporal shoreline and areal dynamics of coastal island using geospatial technique. Model Earth Syst Environ. 2016;2:1-11.
- Ghosh MK, Kumar L, Roy C. Monitoring the coastline change of Hatiya Island in Bangladesh using remote sensing techniques. ISPRS J Photogramm Remote Sens. 2015;101:137-144.
- Harley MD, Andriolo U, Armaroli C, Ciavola P. Shoreline rotation and response to nourishment of a gravel embayed beach using a low-cost video monitoring technique, San Michele-Sassi Neri, Central Italy. J Coast Conserv. 2014;18(5):551-565.
- Islam MdK, Hasan M, Rahman MM, Fayyaz R, Chowdhury M, Hamid T. Shoreline dynamics assessment of Moheshkhali Island of Bangladesh using integrated GIS-DSAS techniques. Dhaka Univ J Earth Environ Sci. 2023;11(1):1-12.
- Li LY, Ke CQ. Analysis of spatiotemporal snow cover variations in Northeast China based on moderateresolution-imaging spectroradiometer data. J Appl Remote Sens. 2014;8(1):084695.
- McFeeters SK. The use of the normalized Difference Water Index (NDWI) in the delineation of open water features. Int J Remote Sens. 1996;17(7):1425-1432.
- Peng J, Loew A, Verhoest NEC, Merlin O. A review of spatial downscaling of satellite remotely sensed soil moisture. Rev Geophys. 2017;55(2):341-366.
- Rahman SMM. Banglapedia National encyclopedia of Bangladesh. Dhaka: Asiatic Society of Bangladesh; 2012.
- Sarwar MG, Woodroffe CD. Rates of shoreline change along the coast of Bangladesh. J Coast Conserv. 2013;17(3):515-526.
- Schwartz M. Encyclopedia of coastal science. New York: Springer Science and Business Media; 2006.
- Shahid SB, Gani MR, Gani ND. Thirty-two years of changes in river paths and coastal landscape in Bangladesh Bengal Basin. J Sediment Environ. 2024;9(4):1035-1050.
- Thieler ER, Himmelstoss EA, Zichichi JL, Ergul A. Digital shoreline analysis system (DSAS) version 4.0: an ArcGIS extension for calculating shoreline change. US Geological Survey Open-File Report. Woods Hole: US Geological Survey; 2008.
- Wang XZ, Zhang HG, Fu B, Shi A. Analysis on the coastline change and erosion-accretion evolution of the Pearl River Estuary, China, based on remote-sensing images and nautical charts. J Appl Remote Sens. 2013;7(1):073519.
- Wang Y, Hou X, Jia M, Shi P, Yu L. Remote detection of shoreline changes in the eastern bank of Laizhou Bay, North China. J Indian Soc Remote Sens. 2014;42(3):621-631.
- Wei W, Tang Z, Dai Z, Lin Y, Ge Z, Gao J. Variations in tidal flats of the Changjiang (Yangtze) estuary during 1950s-2010s: future crisis and policy implication. Ocean Coast Manag. 2015;108:89-96.