
Research article · 2025 · Full text
International Journal of Advanced Chemistry ResearchAdsorptive removal of amoxicillin from aqueous solutions by spirogyra biomass: A kinetic and thermodynamic study
Volume 7(12) · Pages 23–32 · DOI: 10.33545/26646781.2025.v7.i12a.343 ↗
Research areasAdsorption and biosorption for pollutant removalPharmaceutical and Antibiotic Environmental ImpactsAdvanced oxidation water treatment
Abstract
Author-writtenBackground & Problem Statement: Emerging contaminants, particularly antibiotics, have emerged as significant environmental pollutants due to their widespread use and persistence in aquatic systems. Amoxicillin, a broad-spectrum β-lactam antibiotic, is frequently detected in wastewater and surface water, posing risks to aquatic ecosystems and human health. Conventional wastewater treatment methods fail to completely remove antibiotics, necessitating alternative approaches such as the adsorption method. Methodology: This study investigates the adsorption of Amoxicillin onto Spirogyra biomass under various conditions, including pH (3-9), contact time (0-180 minutes), initial Amoxicillin concentration (10-100 mg/L), and temperature (25 °C, 35 °C, 45 °C). Batch adsorption experiments were conducted, and the data were analyzed using kinetic and thermodynamic models. Thermodynamic parameters, including Gibbs free energy (ΔG°), enthalpy (ΔH°), and entropy (ΔS°), were calculated to assess the feasibility of the adsorption process. Key Findings: The maximum adsorption capacity of Spirogyra biomass for Amoxicillin was 21.68 mg g⁻¹, with optimal adsorption observed at pH 6.0. Adsorption followed the pseudo-second-order kinetic model, indicating chemisorption. The Langmuir model provided the best fit for equilibrium data, confirming monolayer adsorption. Thermodynamic analysis revealed that adsorption was spontaneous, endothermic, and associated with increased randomness at the solid-liquid interface. Conclusion: Spirogyra biomass proved to be an efficient, eco-friendly biosorbent for Amoxicillin removal from aqueous solutions. The adsorption process was favourable at higher temperatures, suggesting potential applications in wastewater treatment. These findings contribute to the development of sustainable strategies for mitigating antibiotic contamination in water bodies.
Summary
Source-checkedPlain-language reading of the full paper, prepared with AI and checked against the text. Each point links to the authors' own words.
Why it matters
- Antibiotics are significant environmental pollutants because they are used widely and persist in aquatic systems. View evidence ↗
- Amoxicillin is a broad-spectrum antibiotic often found in surface water and wastewater, which threatens human health and aquatic ecosystems. View evidence ↗
- Standard wastewater treatment is unable to fully remove antibiotics, making alternative methods like adsorption necessary. View evidence ↗
The question
- The study aims to evaluate Spirogyra sp. biomass as a sustainable, low-cost adsorbent for removing amoxicillin, focusing on its kinetics, isotherms, and thermodynamics. View evidence ↗
What they did
- Spirogyra sp. biomass was sourced from near Matasyagandha Lake in Saharsa, Bihar, India. View evidence ↗
- Batch experiments tested the effects of pH (3-9), contact time (0-180 minutes), initial amoxicillin concentration (10-100 mg/L), and temperature (25°C, 35°C, 45°C). View evidence ↗
- The process involved adding 2-20 g of biomass to 100 mL of amoxicillin solution and agitating the mixture at 150 rpm. View evidence ↗
- The biosorbent was characterized using FTIR for functional groups, SEM for morphology, and XRD for crystalline structure. View evidence ↗
What they found
- The highest adsorption capacity occurred at pH 6.0 (20.92 ± 0.34 mg g⁻¹), while capacities dropped at pH 3 (14.30 ± 0.42 mg g⁻¹) and pH 9 (13.86 ± 0.47 mg g⁻¹). View evidence ↗
- At an initial concentration of 50 mg/L, adsorption capacity rose from 10.65 ± 0.25 mg g⁻¹ at 30 minutes to 20.72 ± 0.38 mg g⁻¹ at 120 minutes. View evidence ↗
- Adsorption followed a pseudo-second-order kinetic model (R² > 0.99), which indicates that chemisorption is the rate-limiting step. View evidence ↗
- The Langmuir model provided the best fit for equilibrium data, showing a maximum adsorption capacity of 21.68 mg g⁻¹ and indicating monolayer adsorption on a homogeneous surface. View evidence ↗
- Thermodynamic analysis showed the process was endothermic (ΔH° ≈ +22.5 kJ·mol⁻¹), spontaneous (ΔG° from −4.8 to −6.6 kJ·mol⁻¹), and increased interfacial randomness (ΔS° ≈ +91.7 J·mol⁻¹·K⁻¹). View evidence ↗
What it means
- The authors conclude that Spirogyra sp. biomass is a cost-effective and eco-friendly material for removing antibiotics from contaminated water. View evidence ↗
Visual summary
2 visualsIllustrations explain the paper; they do not show study data.
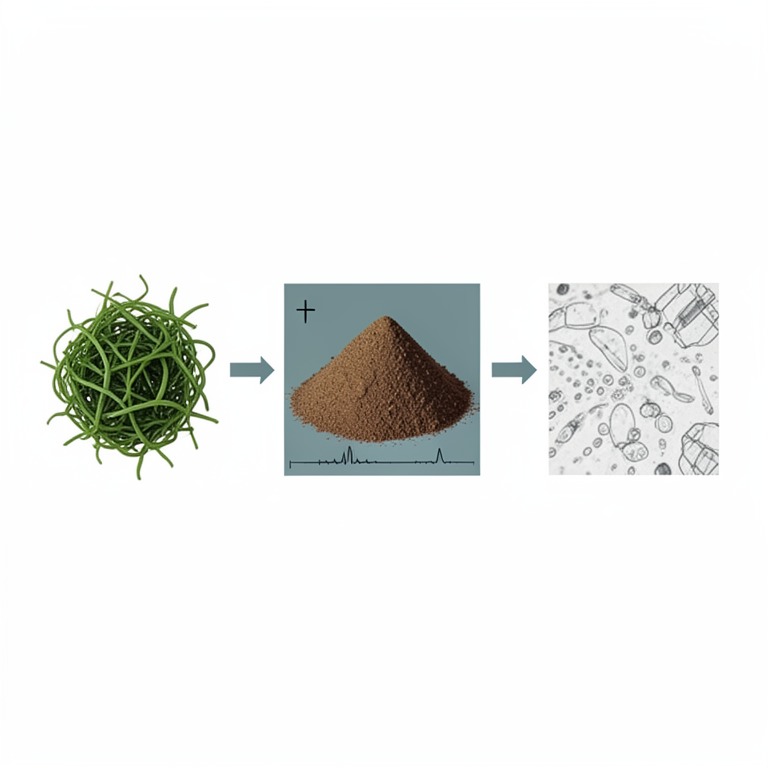
Biosorbent Characterization Workflow
AI-generated conceptual illustration (Spirogyra algae biomass). It explains the idea and does not show study data.
View source evidence ↗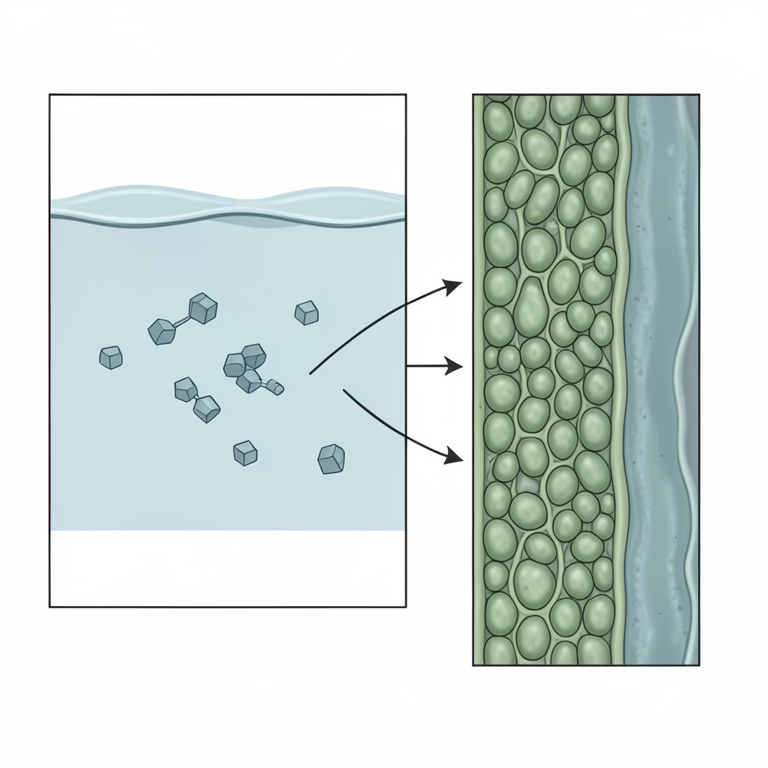
Adsorption Mechanism Concept
AI-generated conceptual illustration (Spirogyra algae biomass and amoxicillin molecules in water). It explains the idea and does not show study data.
View source evidence ↗Figures & tables
From the original paper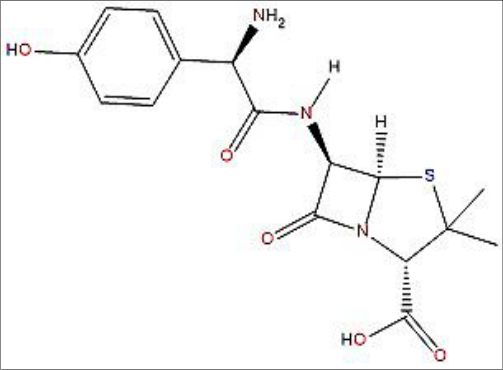 Figure 1
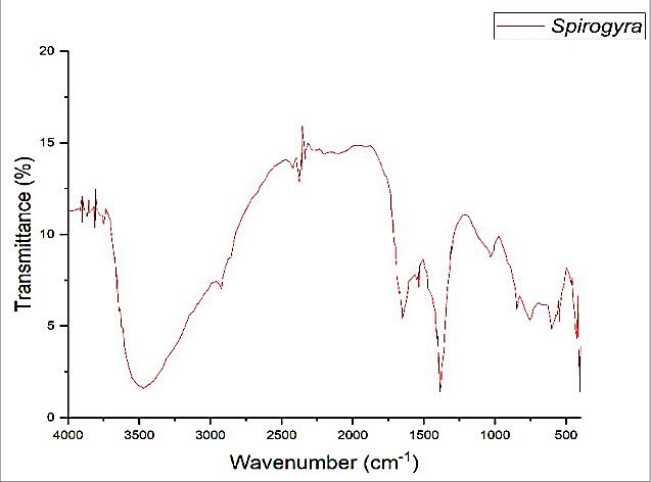 Figure 2
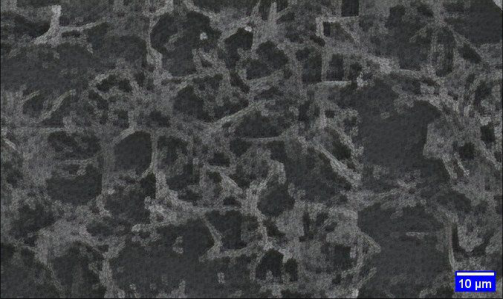 Figure 3
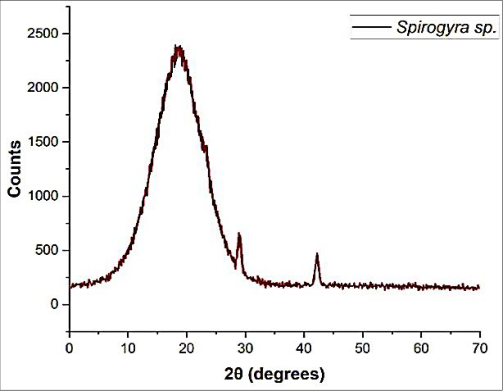 Figure 4
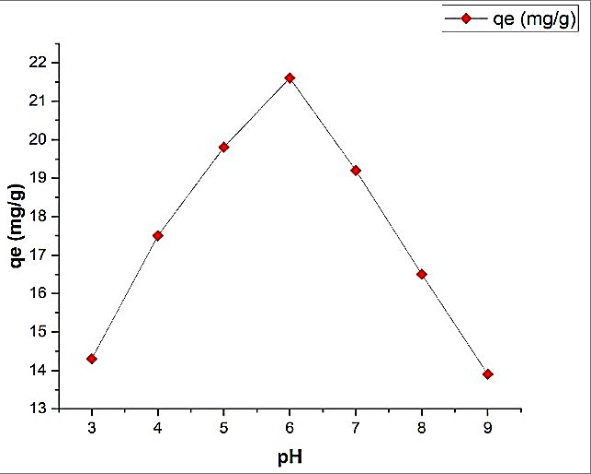 Figure 5
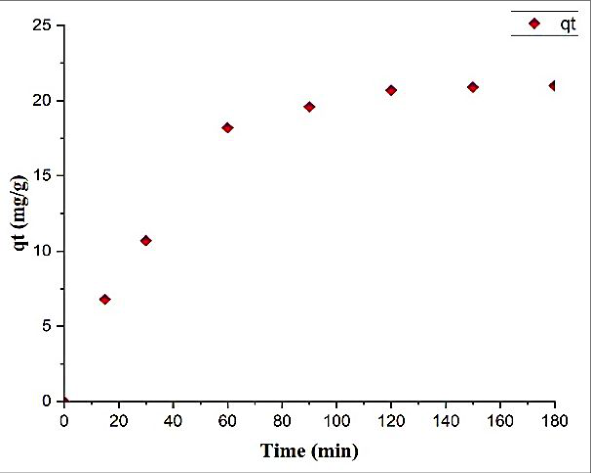 Figure 6
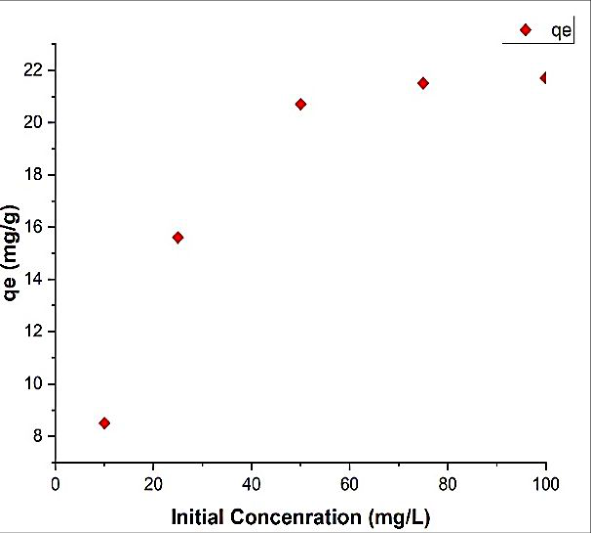 Figure 7
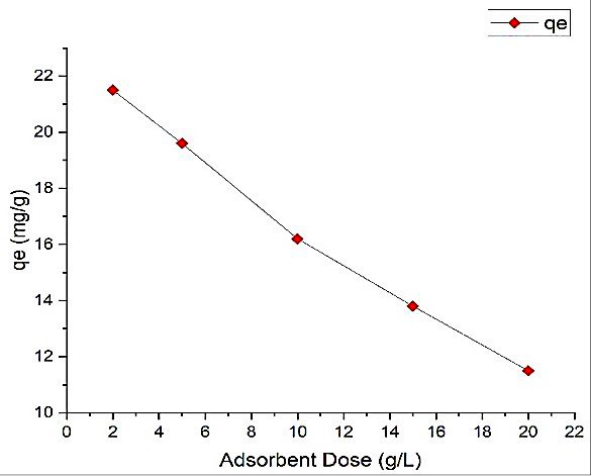 Figure 8
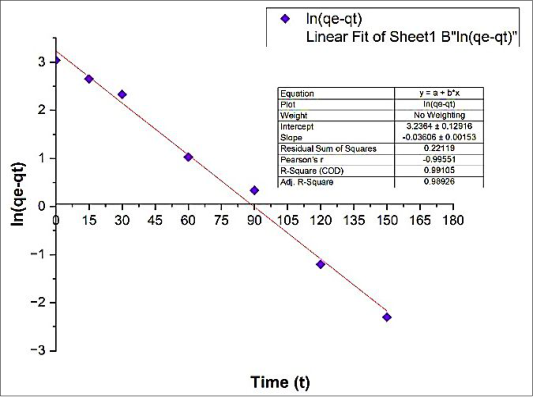 Figure 9
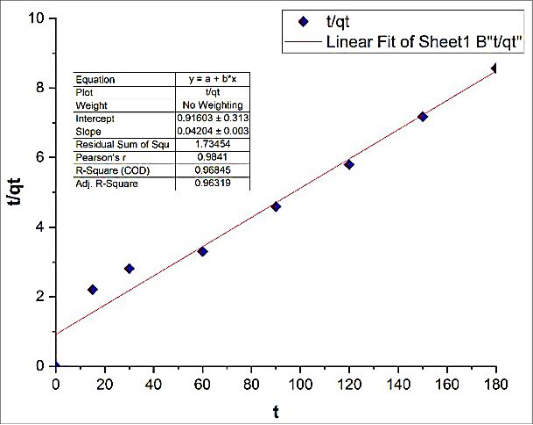 Figure 10
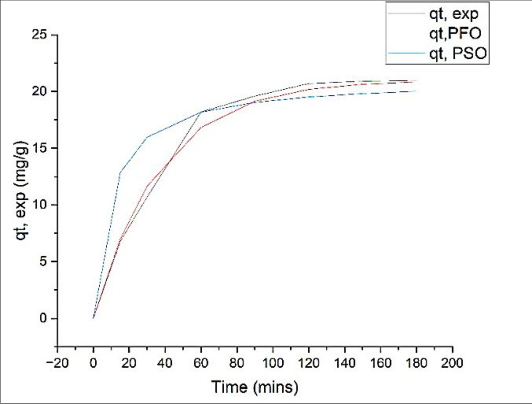 Figure 11
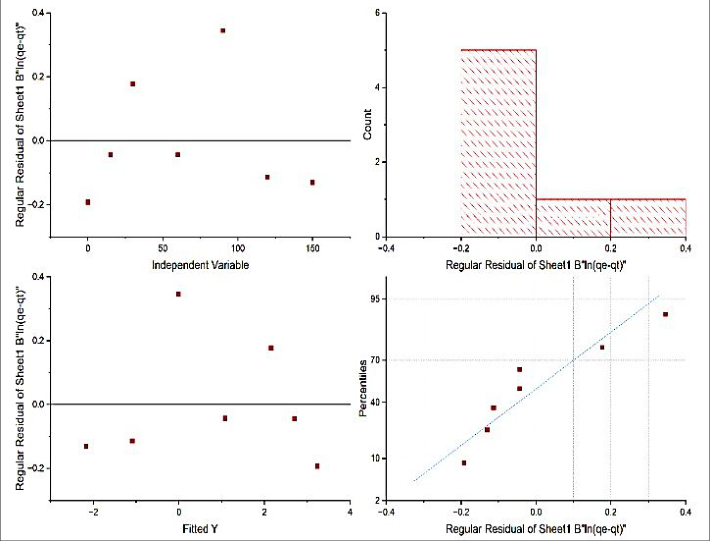 Figure 12
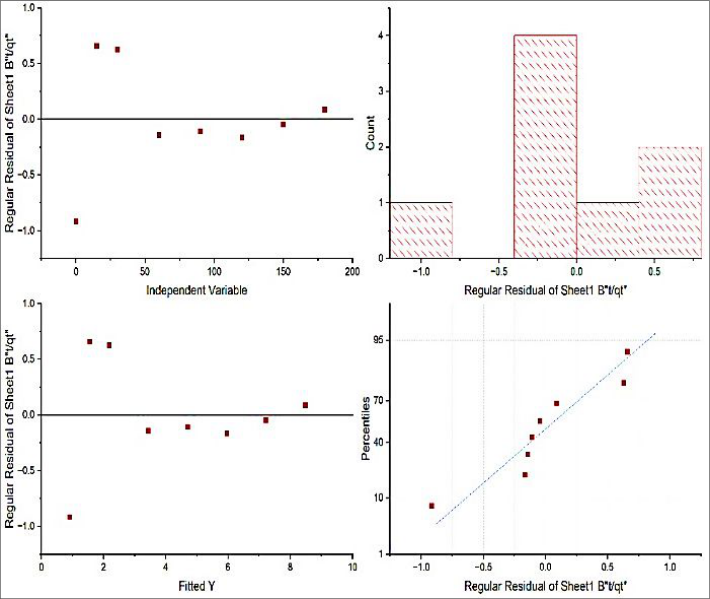 Figure 13
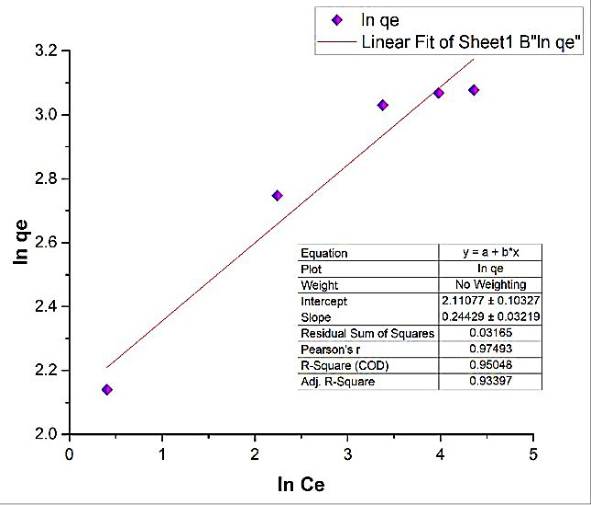 Figure 14
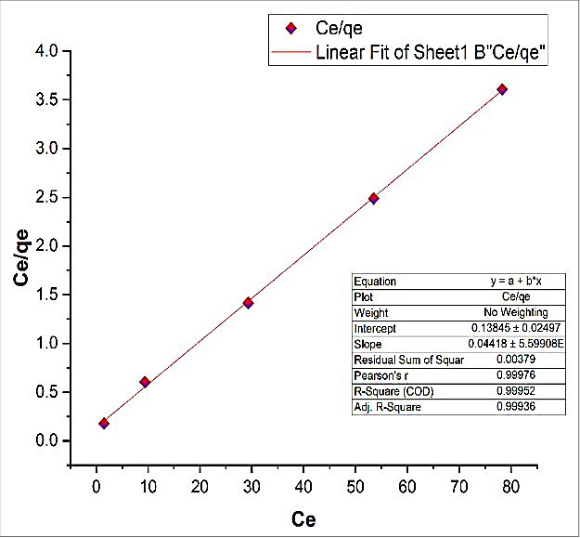 Figure 15
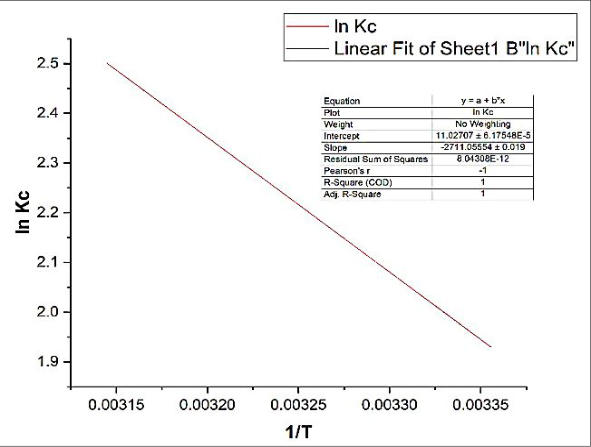 Figure 16
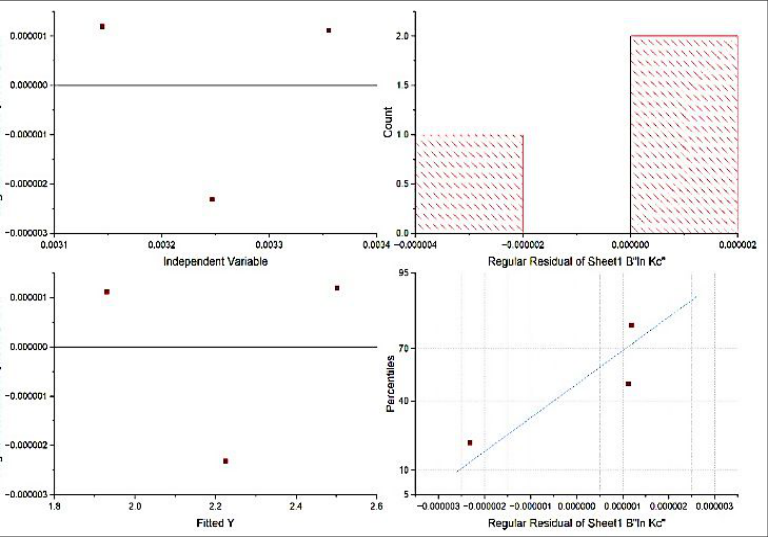 Figure 17
Introduction
The presence of antibiotic residues in the environment is a growing concern due to their continuous discharge into surface water through wastewater. Poorly degradable and highly soluble, these contaminants bypass conventional treatment, infiltrating groundwater and even drinking water, posing risks to aquatic and terrestrial life [1] . Amoxicillin, a broad-spectrum β-lactam antibiotic, is frequently detected in wastewater and surface water [2] . Conventional wastewater treatment technologies are often inadequate for the complete degradation of antibiotics, necessitating the exploration of alternative, eco-friendly, and cost-effective methods [3,4] . Adsorption is regarded as one of the most efficient techniques for the removal of organic contaminants, owing to its simplicity, low cost, and high efficiency [5,6] . Recently, the use of algal biomass as biosorbents has gained attention due to their abundance, biodegradability, and high adsorption capacity [7,8] . In this context, Spirogyra sp., a filamentous green alga, offers a promising biosorbent material due to its rich content of functional groups and surface area [9] . While algal biomass has been widely investigated for the adsorption of dyes, heavy metals, and nutrients, relatively few studies have explored its potential in antibiotic removal. Among antibiotics, amoxicillin is one of the most frequently detected contaminants in aquatic environments, yet systematic studies on its adsorption using green biosorbents remain scarce. In this context, the present work addresses this gap by evaluating Spirogyra sp. biomass as a low-cost and eco-friendly adsorbent for amoxicillin removal, with emphasis on adsorption kinetics, equilibrium isotherms, and thermodynamic behavior.
Methodology 2.1 Collection and Preparation of Biosorbent
The biomass of Spirogyra sp. was collected from Near Matasyagandha Lake, located in Saharsa, Bihar, India. After thoroughly washing with tap water to remove impurities like dirt and sand. After that double-distilled water (DDW) were utilized to remove rest impurities and then dried in a hot-air oven at 60 °C for 48 hours. The dried algal biomass was ground using a kitchen blender and sieved through a 30mesh sieve to obtain a uniform particle size of 250-500 µm. The biomass was stored in a plastic container at 40 °C until use. The spirogyra sp. biomass was analyzed at the Physical Laboratory (University Department of Chemistry), B.N.M.U. Madhepura, using the standard methods of AOAC [10] .
Characterization of Biosorbent.
The synthesized biosorbents were subjected to characterization through a range of analytical techniques. Fourier Transform Infrared Spectroscopy (FTIR) was utilized to identify the functional groups responsible for adsorption interactions. Scanning Electron Microscopy (SEM) was employed to examine the morphological characteristics of the adsorbents. X-ray Diffraction (XRD) analysis was conducted to ascertain the crystalline structure and phase composition of the adsorbents.
Preparation of Amoxicillin Solution
A stock solution of Amoxicillin (250 mg/L) was prepared by dissolving an appropriate amount of Amoxicillin trihydrate in distilled water. Working solutions of desired concentrations (10, 25, 50, 75, and 100 mg/L) were prepared by dilution.
Batch Adsorption Experiments
Batch adsorption experiments were employed to study the effect of various parameters, including pH (3-9), contact time (0-180 minutes), initial Amoxicillin concentration (10-100 mg/L), and temperature (25°C, 35°C, 45°C). These parameter ranges were selected based on their relevance to real-world wastewater conditions and their influence on adsorption efficiency, as reported in previous studies. The experiments were performed by adding an adsorbent dose (2-20 g) of Spirogyra sp. biomass to 100 mL of Amoxicillin solution in Erlenmeyer flasks. The mixture was agitated at 150 rpm.
Analytical Methods
After adsorption, the solution was filtered, and the residual Amoxicillin concentration was determined using a UV-Visible spectrophotometer at 229 nm wavelength. Calibration curves with R² = 0.9992 were used for accurate quantification.
Statistical Analysis and Model Selection Criteria
Non-linear/linear regressions were performed for kinetic, isotherm and thermodynamic models. Goodness of fit was evaluated using: coefficient of determination (R²), residual standard error / residual sum of squares (RSS), visual residual diagnostics (residuals vs. fitted/independent, histogram, and normal Q-Q), and agreement between calculated and experimental capacities (|qe,cal. -qe,exp.|).
Model selection prioritized (i) random residual pattern with near-zero mean, (ii) lowest RSS, and (iii) qe agreement; R² alone was not decisive.
Kinetic and Thermodynamic Analysis
Kinetic models, including pseudo-first-order and pseudosecond-order, were applied to analyze the adsorption data. Isotherm models such as Langmuir and Freundlich were used to describe the equilibrium data. Thermodynamic parameters, including Gibbs free energy change (ΔG°), enthalpy change (ΔH°), and entropy change (ΔS°), were calculated to assess the nature of the adsorption process.
Results and Discussion
Results and Discussion
Composition of Biomass Spirogyra sp.
The biochemical composition of Spirogyra sp. biomass in the present study was determined to be 61.0% total carbohydrates, 13.6% protein, 1.9% fat, and 12.2% ash, with a moisture content of 11.3%. These values are in close agreement with those reported by Vichit et al. (2023), who observed 64.0% carbohydrates, 12.9% protein, 1.6% fat, and 11.4% ash, with a moisture content of 10.0% [11] . When compared with the broader compositional ranges documented by Ge et al. (2018) for algal biomass 41.5-55.0% carbohydrates, 16.7-19.5% protein, and 2.8-10.0% fat-the results indicate that Spirogyra sp biomass generally exhibits a higher carbohydrate fraction while containing relatively lower protein and fat contents [12] . Such compositional variations may be attributed to differences in algal species, environmental conditions, and growth stages. From a biosorption perspective, the high carbohydrate content is particularly advantageous. Carbohydrate polymers, such as cellulose and polysaccharides, are rich in hydroxyl and carboxyl functional groups that can effectively interact with amoxicillin molecules through hydrogen bonding and electrostatic interactions. In contrast, the lower protein and fat fractions may reduce interference from nonpolar constituents, thereby enhancing the adsorption efficiency of the biomass.
Characterization of Biosorbent
The Spirogyra sp. biomass was characterized using FTIR, SEM, and XRD techniques to understand its surface properties and adsorption potential.
FTIR Analysis
The FTIR spectrum of Spirogyra sp biomass showed distinct peaks corresponding to functional groups involved in adsorption. A broad band around 3480 cm⁻¹ indicated the presence of -OH and -NH groups, while peaks near 2890 cm⁻¹ corresponded to C-H stretching. The band at ~1650
cm⁻¹ was attributed to C=O stretching of amide groups, and peaks at 1050-1150 cm⁻¹ suggested C-O stretching of polysaccharides. FTIR spectra of Spirogyra sp. biomass before and after adsorption demonstrated clear changes in functional group vibrations, particularly in the hydroxyl (-OH), carboxyl (-COOH), and amide regions, suggesting active involvement of these groups in amoxicillin binding. These functional groups are responsible for binding amoxicillin molecules through hydrogen bonding and electrostatic interactions.
SEM Analysis
SEM images revealed a porous and rough surface morphology that provides abundant active sites for adsorption, which became smoother and less porous after adsorption, indicating surface coverage by amoxicillin molecules.
XRD Analysis
The XRD pattern of Spirogyra sp. biomass exhibited a mostly amorphous structure with a few weak crystalline peaks, indicating the presence of organic biopolymers and minor mineral constituents. This amorphous nature is favorable for adsorption due to the availability of active binding sites. The broad halo at ~22° (2θ) indicates a predominantly amorphous structure typical of organic biopolymers, while weak reflections at ~26.6°, ~31.9°, and ~44.2° suggest minor mineral phases naturally present in matrix. XRD analysis confirmed the semicrystalline nature of the biomass, with a noticeable reduction in crystallinity following adsorption, further validating the interaction between the biomass matrix and the antibiotic molecules.
These results collectively confirm that surface functional groups, porosity, and crystallinity of Spirogyra biomass contribute significantly to its adsorption performance.
Effect of pH
The adsorption capacity of Spirogyra sp. biomass for Amoxicillin was significantly influenced by the pH of the solution. Maximum adsorption capacity (qmax) of 20.92 ± 0.34 mg g⁻¹ was observed at pH 6.0, with a decrease in adsorption capacity to 14.30 ± 0.42 mg g⁻¹ at pH 3 and 13.86 ± 0.47 mg g⁻¹ at pH 9. This trend can be attributed to the protonation and deprotonation of functional groups on the biomass surface and the speciation of Amoxicillin. Higher uptake at pH 6 suggests optimal electrostatic/hydrogen-bonding interactions between protonated/neutral amoxicillin moieties and deprotonated polysaccharidic -OH/-COO⁻ groups on Spirogyra sp.; suppression at low pH is attributed to H + competition, while decreased uptake at high pH likely arises from surface deprotonation and/or charge repulsion.
Effect of Contact Time and Initial Concentration
The adsorption capacity increased rapidly during the initial 60 minutes and gradually reached equilibrium at 120 minutes. For an initial concentration of 50 mg/L, the adsorption capacity increased from 10.65 ± 0.25 mg g⁻¹ at 30 minutes to 20.72 ± 0.38 mg g⁻¹ at 120 minutes. Higher initial Amoxicillin concentrations resulted in increased adsorption capacity due to the greater driving force for mass transfer. The rapid initial uptake reflects abundant vacant sites and film diffusion, followed by intraparticle diffusion and eventual site saturation.
Kinetic Studies
The adsorption kinetics followed the pseudo-second-order model with a high correlation coefficient (R² > 0.99), suggesting chemisorption as the rate-limiting step. The calculated equilibrium adsorption capacity (q e ) was consistent with experimental data, with a q e value of 20.85 mg g⁻¹ obtained from the pseudo-second-order kinetic model closely matching the experimental value of 21.10± 0.37 mg g⁻¹, thereby validating the reliability of the kinetic analysis.
The maximum adsorption capacity of Spirogyra sp. biomass obtained in this study (21.68 mg g⁻¹, Langmuir isotherm) is comparable to or higher than many reported biosorbents. For instance, Chlorella sp. biomass exhibited 18.2 mg g⁻¹ for cephalexin (Angulo et al., 2018). This comparison highlights that Spirogyra biomass is a competitive and sustainable adsorbent for antibiotic removal, validating its practical potential in wastewater treatment. Kinetic data were fitted to pseudo-first-order (PFO) and pseudo-second-order (PSO) models. While the linear fit of PFO gave a high R² (≈0.991), PSO provided closer agreement between q e,cal. and q e,exp. and a lower residual scatter (see residual diagnostics below). Accordingly, adsorption is best described by the PSO model, indicating that chemisorption governs the rate via electron sharing/exchange with surface functional groups. The PSOderived 끫뢼끫뢤 (≈20.8 mg g⁻¹) is consistent with the experimental value (≈21.1 mg g⁻¹). Combining statistical fit and residual behavior, PSO is selected as the governing kinetic model for amoxicillin uptake by Spirogyra sp. biomass.
Isotherm Studies
The equilibrium data were best fitted to the Langmuir isotherm model, indicating monolayer adsorption on a homogenous surface. The maximum adsorption capacity (qmax) was determined to be 21.68 mg g⁻¹ with a Langmuir constant (K L ) of 0.248 L/mg. The Freundlich model also showed a reasonable fit, with a Freundlich constant (K F ) of The Langmuir plot demonstrates an excellent linear fit (R 2 =0.9995), suggesting that adsorption follows a monolayer coverage model on a homogeneous surface with finite identical sites. From the slope (0.04418) and intercept (0.13845), the calculated maximum adsorption capacity is q max = 1/slope ≈ 22.64 mg g⁻¹, and the Langmuir constant is K L = slope/intercept ≈ 0.319 L/mg.
Between the two models, both Freundlich and Langmuir describe the adsorption process well, but the higher R 2 and consistency with q e,exp suggest that the Langmuir model provides a superior fit, indicating that amoxicillin adsorption onto Spirogyra sp. biomass occurs predominantly as a monolayer on homogeneous sites.
Thermodynamic Studies
The standard thermodynamic parameters were evaluated from the van't Hoff relation, ln 끫롼 끫뢠 = ∆끫롶°끫뢊 끫뢊 + ∆끫뢌°끫뢊 . The negative slope of ln 끫롼 끫뢠 vs.
Conclusion
This study demonstrated that Spirogyra sp. biomass is an effective biosorbent for the removal of Amoxicillin from aqueous solutions. The adsorption process was influenced by pH, contact time, initial concentration, and temperature. Kinetic studies revealed that the adsorption followed pseudo-second-order kinetics, while isotherm analysis indicated monolayer adsorption as per the Langmuir model. Thermodynamic parameters confirmed the endothermic and spontaneous nature of the adsorption process.
Model-selection takeaway
Although the PFO linear regression returned a slightly higher R² on one linearization, the pseudo-second-order model was chosen on the basis of 1. closer agreement between qe,cal and qe,exp, 2. lower residual scatter with random structure, and 3. better reproduction of the full qt-t trajectory near equilibrium. Together with the Langmuir isotherm and favorable thermodynamic parameters, these results indicate chemisorption-dominated, monolayer uptake that is spontaneous and endothermic for amoxicillin on Spirogyra sp. Biomass.
The findings suggest that Spirogyra sp. biomass can be used as an eco-friendly, cost-effective material for removing antibiotics from contaminated water.
Figures and tables from the paper
References
12 in the original paper- Milić N, Milanović M, Letić NG, Sekulić MT, Radonić J, Mihajlović I, Miloradov MV. Occurrence of antibiotics as emerging contaminant substances in aquatic environment. International Journal of Environmental Health Research. 2013;23(4):296-310. doi:10.1080/09603123.2012.733934.
- Oberoi AS, Jia Y, Zhang H, Khanal SK, Lu H. Insights into the fate and removal of antibiotics in engineered biological treatment systems: a critical review. Environmental Science and Technology. 2019;53(13):7234-7264. doi:10.1021/acs.est.9b01131.
- Phoon BL, Ong CC, Saheed MSM, Show P, Chang J, Ling TC, Lam SS, Juan JC. Conventional and emerging technologies for removal of antibiotics from wastewater. Journal of Hazardous Materials. 2020;400:122961. doi:10.1016/j.jhazmat.2020.122961.
- Samrot AV, Wilson S, Sanjay Preeth RS, Prakash P, Sathiyasree M, Saigeetha S, Shobana N, Pachiyappan S, Rajesh VV. Sources of antibiotic contamination in wastewater and approaches to their removal-an overview. Sustainability. 2023;15(16):12639. doi:10.3390/su151612639.
- Dutta S, Gupta B, Srivastava SK, Gupta AK. Recent advances on the removal of dyes from wastewater using various adsorbents: a critical review. Materials Advances. 2021;2(14):4497-4531. doi:10.1039/d1ma00354b.
- Kumar D, Kumar K. Fluoride removal from water using adsorption method with different compounds: a comprehensive review. Journal for Research in Applied Sciences and Biotechnology. 2023;2(5):132-138. doi:10.55544/jrasb.2.5.22.
- Anastopoulos I, Kyzas GZ. Progress in batch biosorption of heavy metals onto algae. Journal of Molecular Liquids. 2015;209:77-86. doi:10.1016/j.molliq.2015.05.023.
- Angulo E, Bula L, Mercado I, Montaño A, Cubillán N. Bioremediation of cephalexin with non-living Chlorella sp. biomass after lipid extraction. Bioresource Technology. 2018;257:17-22. doi:10.1016/j.biortech.2018.02.079.
- Wijaya A, Ahmad N, Hanum L, Melwita E, Lesbani A. Spirogyra sp. macro-algae-supported NiCr-LDH adsorbent for enhanced Remazol Red dye removal. Results in Surfaces and Interfaces. 2025;18:100427. doi:10.1016/j.rsurfi.2025.100427.
- Latimer GW. Official Methods of Analysis of AOAC International. 21st ed. Gaithersburg (MD): AOAC International; 2019.
- Vichit S, Salakkam A, Fiala K. Exploring the utilization potential of Spirogyra sp. biomass for ethanol production: a study on saccharification optimization and high-temperature ethanol fermentation. Processes. 2023;11(10):2920. doi:10.3390/pr11102920.
- Ge S, Madill M, Champagne P. Use of freshwater macroalgae Spirogyra sp. for the treatment of municipal wastewaters and biomass production for biofuel applications. Biomass and Bioenergy. 2018;111:213223.